*[Minhaz Kazi](https://twitter.com/_mkazi_), Developer Advocate, Google Analytics -- April
2023*
*"But why won't the numbers match with the UI?"*
If you have worked with the BigQuery event export data for your GA4 property,
you definitely have asked this question at some point. Or worse - someone else
asked you this. And while trying to answer it, you probably have been asked the
dreaded followup question:
*"And where does it say that?"*
With this post, we will try to shed light on both.
Before we go into details of how the numbers vary, it is important to understand
the intended purpose of the BigQuery event export data. Google Analytics users
send their collected data to GA via one of the collection methods - [Google
Tag](https://developers.google.com/tag-platform/gtagjs), [Google Tag Manager](https://developers.google.com/tag-platform/tag-manager), [Measurement Protocol](https://developers.google.com/analytics/devguides/collection/protocol/ga4), [SDKs](https://firebase.google.com/docs/analytics/get-started?platform=android), and [Data Import](https://support.google.com/analytics/answer/10071301).
Based on the GA property's settings, Google Analytics does significant value
addition to the collected data before it reaches the standard reporting surfaces
including [standard reports](https://support.google.com/analytics/answer/9212670), [Explorations](https://support.google.com/analytics/answer/7579450), and the [Data API](https://developers.google.com/analytics/devguides/reporting/data/v1). These value
additions can include inclusion of Google Signals, modeling, traffic
attribution, prediction etc.
The standard reporting surfaces aim to provide the maximum value to GA users at
the lowest friction. However, we understand that on the broad spectrum of users,
some might want to supplement the value additions by Google Analytics or even do
something completely customized. For these users, BigQuery event export is the
intended starting point. BigQuery event export will have **collected data**,
which is sent from the client or app to Google Analytics. BigQuery event export
will not contain granular data on most value additions mentioned above.
Thus, for a large number of use cases, the standard reporting surfaces and the
BigQuery export data aren't expected to be reconcilable when it comes to these
value addition parts. If there is internal consistency in both and they match
with what you are collecting, you should be good to go.
Now let's get into some of the specific reasons for the differences and explore
ways for mitigating them when possible. This post focuses on the BigQuery
Daily event export only and not the Streaming export.
## Sampling
For accurate comparison of your BigQuery export data with standard reports, Data
API reports, or Exploration reports, confirm they are not based on sampled data.
[Data Sampling in GA4](https://support.google.com/analytics/answer/13331292) provides further details and ways to address sampling.
## Active users
If you count all the users who have logged at least one event on your GA4
property, you will get the *Total Users* metric. Although the *Total Users*
metric is available in Explorations in GA4 UI, the primary user metric used for
reporting in GA4 is *[Active Users](https://support.google.com/analytics/answer/11986666#users&zippy=%2Cin-this-article)* . In GA4 UI and in reports, if only *Users*
is mentioned, that usually refers to *Active Users* . So when calculating user
count from BigQuery data, you will need to filter and keep only the active users
to make the numbers comparable to the GA UI. The calculation method will also
vary based on your selected [Reporting Identity](https://support.google.com/analytics/answer/10976610).
### Technical implementation
In BigQuery event export data, if you count the number of distinct User IDs, you
will get the *Total Users* count. Here's a sample query that shows both Total
Users and New Users based on `user_pseudo_id`:
-- Example: Get 'Total User' (Active User), 'New User', and 'Returning User' counts.
WITH
UserInfo AS (
SELECT
user_pseudo_id,
MAX(IF(event_name IN ('first_visit', 'first_open'), 1, 0)) AS is_new_user
-- Replace table name.
FROM `bigquery-public-data.ga4_obfuscated_sample_ecommerce.events_*`
-- Replace date range.
WHERE _TABLE_SUFFIX BETWEEN '20201101' AND '20201130'
GROUP BY 1
)
SELECT
COUNT(*) AS active_users,
SUM(is_new_user) AS new_users,
COUNT(*) - SUM(is_new_user) AS returning_users
FROM UserInfo;
To select only active users, limit your query to events where `is_active_user`
is `true`:
-- Example: Get exact and approximate Active User count.
WITH
ActiveUsers AS (
SELECT
user_pseudo_id
-- Replace table name.
FROM `bigquery-public-data.ga4_obfuscated_sample_ecommerce.events_*`
-- Replace date range.
WHERE _TABLE_SUFFIX BETWEEN '20201101' AND '20201130'
AND is_active_user
GROUP BY 1
)
SELECT
COUNT(DISTINCT user_pseudo_id) AS exact_active_user_count,
APPROX_COUNT_DISTINCT(user_pseudo_id) AS approx_active_user_count
FROM ActiveUsers;
## HyperLogLog++
Google Analytics uses HyperLogLog++ (HLL++) algorithm to estimate cardinality
for common metrics including Active Users and Sessions. That means when you view
the unique count of these metrics in the UI or via the API, they are an
approximation with a certain precision. In BigQuery, since you have access to
the granular data, you can calculate the exact cardinality for these metrics. So
metrics can vary by a small percentage. At 95% confidence interval, the
precision might be ±1.63% for session count. The precision levels will vary for
different metrics and will change according to the confidence intervals. See
[HLL++ Sketches](https://cloud.google.com/bigquery/docs/reference/standard-sql/sketches#sketches_hll) for the precision levels at different confidence intervals for
different precision parameters of HLL++.
### Technical implementation
See [Unique count approximation in Google Analytics](https://developers.google.com/analytics/blog/2022/hll) to understand how HLL++
implemented in Google Analytics and how you can replicate the functionality
using BigQuery queries.
## Data collection delay
The daily export tables are created after GA collects all events for the day.
The daily tables can get updated up to 72 hours beyond the date of the table
with events that are time-stamped with the date of the table. Read [details
about this and see examples](https://support.google.com/analytics/answer/9358801). This is more of an issue if
your Firebase SDK or Measurement Protocol implementation sends in offline or
delayed events. Depending on when the standard reporting surface and BigQuery
are [updated](https://support.google.com/analytics/answer/11198161) within those 72 hours, you might see differences
between them. For such implementation, comparisons should be made on data older
than 72 hours.
## High-cardinality reports
Assume you are viewing a report through standard reports or the Data API.
The report surfaces a large amount of data and has dimensions with high
[cardinality](https://support.google.com/analytics/answer/12226705). High cardinality dimensions might cause the report to exceed the
cardinality limit for the underlying table. When this happens, Google Analytics
will group less frequent values and label them as *(other)*.
Using a **simplified and small scale example**, if the cardinality limit for the
underlying table is 10 row, this is what you can expect to happen:
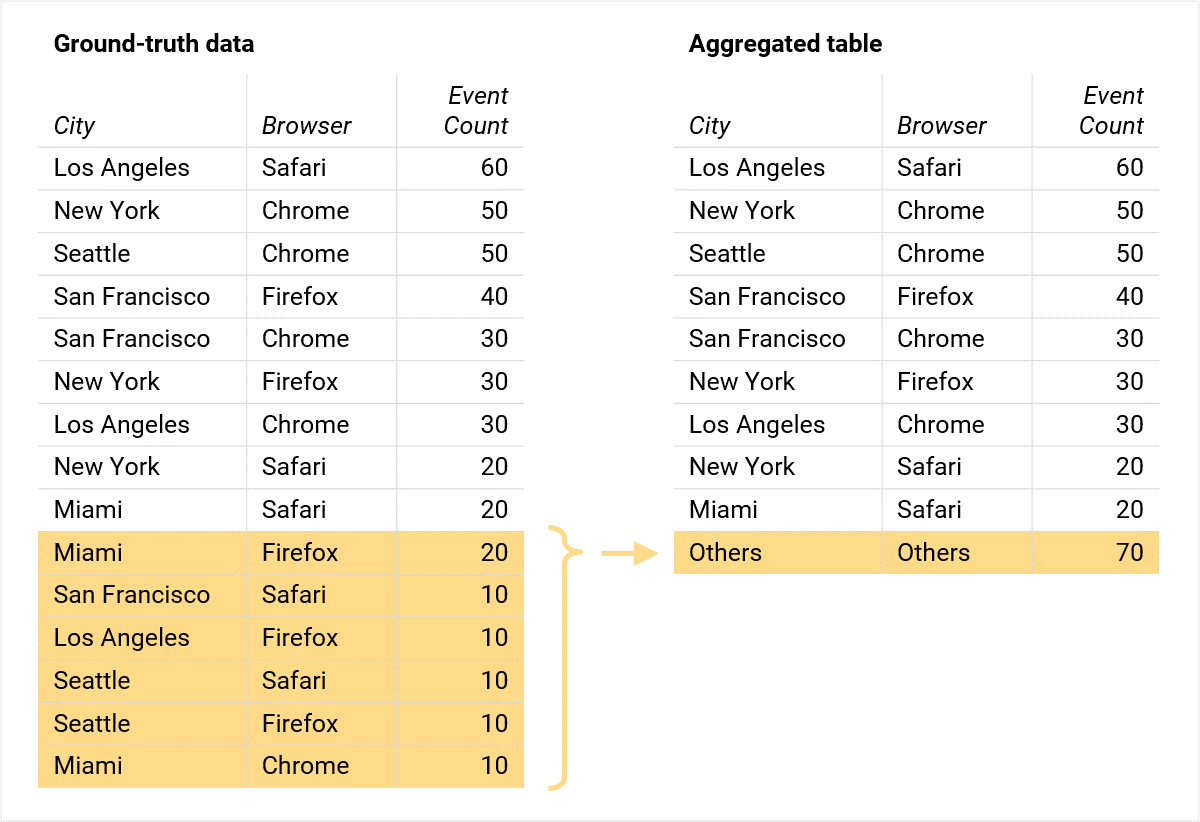
As you can see, the total number of events remains unchanged. However, less
frequent values get grouped together and you cannot re-aggregate the table based
on any dimension (e.g. you can't take the aggregate table and derive the total
event count for a specific city with high precision). The example gets more
profound if you filter the aggregate data based on any of the dimensions.
This grouping of the (other) row happens only in the reporting module and the
Data API when the report crosses the cardinality limit. If you do your
calculations from BigQuery, you will always end up with the ground-truth data -
the most granular rows. Read more [about the (other) row and best practices on
how to avoid it](https://support.google.com/analytics/answer/13331684).
## Google Signals
[Activating Google Signals](https://support.google.com/analytics/answer/9445345) on your GA4 property has several benefits including
deduplicating users across platforms and devices. If you don't collect user
IDs or activate Google Signals and a person views your website on three
different web browsers, then Google Analytics attributes that activity to three
different users, and BigQuery export will have three separate `user_pseudo_id`s.
In contrast, with Google Signals activated and the person logged into their
single Google Account in all three browsers, Google Analytics attributes that
activity to *one* user and reflects that count in standard reporting surfaces.
However, BigQuery will still show three separate `user_pseudo_id`s because
Google Signals information is not available in the BigQuery export. Thus,
reports with Google Signals data will most likely have less user count compared
to BigQuery export.
The best way to lessen this effect is to [implement User-IDs](https://support.google.com/analytics/answer/9213390) in your GA4
property along with activating Google Signals. This will ensure that the
deduplication happens first based on `user_id`. For signed in users, `user_id`
field will be populated in BigQuery and can be used for calculation purposes.
However, for users that are not signed in (i.e., sessions without `user_id`),
Google Signals will still be used for deduplication.
Also note that certain reports in standard reporting surfaces might have
[thresholding applied](https://support.google.com/analytics/answer/9383630) and not return certain data. Most information that can be
subject to thresholding usually is not available in the BigQuery export.
## Consent mode and modeled data
[Consent mode on websites and mobile apps](https://support.google.com/analytics/answer/9976101) lets you communicate your users'
cookie or app identifier consent status to Google. When visitors deny consent,
GA4 fills the data collection gaps with [key event modeling](https://support.google.com/analytics/answer/10710245) and [behavioral
modeling](https://support.google.com/analytics/answer/11161109). None of the modeled data is available in the BigQuery event export.
When consent mode is implemented, BigQuery dataset will contain cookieless pings
collected by GA and each session will have a different `user_pseudo_id`. Due to
modeling, there will be differences between the standard reporting surfaces and
the granular data in BigQuery. For example, due to behavioral modeling, you
might see less number of active users compared to the BigQuery export as
modeling might try to predict the multiple sessions from individual consentless
users.
Again, to reduce the effect of this, you should [implement User-IDs](https://support.google.com/analytics/answer/9213390) in your GA4
property. `user_id` and custom dimensions are exported to BigQuery regardless of
the consent status of your users.
## Traffic attribution data
In BigQuery traffic attribution data is available at user (first visit) and
event level. These are the collected data. However, since Google Analytics
implements its own attribution model at session level, that information is
neither directly available in BigQuery export nor can it be calculated with full
accuracy with the available data. Depending on your use case, you can consider
joining the BigQuery dataset with any relevant first party data and building
your own attribution model. In the future, additional collected data for traffic
attribution might be available through BigQuery event export.
## Common calculation errors
- **Calculation method:** When calculating different metrics in BigQuery, ensure you are using the correct methodology. For example:
- The standard method of counting sessions for Google Analytics 4 properties is counting the unique combinations of `user_pseudo_id`/`user_id` and `ga_session_id` regardless of the timeframe. In Universal Analytics, sessions would reset at midnight. If you follow the UA model, calculate sessions for each day, and add them up to get a total session count, you would be double counting the sessions that span across multiple days.
- Depending on your selected [Reporting Identity](https://support.google.com/analytics/answer/10976610), the user count calculation method will have to be updated.
- **Dimension and metric scope**: Ensure that your calculations use the correct user, session, item, or event level scope.
- **Time Zone** : In BigQuery export, `event_date` is for the reporting time zone while `event_timestamp` is an UTC timestamp in microseconds. So ideally, if one uses `event_timestamp` in a query, it has to be adjusted for the correct reporting time zone when comparing with UI numbers.
- **Data filtering and Export limits** : If you have setup [Data Filtering](https://support.google.com/analytics/answer/9823238#datafiltering&zippy=%2Cin-this-article) for your BigQuery event export or your daily event export volume has exceeded the limit, the BigQuery event export data will not match with the standard reporting surfaces.
WITH all that, there is a bit to UNNEST in this post. Hopefully you can SELECT
the right solutions for your DISTINCT project FROM the guidelines here. If you
have questions, JOIN the [GA Discord server](http://goo.gle/ga-discord) WHERE queries are most welcome!