
يتيح لك المحاكي في وحدة تحكّم المهام اختبار الإجراء من خلال واجهة ويب سهلة الاستخدام تتيح لك محاكاة الأجهزة وإعداداتها. يمكنك أيضًا الوصول إلى معلومات تصحيح الأخطاء، مثل الطلب والردّ اللذان يتلقّاهما طلبك ويرسلانه.
لاختبار "مهمة اللوحة التفاعلية" في المحاكي، عليك تحديد الخيار الشاشة الذكية أو الهاتف. تتيح لك هذه الخيارات الاطّلاع على كيفية ظهور الإجراء الخاص بك على الأجهزة المزوّدة بشاشات.
لاستخدام المحاكي، اتبع الخطوات التالية:
- احرص على نشر أحدث إصدار من الرمز عبر أداة تعديل الرموز المضمّنة في Dialogflow.
- انتقِل إلى وحدة تحكّم الإجراءات.
- انقر على اختبار في القائمة العلوية.
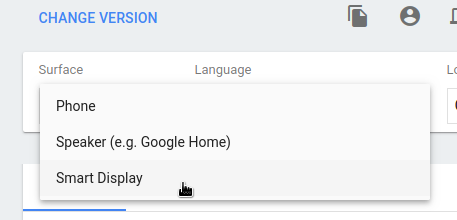
اختَر شاشة ذكية أو الهاتف ضمن سطح المكتب.
ضمن الإدخال المقترَح، انقر على شريحة الاقتراحات بعنوان
Talk to my
test app
لبدء محادثة مع وكيلك. يمكنك أيضًا كتابةTalk to my test appوالضغط على Enter في حقل Input (الإدخال).
تصحيح أخطاء الإجراء
تعرض علامة التبويب تصحيح الأخطاء في المحاكي الحمولة الفعلية التي يرسلها "مساعد Google"
إلى عملية التنفيذ في العنصر assistantToAgentJson
(يمكنك الاطّلاع على المستندات المرجعية للطلب)
والاستجابة من عملية التنفيذ في كائن agentToAssistant
(اطّلِع على المستندات المرجعية بشأن الاستجابة).
لنسخ معلومات تصحيح الأخطاء إلى الحافظة، انقر على رمز الحافظة في أعلى يسار لوحة معلومات تصحيح أخطاء JSON.
يمكنك أيضًا استخدام أدوات مطوري البرامج في Chrome لتصحيح أخطاء إطار iframe الذي يستضيف تطبيق الويب على صفحة المحاكي على الويب.