تصحيح الأخطاء في تطبيق الويب "لوحة الرسم" التفاعلي باستخدام "أدوات مطوري البرامج في Chrome"
تنظيم صفحاتك في مجموعات
يمكنك حفظ المحتوى وتصنيفه حسب إعداداتك المفضّلة.
يمكنك تصحيح الأخطاء في تطبيق الويب "لوحة الرسم التفاعلي" باستخدام أدوات مطوري البرامج في Chrome. يتوفّر برنامج تصحيح أخطاء Chrome
على شاشات Google Home أو شاشات Google Nest الذكية التي تعمل بالإصدار 30 من البرامج
أو الإصدارات الأحدث (يبدأ طرح هذا التحديث في تشرين الأول (أكتوبر) 2020)
والإصدار 1.50 أو الإصدارات الأحدث من البرامج الثابتة لجهاز Google Cast. يمكنك الاطّلاع على الإصدارات التي تقلّ عن System settings / About device على الشاشة الذكية.
إعداد البيئة
قبل أن تتمكن من تصحيح الأخطاء، نفِّذ ما يلي لإعداد بيئتك بشكل صحيح:
فعِّل الإجراء الخاص بك للاختبار في محاكي وحدة تحكم المهام.
وصِّل جهازك بالشبكة المحلية نفسها التي يتصل بها جهاز Google Home
أو جهاز Google Nest الذي تختبره.
تأكَّد من أنّ شبكتك لا تحظر حِزم البيانات بين الأجهزة.
سجِّل الدخول باستخدام حساب Google نفسه في وحدة تحكّم المهام وعلى جهاز Google Home أو Google Nest.
عندما تصبح البيئة المحيطة بك جاهزة، يمكنك تشغيل الإجراء الخاص بك على الشاشة الذكية التجريبية.
ربط تطبيق الويب "لوحة الرسم" ببرنامج تصحيح الأخطاء
لربط تطبيق "لوحة الرسم" على الويب بأداة تصحيح الأخطاء في "أدوات مطوري البرامج في Chrome"، يُرجى اتّباع الخطوات التالية:
في حقل العنوان في متصفِّح Chrome، أدخِل chrome://inspect#devices
لتشغيل "أداة فحص Chrome". من المفترَض أن تظهر قائمة بالأجهزة على الصفحة، ويجب إدراج عنوان URL لملف HTML الخاص بلوحة الرسم تحت اسم جهاز Google Home أو Google Nest الذي تم اختباره. تجدر الإشارة إلى أنّ اكتشاف Chrome
لجميع الأجهزة على شبكتك قد يستغرق بعض الوقت.
انقر على الرابط inspect أسفل عنوان URL الخاص بتنسيق HTML لتفعيل "أدوات مطوري البرامج في Chrome".
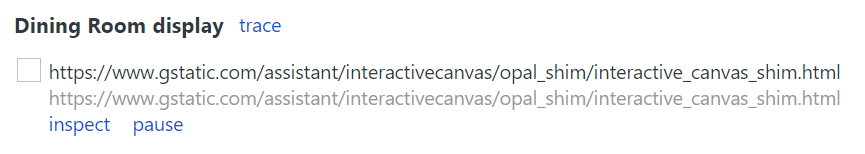
يتم تحميل "أدوات مطوري البرامج في Chrome" في نافذتها الخاصة. يمكنك النقر على زر التسجيل الرقمي للشاشة
()
للاطّلاع على واجهة المستخدم التصويرية على الويب المعروضة على الجهاز. تعرض لقطة الشاشة التالية كيفية ظهور
تطبيق الويب في "أدوات مطوري البرامج في Chrome":
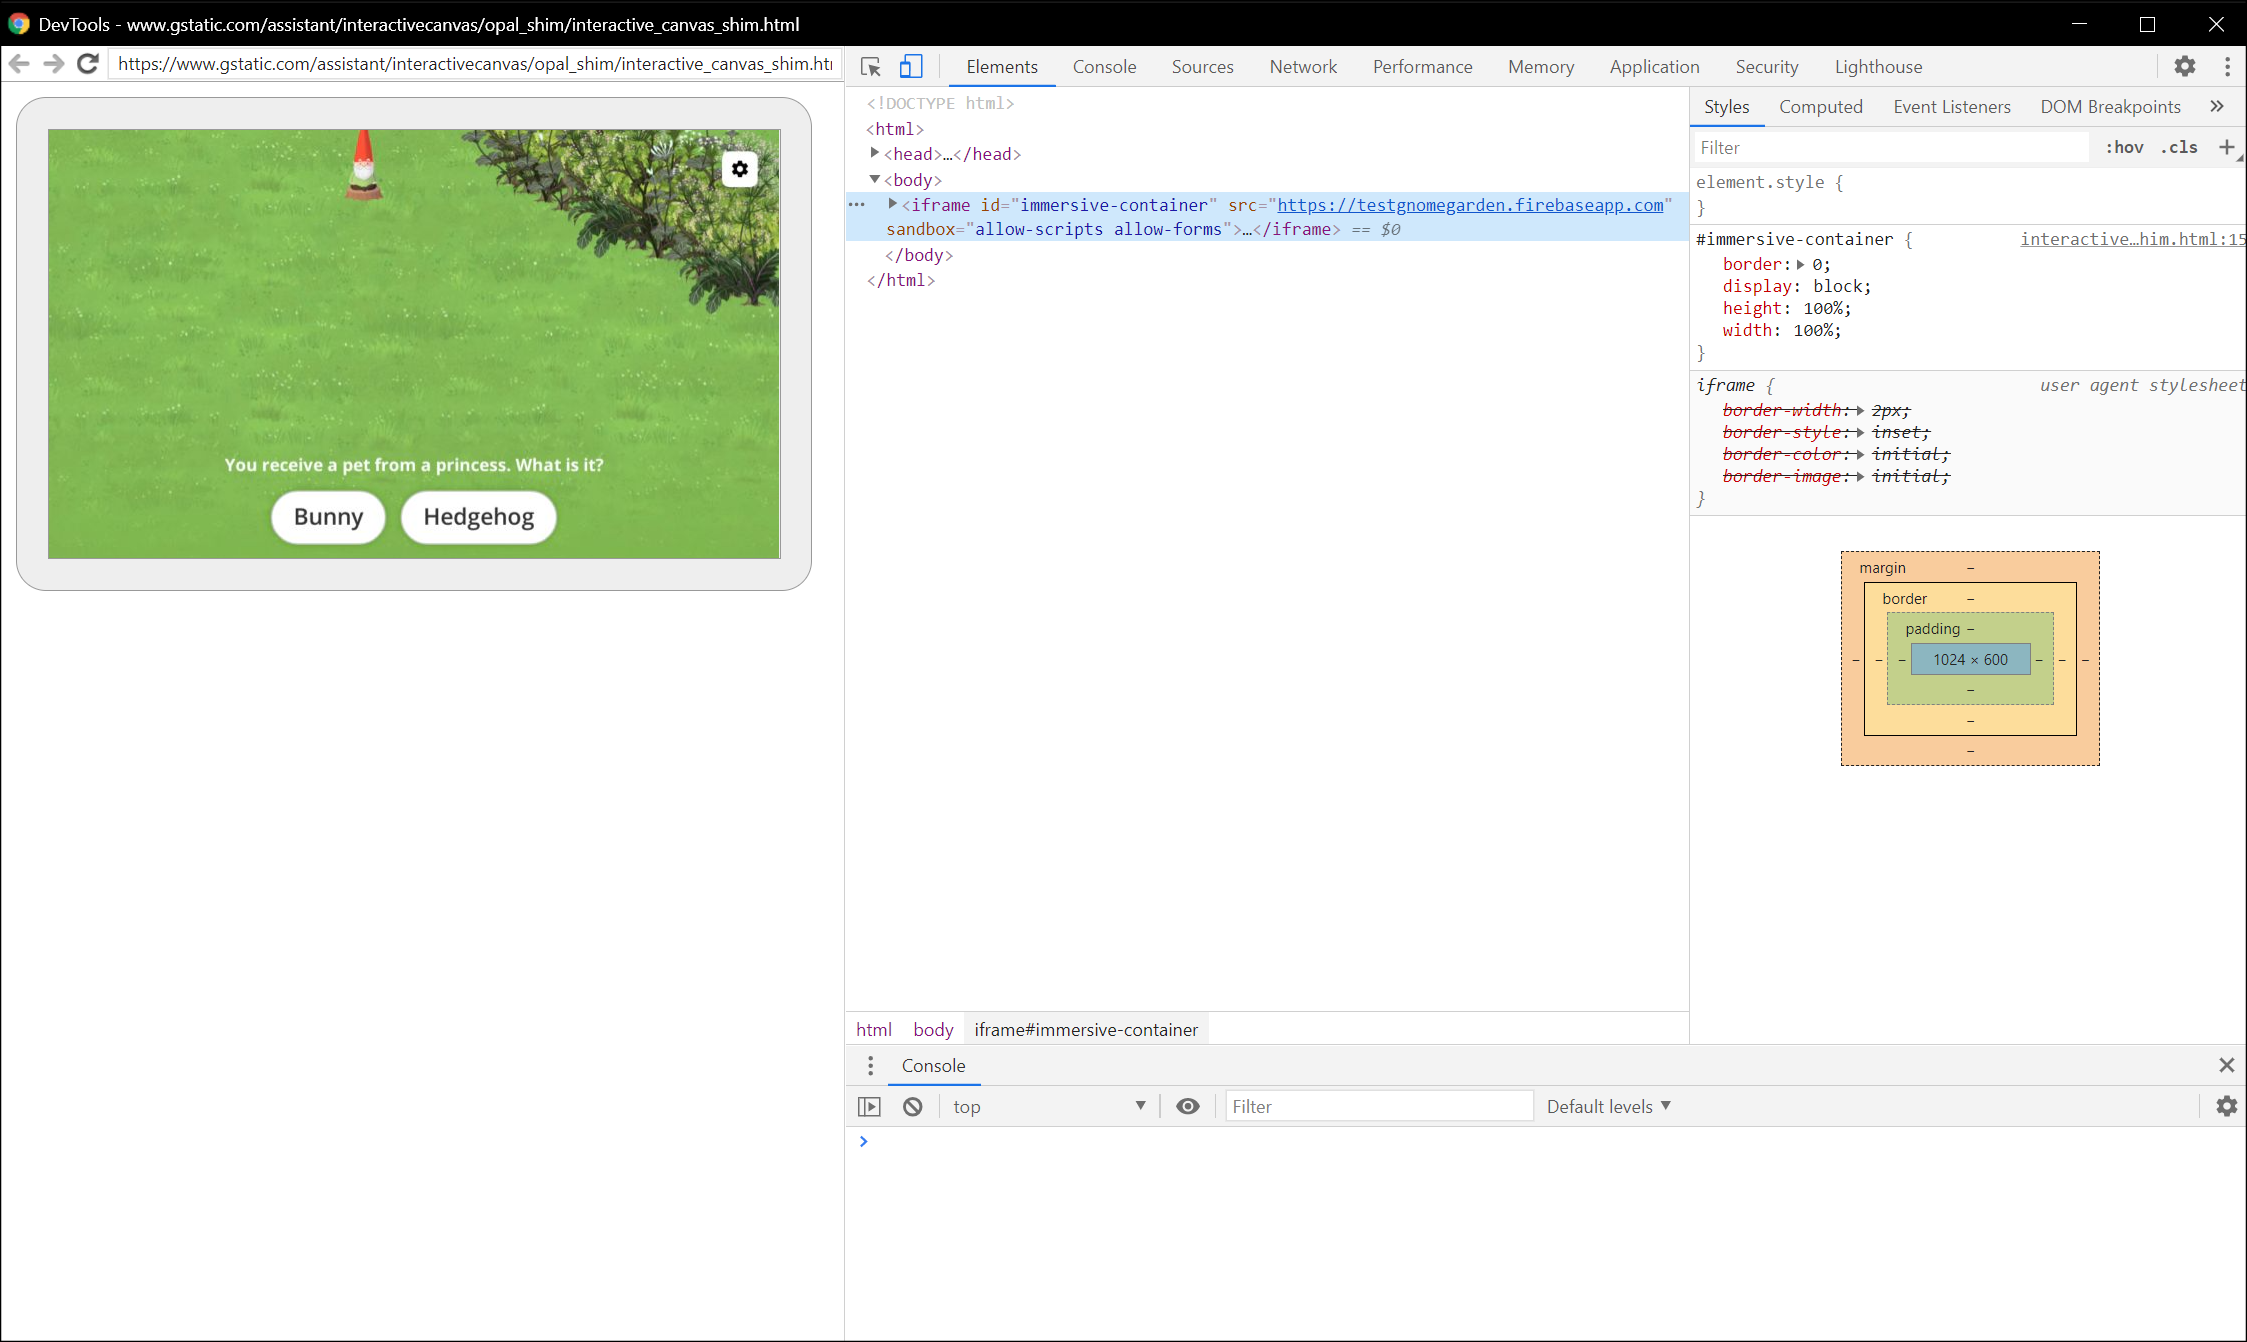
لاحظ أنه يتم تحميل تطبيق الويب "لوحة الرسم" في iframe.
نصائح تصحيح الأخطاء
ضع النصائح الإضافية التالية في الاعتبار أثناء تصحيح الأخطاء:
أعِد تحميل الصفحة في "أدوات مطوري البرامج في Chrome" لإعادة تحميل حاوية تطبيق تنفيذ الطلبات المحلي
باستخدام أحدث رمز من عنوان URL للتطوير.
تأكّد من أنّه يتم تحميل تطبيق JavaScript بدون أخطاء. للقيام بذلك، تحقق من قسم وحدة
التحكم في صفحة "أدوات مطوري البرامج".
أضِف نقاط الإيقاف اليدوية إلى الرمز باستخدام debugger; ضمن رمز تطبيق الويب.
إذا لم يظهر جهازك في "chrome://inspect#devices" لفترة زمنية طويلة،
أعِد تحميل صفحة الفحص.
نظرًا لأن ذاكرة الشاشة الذكية محدودة، قد يتعطّل تطبيق الويب أو يتوقّف إذا تجاوز مساحة 200 ميغابايت. لتصحيح أي مشاكل في الذاكرة، اتّبِع البرنامج التعليمي لحل مشاكل الذاكرة.
بالنسبة إلى أي أخطاء في التنفيذ، راجِع الطلبات المُرسَلة من خوادم "المهام مع مساعد Google" إلى الردّ التلقائي على الويب من سجلّات الردّ التلقائي على الويب أو من سجلّات Stackdriver.
تاريخ التعديل الأخير: 2025-07-25 (حسب التوقيت العالمي المتفَّق عليه)
[null,null,["تاريخ التعديل الأخير: 2025-07-25 (حسب التوقيت العالمي المتفَّق عليه)"],[[["\u003cp\u003eDebug your Interactive Canvas web app using Chrome DevTools on Google Home or Nest smart displays running supported software and firmware versions.\u003c/p\u003e\n"],["\u003cp\u003eSet up your environment by enabling your Action for testing, connecting devices to the same network, ensuring network connectivity, and using the same Google account.\u003c/p\u003e\n"],["\u003cp\u003eConnect to the debugger by launching Chrome Inspector, locating your device and Canvas HTML URL, and clicking "inspect" to open DevTools.\u003c/p\u003e\n"],["\u003cp\u003eUtilize debugging tips such as refreshing the DevTools page, checking for JavaScript errors, adding breakpoints, and monitoring performance and memory usage.\u003c/p\u003e\n"],["\u003cp\u003eThird-party smart display devices are not supported for debugging Canvas web apps.\u003c/p\u003e\n"]]],[],null,["# Debug your Interactive Canvas web app with Chrome DevTools\n\nYou can debug your Interactive Canvas web app using [Chrome DevTools](https://developers.google.com/web/tools/chrome-devtools). The Chrome debugger\nis supported on Google Home or Google Nest smart displays with a software\nversion of 30 or later (this update starts rolling out in October 2020)\nand a Cast firmware version of 1.50 or later. You can\ncheck the versions under `System settings / About device` on your smart display.\n| **Note:** Debugging Canvas web apps on third-party smart display devices is not supported.\n\nSet up your environment\n-----------------------\n\nBefore you can debug, do the following to set up your environment correctly:\n\n- Enable your Action for testing in the Actions console [simulator](/assistant/conversational/build/projects#test_projects_in_the_simulator).\n- Connect your machine to the same local area network as the Google Home or Google Nest device you are testing.\n- Ensure that your network doesn't block packets between devices.\n- Log in with the same Google account on the Actions console and on the Google Home or Google Nest device.\n\nOnce your environment is ready, you can launch your Action on your test\nsmart display.\n| **Note:** You cannot debug your Canvas web app until you've launched your development Action on your test smart display.\n\nConnect Canvas web app to debugger\n----------------------------------\n\nTo connect your Canvas web app to the Chrome DevTools debugger, follow these\nsteps:\n\n1. In your local development machine, install and launch the [Google Chrome browser](https://www.google.com/chrome/).\n2. In the address field of your Chrome browser, enter `chrome://inspect#devices` to launch the Chrome inspector. You should see a list of devices on the page, and the Canvas HTML URL should be listed under the name of your test Google Home or Google Nest device. Note that it might take some time for Chrome to discover all the devices on your network.\n3. Click the `inspect` link under the HTML URL to launch Chrome DevTools.\n\nChrome DevTools loads in its own window. You can click the screencast\n()\nbutton to see the web GUI rendered on the device. The following screenshot shows\nhow your web app appears in Chrome DevTools:\n\nNote that your Canvas web app is loaded in an iframe.\n\nDebugging tips\n--------------\n\nKeep the following additional tips in mind during debugging:\n\n- Refresh the page in Chrome DevTools to reload your local fulfillment app container with the latest code from your development URL.\n- Check that your JavaScript app loads without errors. To do this, check the console section of the DevTools page.\n- Add manual breakpoints to your code by using `debugger;` within your web app code.\n- If you don't see your device in the `chrome://inspect#devices` for an extended period of time, refresh the inspect page.\n- To debug any performance issues, follow the [Get Started with Analyzing Runtime Performance tutorial](https://developers.google.com/web/tools/chrome-devtools/evaluate-performance).\n- Because the smart display memory is limited, your web app might crash or hang if it goes over 200MB. To debug any memory issues, follow the [Fix Memory Problems tutorial](https://developers.google.com/web/tools/chrome-devtools/memory-problems).\n- For any fulfillment errors, look at requests sent by Actions on Google servers to the webhook from your webhook logs or from Stackdriver logs."]]