Chrome DevTools를 사용하여 Interactive Canvas 웹 앱을 디버그할 수 있습니다. Chrome 디버거는 소프트웨어 버전 30 이상 (이 업데이트는 2020년 10월에 출시되기 시작) 및 Cast 펌웨어 버전이 1.50 이상인 Google Home 또는 Google Nest 스마트 디스플레이에서 지원됩니다. 스마트 디스플레이에서 System settings / About device 아래의 버전을 확인할 수 있습니다.
Chrome 브라우저의 주소 입력란에 chrome://inspect#devices를 입력하여 Chrome 검사기를 실행합니다. 페이지에 기기 목록이 표시되고 테스트 Google Home 또는 Google Nest 기기 이름 아래에 캔버스 HTML URL이 나열됩니다. Chrome이 네트워크에 있는 모든 기기를 검색하는 데 다소 시간이 걸릴 수 있습니다.
HTML URL 아래의 inspect 링크를 클릭하여 Chrome DevTools를 실행합니다.
Chrome DevTools가 자체 창에 로드됩니다. 스크린캐스트() 버튼을 클릭하면 기기에서 렌더링된 웹 GUI를 확인할 수 있습니다. 다음 스크린샷은 Chrome DevTools에서 웹 앱이 표시되는 방식을 보여줍니다.
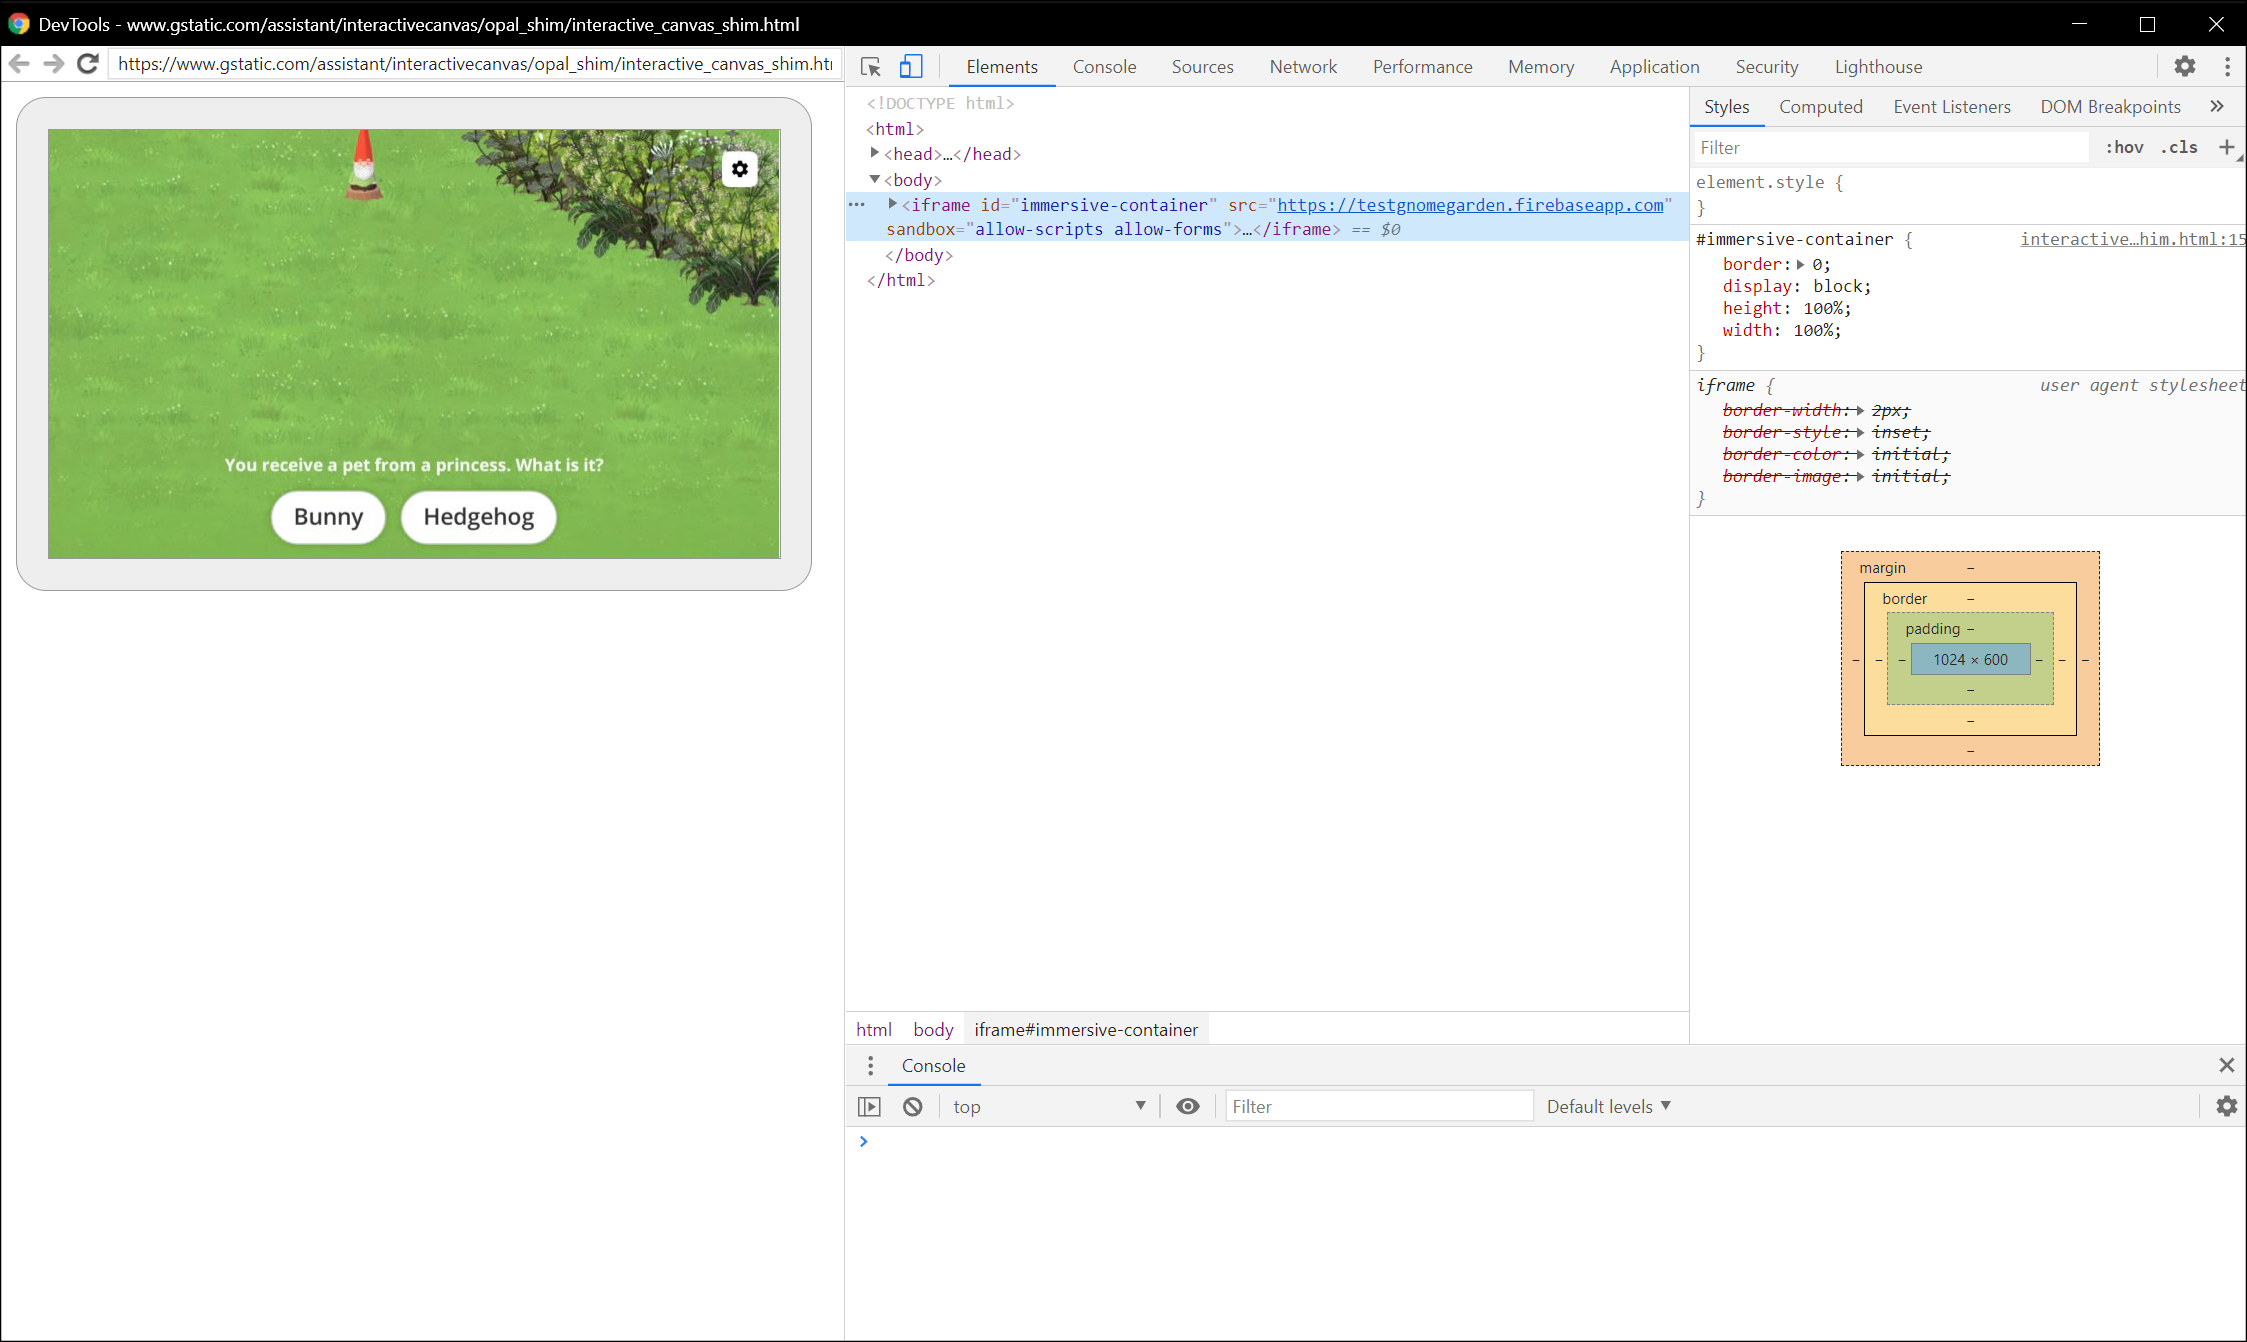
캔버스 웹 앱은 iframe에서 로드됩니다.
디버깅 도움말
디버깅하는 동안 다음 추가 도움말에 유의하세요.
Chrome DevTools에서 페이지를 새로고침하여 개발 URL의 최신 코드로 로컬 처리 앱 컨테이너를 새로고침합니다.
JavaScript 앱이 오류 없이 로드되는지 확인합니다. 이렇게 하려면 DevTools 페이지의 콘솔 섹션을 확인하세요.
웹 앱 코드 내에서 debugger;를 사용하여 코드에 수동 중단점을 추가합니다.
기기가 장시간 chrome://inspect#devices에 표시되지 않으면 검사 페이지를 새로고침합니다.
[null,null,["최종 업데이트: 2025-07-25(UTC)"],[[["\u003cp\u003eDebug your Interactive Canvas web app using Chrome DevTools on Google Home or Nest smart displays running supported software and firmware versions.\u003c/p\u003e\n"],["\u003cp\u003eSet up your environment by enabling your Action for testing, connecting devices to the same network, ensuring network connectivity, and using the same Google account.\u003c/p\u003e\n"],["\u003cp\u003eConnect to the debugger by launching Chrome Inspector, locating your device and Canvas HTML URL, and clicking "inspect" to open DevTools.\u003c/p\u003e\n"],["\u003cp\u003eUtilize debugging tips such as refreshing the DevTools page, checking for JavaScript errors, adding breakpoints, and monitoring performance and memory usage.\u003c/p\u003e\n"],["\u003cp\u003eThird-party smart display devices are not supported for debugging Canvas web apps.\u003c/p\u003e\n"]]],[],null,["# Debug your Interactive Canvas web app with Chrome DevTools\n\nYou can debug your Interactive Canvas web app using [Chrome DevTools](https://developers.google.com/web/tools/chrome-devtools). The Chrome debugger\nis supported on Google Home or Google Nest smart displays with a software\nversion of 30 or later (this update starts rolling out in October 2020)\nand a Cast firmware version of 1.50 or later. You can\ncheck the versions under `System settings / About device` on your smart display.\n| **Note:** Debugging Canvas web apps on third-party smart display devices is not supported.\n\nSet up your environment\n-----------------------\n\nBefore you can debug, do the following to set up your environment correctly:\n\n- Enable your Action for testing in the Actions console [simulator](/assistant/conversational/build/projects#test_projects_in_the_simulator).\n- Connect your machine to the same local area network as the Google Home or Google Nest device you are testing.\n- Ensure that your network doesn't block packets between devices.\n- Log in with the same Google account on the Actions console and on the Google Home or Google Nest device.\n\nOnce your environment is ready, you can launch your Action on your test\nsmart display.\n| **Note:** You cannot debug your Canvas web app until you've launched your development Action on your test smart display.\n\nConnect Canvas web app to debugger\n----------------------------------\n\nTo connect your Canvas web app to the Chrome DevTools debugger, follow these\nsteps:\n\n1. In your local development machine, install and launch the [Google Chrome browser](https://www.google.com/chrome/).\n2. In the address field of your Chrome browser, enter `chrome://inspect#devices` to launch the Chrome inspector. You should see a list of devices on the page, and the Canvas HTML URL should be listed under the name of your test Google Home or Google Nest device. Note that it might take some time for Chrome to discover all the devices on your network.\n3. Click the `inspect` link under the HTML URL to launch Chrome DevTools.\n\nChrome DevTools loads in its own window. You can click the screencast\n()\nbutton to see the web GUI rendered on the device. The following screenshot shows\nhow your web app appears in Chrome DevTools:\n\nNote that your Canvas web app is loaded in an iframe.\n\nDebugging tips\n--------------\n\nKeep the following additional tips in mind during debugging:\n\n- Refresh the page in Chrome DevTools to reload your local fulfillment app container with the latest code from your development URL.\n- Check that your JavaScript app loads without errors. To do this, check the console section of the DevTools page.\n- Add manual breakpoints to your code by using `debugger;` within your web app code.\n- If you don't see your device in the `chrome://inspect#devices` for an extended period of time, refresh the inspect page.\n- To debug any performance issues, follow the [Get Started with Analyzing Runtime Performance tutorial](https://developers.google.com/web/tools/chrome-devtools/evaluate-performance).\n- Because the smart display memory is limited, your web app might crash or hang if it goes over 200MB. To debug any memory issues, follow the [Fix Memory Problems tutorial](https://developers.google.com/web/tools/chrome-devtools/memory-problems).\n- For any fulfillment errors, look at requests sent by Actions on Google servers to the webhook from your webhook logs or from Stackdriver logs."]]