
На этой странице описано, как создавать различные выноски, пузырьки, булавки и другую графику, которую можно запрашивать по URL-адресу или добавлять в качестве маркеров поверх других диаграмм.
Оглавление
Введение
API диаграмм позволяет создавать разнообразные интересные выноски, булавки или пузырьки, в которых сочетаются текст и изображения. Эти элементы называются динамическими значками . Вы можете либо создать отдельное изображение динамического значка, либо расположить динамический значок поверх диаграммы в качестве типа маркера с помощью параметра chem . На этой странице будет описано, как создавать динамические значки в виде отдельных изображений или маркеров на другой диаграмме. На справочной странице « Динамические значки инфографики» описаны все доступные типы динамических маркеров.
Синтаксис создания динамического значка зависит от того, хотите ли вы использовать отдельный значок или динамический маркер на другой диаграмме.
Отдельно стоящие иконки
Вы можете запросить изображение динамического значка так же, как и любую другую диаграмму. Отдельно стоящий динамический значок поддерживает другой набор параметров, чем другие диаграммы:
| Параметр | Обязательный или необязательный | Описание |
|---|---|---|
chst=< icon_string_constant > | Необходимый | Описывает, какой тип значка необходимо создать.
|
chld=< icon_data > | Необходимый | Конкретные данные, используемые для описания размера значка, поворота, текста и других необходимых данных.
|
cht | НЕ ИСПОЛЬЗУЕТСЯ | Автономные динамические диаграммы со значками не используют параметр cht . |
chs | НЕ ИСПОЛЬЗУЕТСЯ | Автономные динамические диаграммы со значками не используют параметр chs . |
chd | НЕ ИСПОЛЬЗУЕТСЯ | Используйте параметр chld для передачи данных в отдельный динамический значок. |
Пример

https://chart.googleapis.com/chart?chst=d_bubble_icon_text_small&chld=ski|bb|Wheeee!|FFFFFF|000000
Динамические маркеры
Вы можете встроить динамический значок в качестве типа маркера в несколько различных типов диаграмм, используя параметр chem . См. документацию chem , чтобы узнать, как это сделать.
Пример
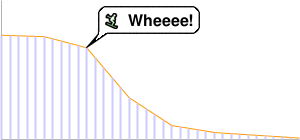
https://chart.googleapis.com/chart?
 chs=300x140
 cht=lc&chco=FF9900,224499
 chd=t:75,74,66,30,10,5,3,1
 chls=1|1
 chem=y;s=bubble_icon_text_small;d=ski,bb,Wheeee!,FFFFFF;dp=2;ds=0
 chm=v,ccccFF,0,::.2,2
Общие функции значков
С большинством значков могут быть связаны текстовые строки или тени.
Текстовые строки
Весь отображаемый текст, передаваемый в Chart API, должен быть закодирован в UTF-8, а затем в кодировке URL. Это касается только символов, не безопасных для URL-адресов (символами, безопасными для URL-адресов, в основном являются английские буквы в верхнем и нижнем регистре, а также небольшой набор знаков препинания). Например, значение в кодировке UTF-8 и URL-адреса для буквы «è» — « %C3%A8 », а для китайского символа 駅 — « %E9%A7%85 ». Большинство браузеров позволяют использовать незакодированное значение в строке URL-адреса (например, 駅) и незаметно закодируют его. Однако возможно, что кто-то, просматривающий URL-адрес вашей диаграммы, использует браузер, который этого не делает, поэтому обычно лучше кодировать UTF-8 и URL-кодирование всех символов, отличных от ASCII, в текстовых строках. Обратите внимание, что это относится только к тексту, показанному в пузырьках или булавках, а не к символам &, | или другим символам, которые являются частью синтаксиса URL-адреса.
При использовании параметра chem для указания динамических маркеров значков необходимо также экранировать определенные символы в тексте, как описано в документации chem .
Тени
Вы можете добавить тени ко многим значкам или даже нарисовать тени для некоторых значков без самого значка!
Затененные значки 
Многие из этих значков можно рисовать с тенями или без них. Если затенение является опцией, имя значка будет иметь версию, оканчивающуюся на _withshadow , и другую версию без этого окончания. Вы можете указать значок с любым окончанием, в зависимости от того, хотите ли вы тень или нет.
Вот пример среднего текстового пузыря и булавки с тенями и без них:
 chst=d_bubble_icon_text_big |  chst=d_bubble_icon_text_big_withshadow |
 chst=d_map_pin_icon |  chst=d_map_pin_icon_withshadow |
Отдельно стоящие тени
Некоторые типы значков позволяют рисовать их тень самостоятельно. Это может потребоваться, если вы используете на графике несколько перекрывающихся затененных значков, и они расположены настолько близко, что тень от одного падает на другой значок. Например, вот два затененных пузыря: первым нарисован Роберт, затем Алиса:
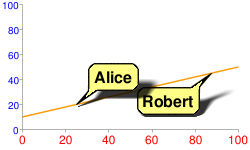
Обратите внимание, как тень Алисы частично закрывает Роберта. Чтобы это исправить, вы можете сначала нарисовать тень Алисы, затем пузырь Роберта, а затем Алису без тени. Возможно, это не совсем реалистично с точки зрения освещения и теней, но позволяет избежать затемнения одного пузыря тенью другого:
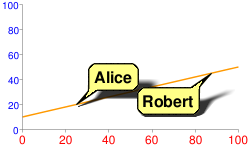
chem=
 y;s=bubble_text_small_shadow;d=bb,Alice,FF8,000;ds=0;dp=1;py=1          // Alice, no shadow
 y;s=bubble_text_small_withshadow;d=bbtr,Robert,FF8,000;ds=0;dp=3.5;py=1 // Robert with shadow
 y;s=bubble_text_small;d=bb,Alice,FF8,000;ds=0;dp=1;py=1                 // Alice shadow
Для всех маркеров задан один и тот же z-порядок, равный 1 ( py=1 ), поэтому они рисуются в указанном порядке поверх элементов диаграммы (линии диаграммы). Сначала рисуется тень Алисы, затем поверх нее пузырь Роберта и, наконец, пузырь Алисы сверху.
См. документацию по вашему конкретному типу значков, чтобы узнать, можете ли вы нарисовать только их тень.
Контекстные значки

Вы можете указать значок, цвет, размер или расположение которого будет меняться в зависимости от точки, которой он назначен. Эти типы значков доступны только в виде динамических маркеров значков (параметр chem ), а не в виде отдельных значков.
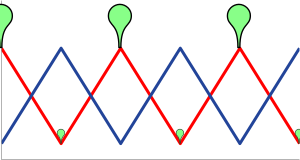
Эти значки могут отображаться в серии, отличной от серии, в которой указан их цвет, размер или информация о расположении. Это означает, что значение ds параметра chem указывает серию, в которой будет отображаться значок, но значения для определения размера или цвета значка указаны в параметрах, приведенных ниже. Одним из хороших вариантов использования этого является использование скрытых серий данных для данных значков, но отображение значков на видимой линии или полосе. Вот некоторые примеры:
| Значок, отображаемый в исходной серии | Значок отображается в серии, не являющейся исходным кодом. | Значок с использованием скрытой серии |
|---|---|---|
 | 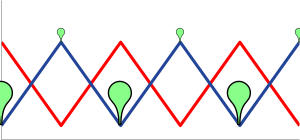 | 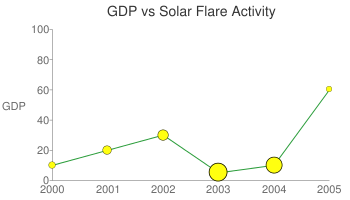 |
chem=
| chem=
| chd=t1:
|
Типы маркеров контекста
| Тип маркера | chem значение | Пример |
|---|---|---|
| Цветовая вариация | s=cm_color | 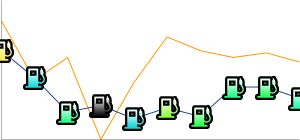 |
| Изменение размера | s=cm_size | 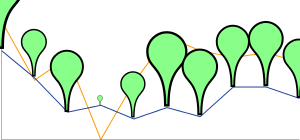 |
| Изменение цвета и размера | s=cm_color_size | 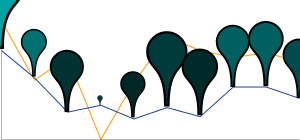 |
| Вариант укладки | s=cm_repeat | 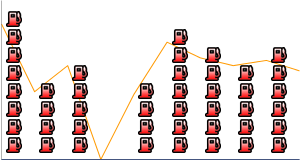 |
| Укладка и изменение цвета | s=cm_repeat_color | 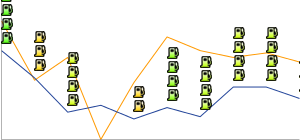 |
Строки выравнивания для контекстных значков
Контекстные значки поддерживают дополнительную строку выравнивания, позволяющую указать выравнивание и смещение значка относительно точки данных. Эта строка имеет следующий синтаксис:
<alignment>[+/-<h_anchor_offset>+/-<v_anchor_offset>]
- выравнивание
- Две буквы, описывающие выравнивание значка по точке. Примеры:
tl(вверху слева) иrb(внизу справа). Полный список и описание см. в описании параметра Alignment_string параметраchem. - h_anchor_offset
- [ Необязательно ] Горизонтальное смещение опорной точки в пикселях. Значениям , включая ноль, должен предшествовать + или -. Важно: URL-адрес должен быть закодирован как %2B.
- v_anchor_offset
- [ Необязательно ] Вертикальное смещение опорной точки в пикселях. Значениям , включая ноль, должен предшествовать + или -. Важно: URL-адрес должен быть закодирован как %2B.
Обратите внимание, что вы также можете использовать компонент of параметра chem для указания горизонтального и вертикального смещения. Если вы укажете значения of и h_anchor_offset v_anchor_offset , все смещения будут применены к вашему значку.
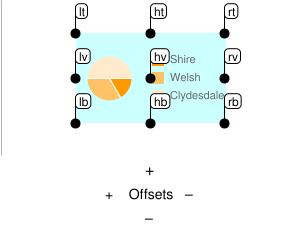
Примеры:
 hb-0-0Горизонтальный центр внизу Никаких смещений |  lb-0-0Внизу слева Никаких смещений |  rb-0-0Внизу справа Никаких смещений |  ht-0-0Горизонтальный верх Никаких смещений |
 hb-20-0Горизонтальный центр внизу -20 по горизонтали 0 вертикальный |  hb%2b20-0Горизонтальный центр внизу +20 по горизонтали 0 вертикальный |  hb-0%2b10Горизонтальный центр внизу 0 горизонтальный +10 по вертикали |  hb-0-20Горизонтальный центр внизу 0 горизонтальный -20 вертикальный |
Цветовое изменение ( cm_color )
Цвет маркера контекстной диаграммы можно изменять в зависимости от точки, которую он представляет. Вы должны указать цветовой диапазон, и значение данных будет масштабировано до соответствующего цвета в этом диапазоне.
Синтаксис
chem=y;s=cm_color;ds=<series_rendering_index>; ...other_values... ;
  d=<icon_shape>,<color_data_series>,<low_color>,<middle_color>,<high_color>,<icon_size>,<outline_color>,<alignment>
- < форма_значка >
- Значок, который нужно использовать. Укажите строку идентификатора, идентифицирующую одно из изображений, перечисленных в конце страницы .
- < серия_данных_цвета >
- Индекс ряда данных, начинающийся с нуля, используемый для изменения цвета значков.
- < низкий_цвет >
- Младшее значение цвета в диапазоне в виде трех- или шестизначного шестнадцатеричного цвета HTML (без знака #). Это связано с наименьшим возможным значением в доступном диапазоне данных.
- < средний_цвет >
- Среднее значение цвета в диапазоне в виде трех- или шестизначного шестнадцатеричного цвета HTML (без знака #). Это связано со средним значением в доступном диапазоне данных.
- < высокий_цвет >
- Максимальное значение цвета в диапазоне в виде трех- или шестизначного шестнадцатеричного цвета HTML (без знака #). Это связано с максимально возможным значением в доступном диапазоне данных.
- < размер_значка >
- Размер значка в пикселях. Поддерживаются следующие значения: 12, 16, 24.
- < цвет_контура >
- Цвет контура значка в виде трех- или шестизначного шестнадцатеричного цвета HTML (без знака #).
- < выравнивание >
- Необязательная строка , описывающая выравнивание и смещение значка.
Пример
| 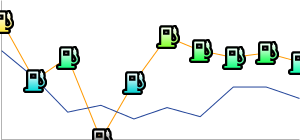 chem=y;s=cm_color; |
Изменение размера ( cm_size )
Вы можете изменить размер маркера контекстной диаграммы в соответствии с выбранным вами рядом данных.
Синтаксис
chem=y;s=cm_size;ds=<series_rendering_index>; ...other_values... ;
  d=<icon_type>,<size_data_series>,<zero_value_size>,<size_multiplier>,<min_size>,<outline_color>,<fill_color>,<alignment>
- < тип_значка >
- Форма иконы. Выберите одно из следующих значений:
maps_pin,diskилиsquare. - < size_data_series >
- Индекс ряда данных, начинающийся с нуля, используемый для изменения размера значков.
- < размер_нулевого_значения >
- Базовый размер значка при минимальном значении данных для серии.
- < размерный_множитель >
- Коэффициент масштабирования размера. Это значение умножается на разницу между значением данных каждого значка и минимальным значением серии, чтобы вычислить окончательный размер значка. Таким образом, этот множитель не повлияет на значок со значением данных 0.
- < минимальный_размер >
- Минимальный размер любого значка в пикселях.
- < цвет_контура >
- Цвет контура значка в виде трех- или шестизначного шестнадцатеричного цвета HTML (без знака #).
- < цвет_заливки >
- Цвет заливки значка в виде трех- или шестизначного шестнадцатеричного цвета HTML (без знака #).
- < выравнивание >
- Необязательная строка , описывающая выравнивание и смещение значка.
Примеры
| Базовый пример. Значок с нулевым значением отображается с размером нулевого значения, составляющим 30 пикселей. Размеры увеличиваются вместе с данными. | 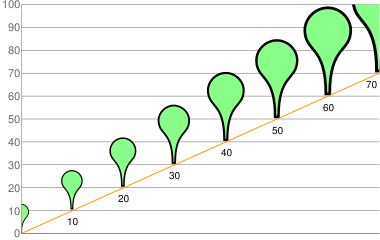 chd=t:0,10,20,30,40,50,60,70 |
В этом примере значки берут данные о размере из желтой линии, но отображаются на синей линии.
| 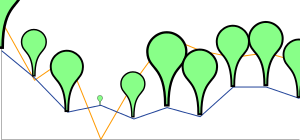 chem=chem=y;s=cm_size;ds=1;dp=all;d=maps_pin,0,10,90,10,8F8,000,hb |
Изменение цвета и размера ( cm_color_size )
Вы можете изменить цвет и размер маркера контекстной диаграммы в соответствии с выбранным вами рядом данных.
Синтаксис
chem=y;s=cm_color_size;ds=<series_rendering_index>; ...other_values... ;
  d=<icon_type>,<color_data_series>,<low_color>,<middle_color>,<high_color>,<size_data_series>,<zero_value_size>,<size_multiplier>,<min_size>,<outline_color>,<alignment>
- < тип_значка >
- Форма иконы. Выберите одно из следующих значений:
maps_pin,diskилиsquare. - < серия_данных_цвета >
- Индекс ряда данных, начинающийся с нуля, используемый для изменения цвета значков.
- < низкий_цвет >
- Младшее значение цвета в диапазоне в виде трех- или шестизначного шестнадцатеричного цвета HTML (без знака #). Это связано с наименьшим возможным значением в доступном диапазоне данных.
- < средний_цвет >
- Среднее значение цвета в диапазоне в виде трех- или шестизначного шестнадцатеричного цвета HTML (без знака #). Это связано со средним значением в доступном диапазоне данных.
- < высокий_цвет >
- Максимальное значение цвета в диапазоне в виде трех- или шестизначного шестнадцатеричного цвета HTML (без знака #). Это связано с максимально возможным значением в доступном диапазоне данных.
- < size_data_series >
- Индекс ряда данных, начинающийся с нуля, используемый для изменения размера значков.
- < размер_нулевого_значения >
- Базовый размер значка при минимальном значении данных для серии.
- < размерный_множитель >
- Коэффициент масштабирования размера. Это значение умножается на разницу между значением данных каждого значка и минимальным значением серии, чтобы вычислить окончательный размер значка. Таким образом, этот множитель не повлияет на значок со значением данных 0.
- < минимальный_размер >
- Минимальный размер любого значка в пикселях.
- < цвет_контура >
- Цвет контура значка в виде трех- или шестизначного шестнадцатеричного цвета HTML (без знака #).
- < выравнивание >
- Необязательная строка , описывающая выравнивание и смещение значка.
Примеры
В этом примере используются две строки. Пины используют данные цвета из серии, в которой они визуализируются, но используют данные о размере из другой серии.
| 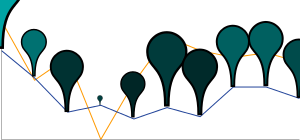 chd=s:0akAZtnkmi,nbMPJOKXXS |
Вариант укладки ( cm_repeat )
Вы можете изменять высоту стопки значков в зависимости от значения данных в определенной точке.
Синтаксис
chem=y;s=cm_repeat;ds=<series_rendering_index>; ...other_values... ;
  d=<icon_shape>,<repeat_series_index>,<scaling_factor>,<stacking_direction>,<icon_size>,<fill_color>,<outline_color>,<spacing>,<alignment>
- < форма_значка >
- Значок, который нужно использовать. Укажите строку идентификатора, идентифицирующую одно из изображений, перечисленных в конце страницы .
- < индекс_повторяющейся_серии >
- Отсчитываемый от нуля индекс ряда данных, используемый для расчета количества значков, которые следует разместить в этой точке.
- < коэффициент_масштабирования >
- Значение ряда исходных данных масштабируется до значения от 0 до 1 и умножается на это значение, чтобы определить, сколько маркеров разместить в этой точке. Частичные значения усекаются.
- < направление_укладки >
- Направление укладки: либо «h» (строчные буквы) для горизонтального размещения, либо «V» (прописные буквы) для вертикального.
- < размер_значка >
- Размер каждого маркера в пикселях. Поддерживаются следующие значения: 12, 16, 24.
- < цвет_заливки >
- Цвет заливки значка в виде трех- или шестизначного шестнадцатеричного цвета HTML (без знака #).
- < цвет_контура >
- Цвет контура значка в виде трех- или шестизначного шестнадцатеричного цвета HTML (без знака #).
- < интервал >
- Сколько места следует поместить между каждым маркером в стопке (в пикселях).
- < выравнивание >
- Необязательная строка , описывающая выравнивание и смещение значка.
Пример
В этом примере используется второй фиктивный ряд данных. Он не отображается на диаграмме, а используется для равномерного распределения всех стопок, начиная с нижней части диаграммы.
| 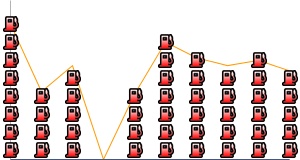 chd=s1:0akAZtnkmi,AAAAAAAAAA |
Укладка и изменение цвета ( cm_repeat_color )
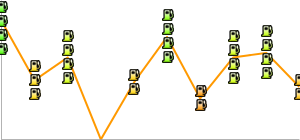
Вы можете изменять высоту и цвет стека значков в зависимости от значения данных в определенной точке.
Синтаксис
chem=y;s=cm_repeat_color;ds=<series_rendering_index>; ...other_values... ;
  d=<icon_shape>,<repeat_series_index>,<scaling_factor>,<stacking_direction>,<icon_size>,<color_data_series>,<low_color>,<middle_color>,<high_color>,<outline_color>,<spacing>,<alignment>
- < форма_значка >
- Значок, который нужно использовать. Укажите строку идентификатора, идентифицирующую одно из изображений, перечисленных в конце страницы .
- < индекс_повторяющейся_серии >
- Отсчитываемый от нуля индекс ряда данных, используемый для расчета количества значков, которые следует разместить в этой точке.
- < коэффициент_масштабирования >
- Значение ряда исходных данных масштабируется до значения от 0 до 1 и умножается на это значение, чтобы определить, сколько маркеров разместить в этой точке. Частичные значения усекаются.
- < направление_укладки >
- Направление укладки: либо «h» (строчные буквы) для горизонтального размещения, либо «V» (прописные буквы) для вертикального.
- < размер_значка >
- Размер каждого маркера в пикселях. Поддерживаются следующие значения: 12, 16, 24.
- < серия_данных_цвета >
- Индекс ряда данных, начинающийся с нуля, используемый для изменения цвета значков.
- < низкий_цвет >
- Младшее значение цвета в диапазоне в виде трех- или шестизначного шестнадцатеричного цвета HTML (без знака #). Это связано с наименьшим возможным значением в доступном диапазоне данных.
- < средний_цвет >
- Среднее значение цвета в диапазоне в виде трех- или шестизначного шестнадцатеричного цвета HTML (без знака #). Это связано со средним значением в доступном диапазоне данных.
- < высокий_цвет >
- Максимальное значение цвета в диапазоне в виде трех- или шестизначного шестнадцатеричного цвета HTML (без знака #). Это связано с максимально возможным значением в доступном диапазоне данных.
- < цвет_контура >
- Цвет контура значка в виде трех- или шестизначного шестнадцатеричного цвета HTML (без знака #).
- < интервал >
- Сколько места следует поместить между каждым маркером в стопке (в пикселях).
- < выравнивание >
- Необязательная строка , описывающая выравнивание и смещение значка.
Пример
|  chem= |

На этой странице описано, как создавать различные выноски, пузырьки, булавки и другую графику, которую можно запрашивать по URL-адресу или добавлять в качестве маркеров поверх других диаграмм.
Оглавление
Введение
API диаграмм позволяет создавать разнообразные интересные выноски, булавки или пузырьки, в которых сочетаются текст и изображения. Эти элементы называются динамическими значками . Вы можете либо создать отдельное изображение динамического значка, либо расположить динамический значок поверх диаграммы в качестве типа маркера с помощью параметра chem . На этой странице будет описано, как создавать динамические значки в виде отдельных изображений или маркеров на другой диаграмме. На справочной странице « Динамические значки инфографики» описаны все доступные типы динамических маркеров.
Синтаксис создания динамического значка зависит от того, хотите ли вы использовать отдельный значок или динамический маркер на другой диаграмме.
Отдельно стоящие иконки
Вы можете запросить изображение динамического значка так же, как и любую другую диаграмму. Отдельно стоящий динамический значок поддерживает другой набор параметров, чем другие диаграммы:
| Параметр | Обязательный или необязательный | Описание |
|---|---|---|
chst=< icon_string_constant > | Необходимый | Описывает, какой тип значка необходимо создать.
|
chld=< icon_data > | Необходимый | Конкретные данные, используемые для описания размера значка, поворота, текста и других необходимых данных.
|
cht | НЕ ИСПОЛЬЗУЕТСЯ | Автономные динамические диаграммы со значками не используют параметр cht . |
chs | НЕ ИСПОЛЬЗУЕТСЯ | Автономные динамические диаграммы со значками не используют параметр chs . |
chd | НЕ ИСПОЛЬЗУЕТСЯ | Используйте параметр chld для передачи данных в отдельный динамический значок. |
Пример

https://chart.googleapis.com/chart?chst=d_bubble_icon_text_small&chld=ski|bb|Wheeee!|FFFFFF|000000
Динамические маркеры
Вы можете встроить динамический значок в качестве типа маркера в несколько различных типов диаграмм, используя параметр chem . См. документацию chem , чтобы узнать, как это сделать.
Пример

https://chart.googleapis.com/chart?
 chs=300x140
 cht=lc&chco=FF9900,224499
 chd=t:75,74,66,30,10,5,3,1
 chls=1|1
 chem=y;s=bubble_icon_text_small;d=ski,bb,Wheeee!,FFFFFF;dp=2;ds=0
 chm=v,ccccFF,0,::.2,2
Общие функции значков
С большинством значков могут быть связаны текстовые строки или тени.
Текстовые строки
Весь отображаемый текст, передаваемый в Chart API, должен быть закодирован в UTF-8, а затем в кодировке URL. Это касается только символов, не безопасных для URL-адресов (символами, безопасными для URL-адресов, в основном являются английские буквы в верхнем и нижнем регистре, а также небольшой набор знаков препинания). Например, значение в кодировке UTF-8 и URL-адреса для буквы «è» — « %C3%A8 », а для китайского символа 駅 — « %E9%A7%85 ». Большинство браузеров позволяют использовать незакодированное значение в строке URL-адреса (например, 駅) и незаметно закодируют его. Однако возможно, что кто-то, просматривающий URL-адрес вашей диаграммы, использует браузер, который этого не делает, поэтому обычно лучше кодировать UTF-8 и URL-кодирование всех символов, отличных от ASCII, в текстовых строках. Обратите внимание, что это относится только к тексту, показанному в пузырьках или булавках, а не к символам &, | или другим символам, которые являются частью синтаксиса URL-адреса.
При использовании параметра chem для указания динамических маркеров значков необходимо также экранировать определенные символы в тексте, как описано в документации chem .
Тени
Вы можете добавить тени ко многим значкам или даже нарисовать тени для некоторых значков без самого значка!
Затененные значки 
Многие из этих значков можно рисовать с тенями или без них. Если затенение является опцией, имя значка будет иметь версию, оканчивающуюся на _withshadow , и другую версию без этого окончания. Вы можете указать значок с любым окончанием, в зависимости от того, хотите ли вы тень или нет.
Вот пример среднего текстового пузыря и булавки с тенями и без них:
 chst=d_bubble_icon_text_big |  chst=d_bubble_icon_text_big_withshadow |
 chst=d_map_pin_icon |  chst=d_map_pin_icon_withshadow |
Отдельно стоящие тени
Некоторые типы значков позволяют рисовать их тень самостоятельно. Это может потребоваться, если вы используете на графике несколько перекрывающихся затененных значков, и они расположены настолько близко, что тень от одного падает на другой значок. Например, вот два затененных пузыря: первым нарисован Роберт, затем Алиса:

Обратите внимание, как тень Алисы частично закрывает Роберта. Чтобы это исправить, вы можете сначала нарисовать тень Алисы, затем пузырь Роберта, а затем Алису без тени. Возможно, это не совсем реалистично с точки зрения освещения и теней, но позволяет избежать затемнения одного пузыря тенью другого:

chem=
 y;s=bubble_text_small_shadow;d=bb,Alice,FF8,000;ds=0;dp=1;py=1          // Alice, no shadow
 y;s=bubble_text_small_withshadow;d=bbtr,Robert,FF8,000;ds=0;dp=3.5;py=1 // Robert with shadow
 y;s=bubble_text_small;d=bb,Alice,FF8,000;ds=0;dp=1;py=1                 // Alice shadow
Для всех маркеров задан один и тот же z-порядок, равный 1 ( py=1 ), поэтому они рисуются в указанном порядке поверх элементов диаграммы (линии диаграммы). Сначала рисуется тень Алисы, затем поверх нее пузырь Роберта и, наконец, пузырь Алисы сверху.
См. документацию по вашему конкретному типу значков, чтобы узнать, можете ли вы нарисовать только их тень.
Контекстные значки

Вы можете указать значок, цвет, размер или расположение которого будет меняться в зависимости от точки, которой он назначен. Эти типы значков доступны только в виде динамических маркеров значков (параметр chem ), а не в виде отдельных значков.
Эти значки могут отображаться в серии, отличной от серии, в которой указан их цвет, размер или информация о расположении. Это означает, что значение ds параметра chem указывает серию, в которой будет отображаться значок, но значения для определения размера или цвета значка указаны в параметрах, приведенных ниже. Одним из хороших вариантов использования этого является использование скрытых серий данных для данных значков, но отображение значков на видимой линии или полосе. Вот некоторые примеры:
| Значок, отображаемый в исходной серии | Значок отображается в серии, не являющейся исходным кодом. | Значок с использованием скрытой серии |
|---|---|---|
 |  |  |
chem=
| chem=
| chd=t1:
|
Типы маркеров контекста
| Тип маркера | chem значение | Пример |
|---|---|---|
| Цветовая вариация | s=cm_color |  |
| Изменение размера | s=cm_size |  |
| Изменение цвета и размера | s=cm_color_size |  |
| Вариант укладки | s=cm_repeat |  |
| Укладка и изменение цвета | s=cm_repeat_color |  |
Строки выравнивания для контекстных значков
The contextual icons support an optional alignment string to specify an alignment and offset of the icon to the data point. This string has the following syntax:
<alignment>[+/-<h_anchor_offset>+/-<v_anchor_offset>]
- alignment
- Two letters describing the alignment of the icon to the point. Examples include
tl(top left), andrb(bottom right). See the alignment_string parameter description of thechemparameter for a complete listing and description. - h_anchor_offset
- [ Optional ] The horizontal offset of the anchor point, in pixels. Values including zero must be preceded by either + or -. Important: You must url-encode + as %2B.
- v_anchor_offset
- [ Optional ] The vertical offset of the anchor point, in pixels. Values including zero must be preceded by either + or -. Important: You must url-encode + as %2B.
Note that you can also use the of component of the chem parameter to specify horizontal and vertical offsets. If you specify both the of component and h_anchor_offset v_anchor_offset values, all offsets will be applied to your icon.

Examples:
 hb-0-0Horizontal center bottom No offsets |  lb-0-0Bottom left No offsets |  rb-0-0Bottom right No offsets |  ht-0-0Horizontal top No offsets |
 hb-20-0Horizontal center bottom -20 horizontal 0 vertical |  hb%2b20-0Horizontal center bottom +20 horizontal 0 vertical |  hb-0%2b10Horizontal center bottom 0 horizontal +10 vertical |  hb-0-20Horizontal center bottom 0 horizontal -20 vertical |
Color Variation ( cm_color )
You can vary the color of a contextual chart marker according to the point that it represents. You must specify a color range, and the data value will be scaled to a corresponding color within that range.
Syntax
chem=y;s=cm_color;ds=<series_rendering_index>; ...other_values... ;
  d=<icon_shape>,<color_data_series>,<low_color>,<middle_color>,<high_color>,<icon_size>,<outline_color>,<alignment>
- < icon_shape >
- The icon to use. Specify an ID string identifying one of the images listed at the end of the page .
- < color_data_series >
- The zero-based index of the data series used to vary the color of the icons.
- < low_color >
- The low color value in the range, as a three- or six-digit HTML hexadecimal color (no # mark). This is associated with the lowest possible value in the available data range.
- < middle_color >
- The middle color value in the range, as a three- or six-digit HTML hexadecimal color (no # mark). This is associated with the middle value in the available data range.
- < high_color >
- The high color value in the range, as a three- or six-digit HTML hexadecimal color (no # mark). This is associated with the highest possible value in the available data range.
- < icon_size >
- The size of the icon, in pixels. The following values are supported: 12, 16, 24.
- < outline_color >
- The outline color for the icon, as a three- or six-digit HTML hexadecimal color (no # mark).
- < alignment >
- An optional string describing the icon alignment and offset.
Example
|  chem=y;s=cm_color; |
Size Variation ( cm_size )
You can vary the size alone of a contextual chart marker, according to the data series of your choice.
Syntax
chem=y;s=cm_size;ds=<series_rendering_index>; ...other_values... ;
  d=<icon_type>,<size_data_series>,<zero_value_size>,<size_multiplier>,<min_size>,<outline_color>,<fill_color>,<alignment>
- < icon_type >
- The shape of the icon. Choose one of the following values:
maps_pin,disk, orsquare. - < size_data_series >
- The zero-based index of the data series used to vary the size of the icons.
- < zero_value_size >
- The base size of the icon, at the minimum data value for the series.
- < size_multiplier >
- A size scaling factor. This value is multiplied against the difference between each icon's data value and the minimum series value, to calculate the final icon size. Therefore, an icon at the 0 data value will not be affected by this multiplier.
- < min_size >
- The minimum size for any icon, in pixels.
- < outline_color >
- The outline color for the icon, as a three- or six-digit HTML hexadecimal color (no # mark).
- < fill_color >
- The fill color for the icon, as a three- or six-digit HTML hexadecimal color (no # mark).
- < alignment >
- An optional string describing the icon alignment and offset.
Examples
| A basic example. The icon with zero value is rendered at the zero value size, which is 30 pixels. Sizes increase along with the data. |  chd=t:0,10,20,30,40,50,60,70 |
In this example, the icons take their size data from the yellow line, but are rendered on the blue line.
|  chem=chem=y;s=cm_size;ds=1;dp=all;d=maps_pin,0,10,90,10,8F8,000,hb |
Color and Size Variation ( cm_color_size )
You can vary both color and size of a contextual chart marker, according to the data series of your choice.
Syntax
chem=y;s=cm_color_size;ds=<series_rendering_index>; ...other_values... ;
  d=<icon_type>,<color_data_series>,<low_color>,<middle_color>,<high_color>,<size_data_series>,<zero_value_size>,<size_multiplier>,<min_size>,<outline_color>,<alignment>
- < icon_type >
- The shape of the icon. Choose one of the following values:
maps_pin,disk, orsquare. - < color_data_series >
- The zero-based index of the data series used to vary the color of the icons.
- < low_color >
- The low color value in the range, as a three- or six-digit HTML hexadecimal color (no # mark). This is associated with the lowest possible value in the available data range.
- < middle_color >
- The middle color value in the range, as a three- or six-digit HTML hexadecimal color (no # mark). This is associated with the middle value in the available data range.
- < high_color >
- The high color value in the range, as a three- or six-digit HTML hexadecimal color (no # mark). This is associated with the highest possible value in the available data range.
- < size_data_series >
- The zero-based index of the data series used to vary the size of the icons.
- < zero_value_size >
- The base size of the icon, at the minimum data value for the series.
- < size_multiplier >
- A size scaling factor. This value is multiplied against the difference between each icon's data value and the minimum series value, to calculate the final icon size. Therefore, an icon at the 0 data value will not be affected by this multiplier.
- < min_size >
- The minimum size for any icon, in pixels.
- < outline_color >
- The outline color for the icon, as a three- or six-digit HTML hexadecimal color (no # mark).
- < alignment >
- An optional string describing the icon alignment and offset.
Examples
This example uses two lines. The pins use color data from the series on which they're rendered, but use size data from the other series.
|  chd=s:0akAZtnkmi,nbMPJOKXXS |
Stacking Variation ( cm_repeat )
You can vary the height of a stack of icons according to the data value at a specific point.
Syntax
chem=y;s=cm_repeat;ds=<series_rendering_index>; ...other_values... ;
  d=<icon_shape>,<repeat_series_index>,<scaling_factor>,<stacking_direction>,<icon_size>,<fill_color>,<outline_color>,<spacing>,<alignment>
- < icon_shape >
- The icon to use. Specify an ID string identifying one of the images listed at the end of the page .
- < repeat_series_index >
- The zero-based index of the data series used to calculate how many icons to place at this point.
- < scaling_factor >
- The source data series value is scaled to a value from 0 to 1 and multiplied by this value to determine how many markers to place on this point. Partial values are truncated.
- < stacking_direction >
- Stacking direction: either "h" (lowercase) for horizontal or "V" (uppercase) for vertical.
- < icon_size >
- The size of each marker, in pixels. The following values are supported: 12, 16, 24.
- < fill_color >
- The fill color for the icon, as a three- or six-digit HTML hexadecimal color (no # mark).
- < outline_color >
- The outline color for the icon, as a three- or six-digit HTML hexadecimal color (no # mark).
- < spacing >
- How much space to put between each marker in a stack, in pixels.
- < alignment >
- An optional string describing the icon alignment and offset.
Example
This example uses a second dummy data series. It is not rendered on the chart, but used as a way to space all the stacks evenly, starting at the bottom of the chart.
|  chd=s1:0akAZtnkmi,AAAAAAAAAA |
Stacking and Color Variation ( cm_repeat_color )
You can vary the both the height and color of an icon stack, according to the data value at a specific point.
Syntax
chem=y;s=cm_repeat_color;ds=<series_rendering_index>; ...other_values... ;
  d=<icon_shape>,<repeat_series_index>,<scaling_factor>,<stacking_direction>,<icon_size>,<color_data_series>,<low_color>,<middle_color>,<high_color>,<outline_color>,<spacing>,<alignment>
- < icon_shape >
- The icon to use. Specify an ID string identifying one of the images listed at the end of the page .
- < repeat_series_index >
- The zero-based index of the data series used to calculate how many icons to place at this point.
- < scaling_factor >
- The source data series value is scaled to a value from 0 to 1 and multiplied by this value to determine how many markers to place on this point. Partial values are truncated.
- < stacking_direction >
- Stacking direction: either "h" (lowercase) for horizontal or "V" (uppercase) for vertical.
- < icon_size >
- The size of each marker, in pixels. The following values are supported: 12, 16, 24.
- < color_data_series >
- The zero-based index of the data series used to vary the color of the icons.
- < low_color >
- The low color value in the range, as a three- or six-digit HTML hexadecimal color (no # mark). This is associated with the lowest possible value in the available data range.
- < middle_color >
- The middle color value in the range, as a three- or six-digit HTML hexadecimal color (no # mark). This is associated with the middle value in the available data range.
- < high_color >
- The high color value in the range, as a three- or six-digit HTML hexadecimal color (no # mark). This is associated with the highest possible value in the available data range.
- < outline_color >
- The outline color for the icon, as a three- or six-digit HTML hexadecimal color (no # mark).
- < spacing >
- How much space to put between each marker in a stack, in pixels.
- < alignment >
- An optional string describing the icon alignment and offset.
Example
|  chem= |

This page describes how to create a variety of callouts, bubbles, pins, and other graphics that can be requested by URL, or added as markers on top of other charts.
Table of Contents
Введение
The Chart API enables you to create a variety of interesting callouts, pins, or bubbles that mix text and images. These items are called dynamic icons . You can either create a freestanding dynamic icon image, or you can position a dynamic icon on top of your chart as a marker type using the chem parameter. This page will describe how to create dynamic icons as either freestanding images or as markers on another chart. The Infographics Dynamic Icons reference page describes all the types of dynamic marker types available.
The syntax for creating a dynamic icon depends on whether you want a freestanding icon, or as a dynamic marker in another chart.
Freestanding Icons
You can request a dynamic icon image the same way you request any of the other charts. A freestanding dynamic icon supports a different set of parameters than other charts do:
| Parameter | Required or Optional | Описание |
|---|---|---|
chst=< icon_string_constant > | Необходимый | Describes which kind of icon to create.
|
chld=< icon_data > | Необходимый | The specific data used to describe the icon's size, rotation, text, and other required data.
|
cht | NOT USED | Freestanding dynamic icon charts don't use the cht parameter. |
chs | NOT USED | Freestanding dynamic icon charts don't use the chs parameter. |
chd | NOT USED | Use the chld parameter to pass data to a freestanding dynamic icon. |
Example

https://chart.googleapis.com/chart?chst=d_bubble_icon_text_small&chld=ski|bb|Wheeee!|FFFFFF|000000
Dynamic Markers
You can embed a dynamic icon as a marker type on several different types of charts using the chem parameter. See the chem documentation to learn how.
Example

https://chart.googleapis.com/chart?
 chs=300x140
 cht=lc&chco=FF9900,224499
 chd=t:75,74,66,30,10,5,3,1
 chls=1|1
 chem=y;s=bubble_icon_text_small;d=ski,bb,Wheeee!,FFFFFF;dp=2;ds=0
 chm=v,ccccFF,0,::.2,2
Common Icon Features
Most icons can have text strings or shadows associated with them.
Text Strings
All display text passed to the Chart API must be UTF-8 encoded and then URL-encoded. This affects only non-URL-safe characters (URL-safe characters are mostly the English letters az both upper and lower case, plus plus a small set of punctuation). For example, the UTF-8 and URL-encoded value for the letter "è" is " %C3%A8 ", and for the Chinese character 駅 is " %E9%A7%85 ". Most browsers will let you use an unencoded value in the URL string (for example, 駅) and will encode it for you behind the scenes. However, it is possible that someone viewing your chart URL is using a browser that doesn't do this, so it is usually best to UTF-8 and URL-encode all non-ASCII characters in text strings. Note that this is only for the text shown in bubbles or pins, not for the &, |, or other characters that are part of the URL syntax.
When using the chem parameter to specify dynamic icon markers, you must also escape certain characters in your text, as described in the chem documentation.
Shadows
You can add shadows to many icons, or even draw shadows for some icons without the icon itself!
Shadowed Icons 
Many of these icons can be drawn with or without shadows. If shadowing is an option, the icon name will have a version that ends in _withshadow and another version without that ending. You can specify an icon with either ending, depending on whether you want the shadow or not.
Here's an example of a medium text bubble and a pin with and without shadows:
 chst=d_bubble_icon_text_big |  chst=d_bubble_icon_text_big_withshadow |
 chst=d_map_pin_icon |  chst=d_map_pin_icon_withshadow |
Freestanding Shadows
Some icon types allow you to draw their shadow by itself. You might want to do this if you are using several overlapping shadowed icons on a graphic, and they are so close that the shadow from one falls across another icon. For example, here is two shadowed bubbles, Robert drawn first, then Alice:

Note how Alice's shadow partially covers Robert. To fix this, you can draw the Alice shadow first, then the Robert bubble, then Alice without a shadow. Perhaps not totally realistic in terms of lighting and shadows, but it avoids obscuring one bubble with the shadow of another:

chem=
 y;s=bubble_text_small_shadow;d=bb,Alice,FF8,000;ds=0;dp=1;py=1          // Alice, no shadow
 y;s=bubble_text_small_withshadow;d=bbtr,Robert,FF8,000;ds=0;dp=3.5;py=1 // Robert with shadow
 y;s=bubble_text_small;d=bb,Alice,FF8,000;ds=0;dp=1;py=1                 // Alice shadow
All markers specify the same z-order of 1 ( py=1 ), so they are drawn in the order listed, on top of the chart elements (the chart line). First the Alice shadow is drawn, then the Robert bubble on top of that, and finally the Alice bubble on top.
See the documentation of your specific icon type to learn whether you can draw its shadow alone.
Contextual Icons

You can specify an icon that varies its color, size, or stacking according to the point they are assigned to. These icon types are available as dynamic icon markers only ( chem parameter), not as freestanding icons.
These icons can be rendered on a series other than the series that specifies their color, size, or stacking information. This means that the chem parameter's ds value specifies the series on which to render the icon, but the values for determining the size or color of the icon are specified in the parameters given below. One good use of this is to use a hidden data series for icon data, but render the icons on a visible line or bar. Here are some examples:
| Icon rendered on source series | Icon rendered on non-source series | Icon using hidden series |
|---|---|---|
 |  |  |
chem=
| chem=
| chd=t1:
|
Context Marker Types
| Marker Type | chem s Value | Пример |
|---|---|---|
| Color variation | s=cm_color |  |
| Size variation | s=cm_size |  |
| Color and size variation | s=cm_color_size |  |
| Stacking variation | s=cm_repeat |  |
| Stacking and color variation | s=cm_repeat_color |  |
Alignment Strings for Contextual Icons
The contextual icons support an optional alignment string to specify an alignment and offset of the icon to the data point. This string has the following syntax:
<alignment>[+/-<h_anchor_offset>+/-<v_anchor_offset>]
- alignment
- Two letters describing the alignment of the icon to the point. Examples include
tl(top left), andrb(bottom right). See the alignment_string parameter description of thechemparameter for a complete listing and description. - h_anchor_offset
- [ Optional ] The horizontal offset of the anchor point, in pixels. Values including zero must be preceded by either + or -. Important: You must url-encode + as %2B.
- v_anchor_offset
- [ Optional ] The vertical offset of the anchor point, in pixels. Values including zero must be preceded by either + or -. Important: You must url-encode + as %2B.
Note that you can also use the of component of the chem parameter to specify horizontal and vertical offsets. If you specify both the of component and h_anchor_offset v_anchor_offset values, all offsets will be applied to your icon.

Examples:
 hb-0-0Horizontal center bottom No offsets |  lb-0-0Bottom left No offsets |  rb-0-0Bottom right No offsets |  ht-0-0Horizontal top No offsets |
 hb-20-0Horizontal center bottom -20 horizontal 0 vertical |  hb%2b20-0Horizontal center bottom +20 horizontal 0 vertical |  hb-0%2b10Horizontal center bottom 0 horizontal +10 vertical |  hb-0-20Horizontal center bottom 0 horizontal -20 vertical |
Color Variation ( cm_color )
You can vary the color of a contextual chart marker according to the point that it represents. You must specify a color range, and the data value will be scaled to a corresponding color within that range.
Syntax
chem=y;s=cm_color;ds=<series_rendering_index>; ...other_values... ;
  d=<icon_shape>,<color_data_series>,<low_color>,<middle_color>,<high_color>,<icon_size>,<outline_color>,<alignment>
- < icon_shape >
- The icon to use. Specify an ID string identifying one of the images listed at the end of the page .
- < color_data_series >
- The zero-based index of the data series used to vary the color of the icons.
- < low_color >
- The low color value in the range, as a three- or six-digit HTML hexadecimal color (no # mark). This is associated with the lowest possible value in the available data range.
- < middle_color >
- The middle color value in the range, as a three- or six-digit HTML hexadecimal color (no # mark). This is associated with the middle value in the available data range.
- < high_color >
- The high color value in the range, as a three- or six-digit HTML hexadecimal color (no # mark). This is associated with the highest possible value in the available data range.
- < icon_size >
- The size of the icon, in pixels. The following values are supported: 12, 16, 24.
- < outline_color >
- The outline color for the icon, as a three- or six-digit HTML hexadecimal color (no # mark).
- < alignment >
- An optional string describing the icon alignment and offset.
Example
|  chem=y;s=cm_color; |
Size Variation ( cm_size )
You can vary the size alone of a contextual chart marker, according to the data series of your choice.
Syntax
chem=y;s=cm_size;ds=<series_rendering_index>; ...other_values... ;
  d=<icon_type>,<size_data_series>,<zero_value_size>,<size_multiplier>,<min_size>,<outline_color>,<fill_color>,<alignment>
- < icon_type >
- The shape of the icon. Choose one of the following values:
maps_pin,disk, orsquare. - < size_data_series >
- The zero-based index of the data series used to vary the size of the icons.
- < zero_value_size >
- The base size of the icon, at the minimum data value for the series.
- < size_multiplier >
- A size scaling factor. This value is multiplied against the difference between each icon's data value and the minimum series value, to calculate the final icon size. Therefore, an icon at the 0 data value will not be affected by this multiplier.
- < min_size >
- The minimum size for any icon, in pixels.
- < outline_color >
- The outline color for the icon, as a three- or six-digit HTML hexadecimal color (no # mark).
- < fill_color >
- The fill color for the icon, as a three- or six-digit HTML hexadecimal color (no # mark).
- < alignment >
- An optional string describing the icon alignment and offset.
Examples
| A basic example. The icon with zero value is rendered at the zero value size, which is 30 pixels. Sizes increase along with the data. |  chd=t:0,10,20,30,40,50,60,70 |
In this example, the icons take their size data from the yellow line, but are rendered on the blue line.
|  chem=chem=y;s=cm_size;ds=1;dp=all;d=maps_pin,0,10,90,10,8F8,000,hb |
Color and Size Variation ( cm_color_size )
You can vary both color and size of a contextual chart marker, according to the data series of your choice.
Syntax
chem=y;s=cm_color_size;ds=<series_rendering_index>; ...other_values... ;
  d=<icon_type>,<color_data_series>,<low_color>,<middle_color>,<high_color>,<size_data_series>,<zero_value_size>,<size_multiplier>,<min_size>,<outline_color>,<alignment>
- < icon_type >
- The shape of the icon. Choose one of the following values:
maps_pin,disk, orsquare. - < color_data_series >
- The zero-based index of the data series used to vary the color of the icons.
- < low_color >
- The low color value in the range, as a three- or six-digit HTML hexadecimal color (no # mark). This is associated with the lowest possible value in the available data range.
- < middle_color >
- The middle color value in the range, as a three- or six-digit HTML hexadecimal color (no # mark). This is associated with the middle value in the available data range.
- < high_color >
- The high color value in the range, as a three- or six-digit HTML hexadecimal color (no # mark). This is associated with the highest possible value in the available data range.
- < size_data_series >
- The zero-based index of the data series used to vary the size of the icons.
- < zero_value_size >
- The base size of the icon, at the minimum data value for the series.
- < size_multiplier >
- A size scaling factor. This value is multiplied against the difference between each icon's data value and the minimum series value, to calculate the final icon size. Therefore, an icon at the 0 data value will not be affected by this multiplier.
- < min_size >
- The minimum size for any icon, in pixels.
- < outline_color >
- The outline color for the icon, as a three- or six-digit HTML hexadecimal color (no # mark).
- < alignment >
- An optional string describing the icon alignment and offset.
Examples
This example uses two lines. The pins use color data from the series on which they're rendered, but use size data from the other series.
|  chd=s:0akAZtnkmi,nbMPJOKXXS |
Stacking Variation ( cm_repeat )
You can vary the height of a stack of icons according to the data value at a specific point.
Syntax
chem=y;s=cm_repeat;ds=<series_rendering_index>; ...other_values... ;
  d=<icon_shape>,<repeat_series_index>,<scaling_factor>,<stacking_direction>,<icon_size>,<fill_color>,<outline_color>,<spacing>,<alignment>
- < icon_shape >
- The icon to use. Specify an ID string identifying one of the images listed at the end of the page .
- < repeat_series_index >
- The zero-based index of the data series used to calculate how many icons to place at this point.
- < scaling_factor >
- The source data series value is scaled to a value from 0 to 1 and multiplied by this value to determine how many markers to place on this point. Partial values are truncated.
- < stacking_direction >
- Stacking direction: either "h" (lowercase) for horizontal or "V" (uppercase) for vertical.
- < icon_size >
- The size of each marker, in pixels. The following values are supported: 12, 16, 24.
- < fill_color >
- The fill color for the icon, as a three- or six-digit HTML hexadecimal color (no # mark).
- < outline_color >
- The outline color for the icon, as a three- or six-digit HTML hexadecimal color (no # mark).
- < spacing >
- How much space to put between each marker in a stack, in pixels.
- < alignment >
- An optional string describing the icon alignment and offset.
Example
This example uses a second dummy data series. It is not rendered on the chart, but used as a way to space all the stacks evenly, starting at the bottom of the chart.
|  chd=s1:0akAZtnkmi,AAAAAAAAAA |
Stacking and Color Variation ( cm_repeat_color )
You can vary the both the height and color of an icon stack, according to the data value at a specific point.
Syntax
chem=y;s=cm_repeat_color;ds=<series_rendering_index>; ...other_values... ;
  d=<icon_shape>,<repeat_series_index>,<scaling_factor>,<stacking_direction>,<icon_size>,<color_data_series>,<low_color>,<middle_color>,<high_color>,<outline_color>,<spacing>,<alignment>
- < icon_shape >
- The icon to use. Specify an ID string identifying one of the images listed at the end of the page .
- < repeat_series_index >
- The zero-based index of the data series used to calculate how many icons to place at this point.
- < scaling_factor >
- The source data series value is scaled to a value from 0 to 1 and multiplied by this value to determine how many markers to place on this point. Partial values are truncated.
- < stacking_direction >
- Stacking direction: either "h" (lowercase) for horizontal or "V" (uppercase) for vertical.
- < icon_size >
- The size of each marker, in pixels. The following values are supported: 12, 16, 24.
- < color_data_series >
- The zero-based index of the data series used to vary the color of the icons.
- < low_color >
- The low color value in the range, as a three- or six-digit HTML hexadecimal color (no # mark). This is associated with the lowest possible value in the available data range.
- < middle_color >
- The middle color value in the range, as a three- or six-digit HTML hexadecimal color (no # mark). This is associated with the middle value in the available data range.
- < high_color >
- The high color value in the range, as a three- or six-digit HTML hexadecimal color (no # mark). This is associated with the highest possible value in the available data range.
- < outline_color >
- The outline color for the icon, as a three- or six-digit HTML hexadecimal color (no # mark).
- < spacing >
- How much space to put between each marker in a stack, in pixels.
- < alignment >
- An optional string describing the icon alignment and offset.
Example
|  chem= |
