- Dataset Availability
- 1985-01-01T00:00:00Z–2021-12-31T00:00:00Z
- Dataset Provider
- United States Geological Survey and Bureau of Land Management
- Earth Engine Snippet
-
ee.ImageCollection("USGS/NLCD_RELEASES/2019_REL/RCMAP/V5/COVER") - Tags
Description
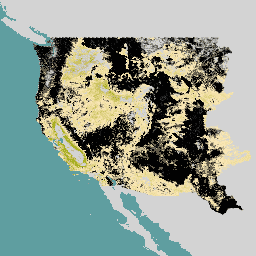
The RCMAP (Rangeland Condition Monitoring Assessment and Projection) dataset quantifies the percent cover of rangeland components across the western U.S. using Landsat imagery from 1985 to 2021. The RCMAP product suite consists of nine fractional components: annual herbaceous, bare ground, herbaceous, litter, non-sagebrush shrub, perennial herbaceous, sagebrush, shrub, and tree, in addition to the temporal trends of each component. Several enhancements were made to the RCMAP process relative to prior generations. First, they have trained time-series predictions directly from 331 high-resolution sites collected from 2013 to 2018 from Assessment, Inventory, and Monitoring (AIM) instead of using the 2016 "base" map as an intermediary. This removes one level of model error and allows the direct association of high-resolution derived training data to the corresponding year of Landsat imagery. They have incorporated all available (as of 10/1/22) Bureau of Land Management (BLM), Assessment, Inventory, and Monitoring (AIM), and Landscape Monitoring Framework (LMF) observations. LANDFIRE public reference database training observations spanning from 1985 to 2015 have been added. Neural network models with Keras tuner optimization have replaced Cubist models as the classifier. They have added a tree canopy cover component. The study area has expanded to include all of California, Oregon, and Washington; in prior generations, landscapes to the west of the Cascades were excluded. Additional spectral indices have been added as predictor variables, tasseled cap wetness, brightness, and greenness. Geographic location and elevation above sea level have been added as predictor variables. CCDC-Synthetic Landsat images were obtained for 6 monthly periods for each region and were added as predictors. These data augment the phenologic detail of the 2 seasonal Landsat composites.
Post-processing has been improved with updated fire recovery equations stratified by ecosystem resistance and resilience (R and R) classes (Maestas and Campbell, 2016) to stratify recovery rates. Ecosystem R and R maps are only available for the sagebrush biome. They intersected classes with 1985 to 2020 average water year precipitation to identify precipitation thresholds corresponding to R and R classes. Outside of the sagebrush biome, precipitation was used to produce R and R equivalent (low, medium, high). Due to the fast recovery following fire in California chaparral (e.g., Keeley and Keeley, 1981, Storey et al., 2016), they used EPA level 3 ecoregions to define a 4th R and R zone. Recovery rates are based on (Arkle et al., (in press)) who evaluated the recovery of plant functional groups in 1,278 post-fire rehab plots by time since disturbance stratified by ecosystem resistance and resilience. They have expanded this analysis by evaluated postfire-recovery in all AIM and LMF data across the West to establish maximum sage, shrub, and tree cover by time-since fire. Recovery limits in California follow (Keeley and Keeley, 1981 and Storey et al., 2016). Second, post-processing has been enhanced through a revised noise detection model. For each pixel, they fit a third order polynomial model for each component cover time-series. Observations with a z-score more than 2 standard deviations from the mean are removed, and a new third order polynomial model (i.e., cleaned fit) is fit to observations within this threshold. Finally, looking again at all observations, those observations with a z-score more than 2 standard deviations from the mean of the cleaned fit are replaced with the mean of the prior and subsequent year component cover values.
The mapping area included eight regions which were subsequently mosaicked for all nine components. These data can be used to answer critical questions regarding the influence of climate change and the suitability of management practices. Component products can be downloaded from the Multi-Resolution Land Characteristics Consortium.
See also:
Rigge, M., C. Homer, L. Cleeves, D. K. Meyer, B. Bunde, H. Shi, G. Xian, S. Schell, and M. Bobo. 2020. Quantifying western U.S. rangelands as fractional components with multi-resolution remote sensing and in situ data. Remote Sensing 12. doi:10.3390/rs12030412
Rigge, M., C. Homer, H. Shi, D. Meyer, B. Bunde, B. Granneman, K. Postma, P. Danielson, A. Case, and G. Xian. 2021. Rangeland Fractional Components Across the Western United States from 1985 to 2018. Remote Sensing 13:813. doi:10.3390/rs13040813
Bands
Resolution
30 meters
Bands
| Name | Units | Min | Max | Description |
|---|---|---|---|---|
rangeland_annual_herbaceous |
% | 0 | 100 | Percent of the pixel covered by annual herbaceous vegetation. |
rangeland_bare_ground |
% | 0 | 100 | Percent of the pixel covered by bare ground. |
rangeland_non_sagebrush_shrub |
% | 0 | 100 | Percent of the pixel covered by non-sagebrush shrubs. |
rangeland_herbaceous |
% | 0 | 100 | Percent of the pixel covered by herbaceous vegetation. |
rangeland_litter |
% | 0 | 100 | Percent of the pixel covered by litter. |
rangeland_sagebrush |
% | 0 | 100 | Percent of the pixel covered by sagebrush (Artemisia spp). |
rangeland_shrub |
% | 0 | 100 | Percent of the pixel covered by shrub. |
rangeland_perennial_herbaceous |
% | 0 | 100 | Percent of the pixel covered by perennial herbaceous vegetation. |
rangeland_tree |
% | 0 | 100 | Percent of the pixel covered by tree. |
Terms of Use
Terms of Use
This work was authored as part of the Contributor's official duties as an Employee of the United States Government and is therefore a work of the United States Government. In accordance with 17 U.S.C. 105, no copyright protection is available for such works under U.S. Law. This is an Open Access article that has been identified as being free of known restrictions under copyright law, including all related and neighboring rights (https://creativecommons.org/publicdomain/mark/1.0/). You can copy, modify, distribute and perform the work, even for commercial purposes, all without asking permission.
Citations
Rigge, M.B., Bunde, B., Postma, K., Shi, H., 2022, Rangeland Condition Monitoring Assessment and Projection (RCMAP) Fractional Component Time-Series Across the Western U.S. 1985-2021: U.S. Geological Survey data release. doi:10.5066/P9ODAZHC
Explore with Earth Engine
Code Editor (JavaScript)
// Import the NLCD RCMAP collection.
var dataset = ee.ImageCollection('USGS/NLCD_RELEASES/2019_REL/RCMAP/V5/COVER');

// Filter the collection to the 2019 product.
var nlcd2019 = dataset.filter(ee.Filter.eq('system:index', '2019')).first();

// Each product has multiple bands for different rangeland categories.
print('Bands:', nlcd2019.bandNames());

// Select the rangeland_annual_herbaceous band.
var percentCover = nlcd2019.select('rangeland_annual_herbaceous');

var vis = {
  // Map 0..100.
  'palette': [
    '000000', 'f9e8b7', 'f7e3ac', 'f0dfa3', 'eedf9c', 'eada91', 'e8d687',
    'e0d281', 'ddd077', 'd6cc6d', 'd3c667', 'd0c55e', 'cfc555', 'c6bd4f',
    'c4ba46', 'bdb83a', 'bbb534', 'b7b02c', 'b0ad1f', 'adac17', 'aaaa0a',
    'a3a700', '9fa700', '9aa700', '92a700', '8fa700', '87a700', '85a700',
    '82aa00', '7aaa00', '77aa00', '70aa00', '6caa00', '67aa00', '5fa700',
    '57a700', '52a700', '4fa700', '4aa700', '42a700', '3ca700', '37a700',
    '37a300', '36a000', '369f00', '349d00', '339900', '339900', '2f9200',
    '2d9100', '2d8f00', '2c8a00', '2c8800', '2c8500', '2c8400', '2b8200',
    '297d00', '297a00', '297900', '277700', '247400', '247000', '29700f',
    '2c6d1c', '2d6d24', '336d2d', '366c39', '376c44', '396a4a', '396a55',
    '3a6a5f', '3a696a', '396774', '3a6782', '39668a', '376292', '34629f',
    '2f62ac', '2c5fb7', '245ec4', '1e5ed0', '115cdd', '005ae0', '0057dd',
    '0152d6', '0151d0', '014fcc', '014ac4', '0147bd', '0144b8', '0142b0',
    '0141ac', '013da7', '013aa0', '01399d', '013693', '013491', '012f8a',
    '012d85', '012c82', '01297a'
  ]
};

// Display the image on the map.
Map.setCenter(-114, 38, 6);
Map.addLayer(percentCover, vis, 'Rangeland Annual Herbaceous %');