# Get started with Earth Engine in the Code Editor
This quickstart will give you an interactive introduction to visualizing and
analyzing geospatial data with the Earth Engine Code Editor.
## Before you begin
[Register or create](https://console.cloud.google.com/earth-engine) a Google Cloud
Project; you'll be prompted to complete the following steps. If you already have a project
registered for Earth Engine access, skip to the next section.
- Select the project's purpose: commercial or noncommercial.
- If the purpose is noncommercial, select a project type.
- Create a new Google Cloud project or select an existing project.
- If the purpose is commercial, verify or set up billing for your project.
- Confirm your project information.
**Note:** If you don't plan to keep the resources that you create
in this procedure, create a project instead of selecting an existing project. After you finish
these steps, you can
[delete the project](https://cloud.google.com/resource-manager/docs/creating-managing-projects#shutting_down_projects),
removing all resources owned by the project.
## Welcome to the Code Editor
The Earth Engine Code Editor is a web-based interactive development environment
for accessing Earth Engine and visualizing results directly in the browser. It
provides tools for managing scripts, assets, and export tasks, with analyses
written in JavaScript using the Earth Engine JavaScript client library. The
interface includes a code editor, map display, and console for immediate
feedback and inspection.
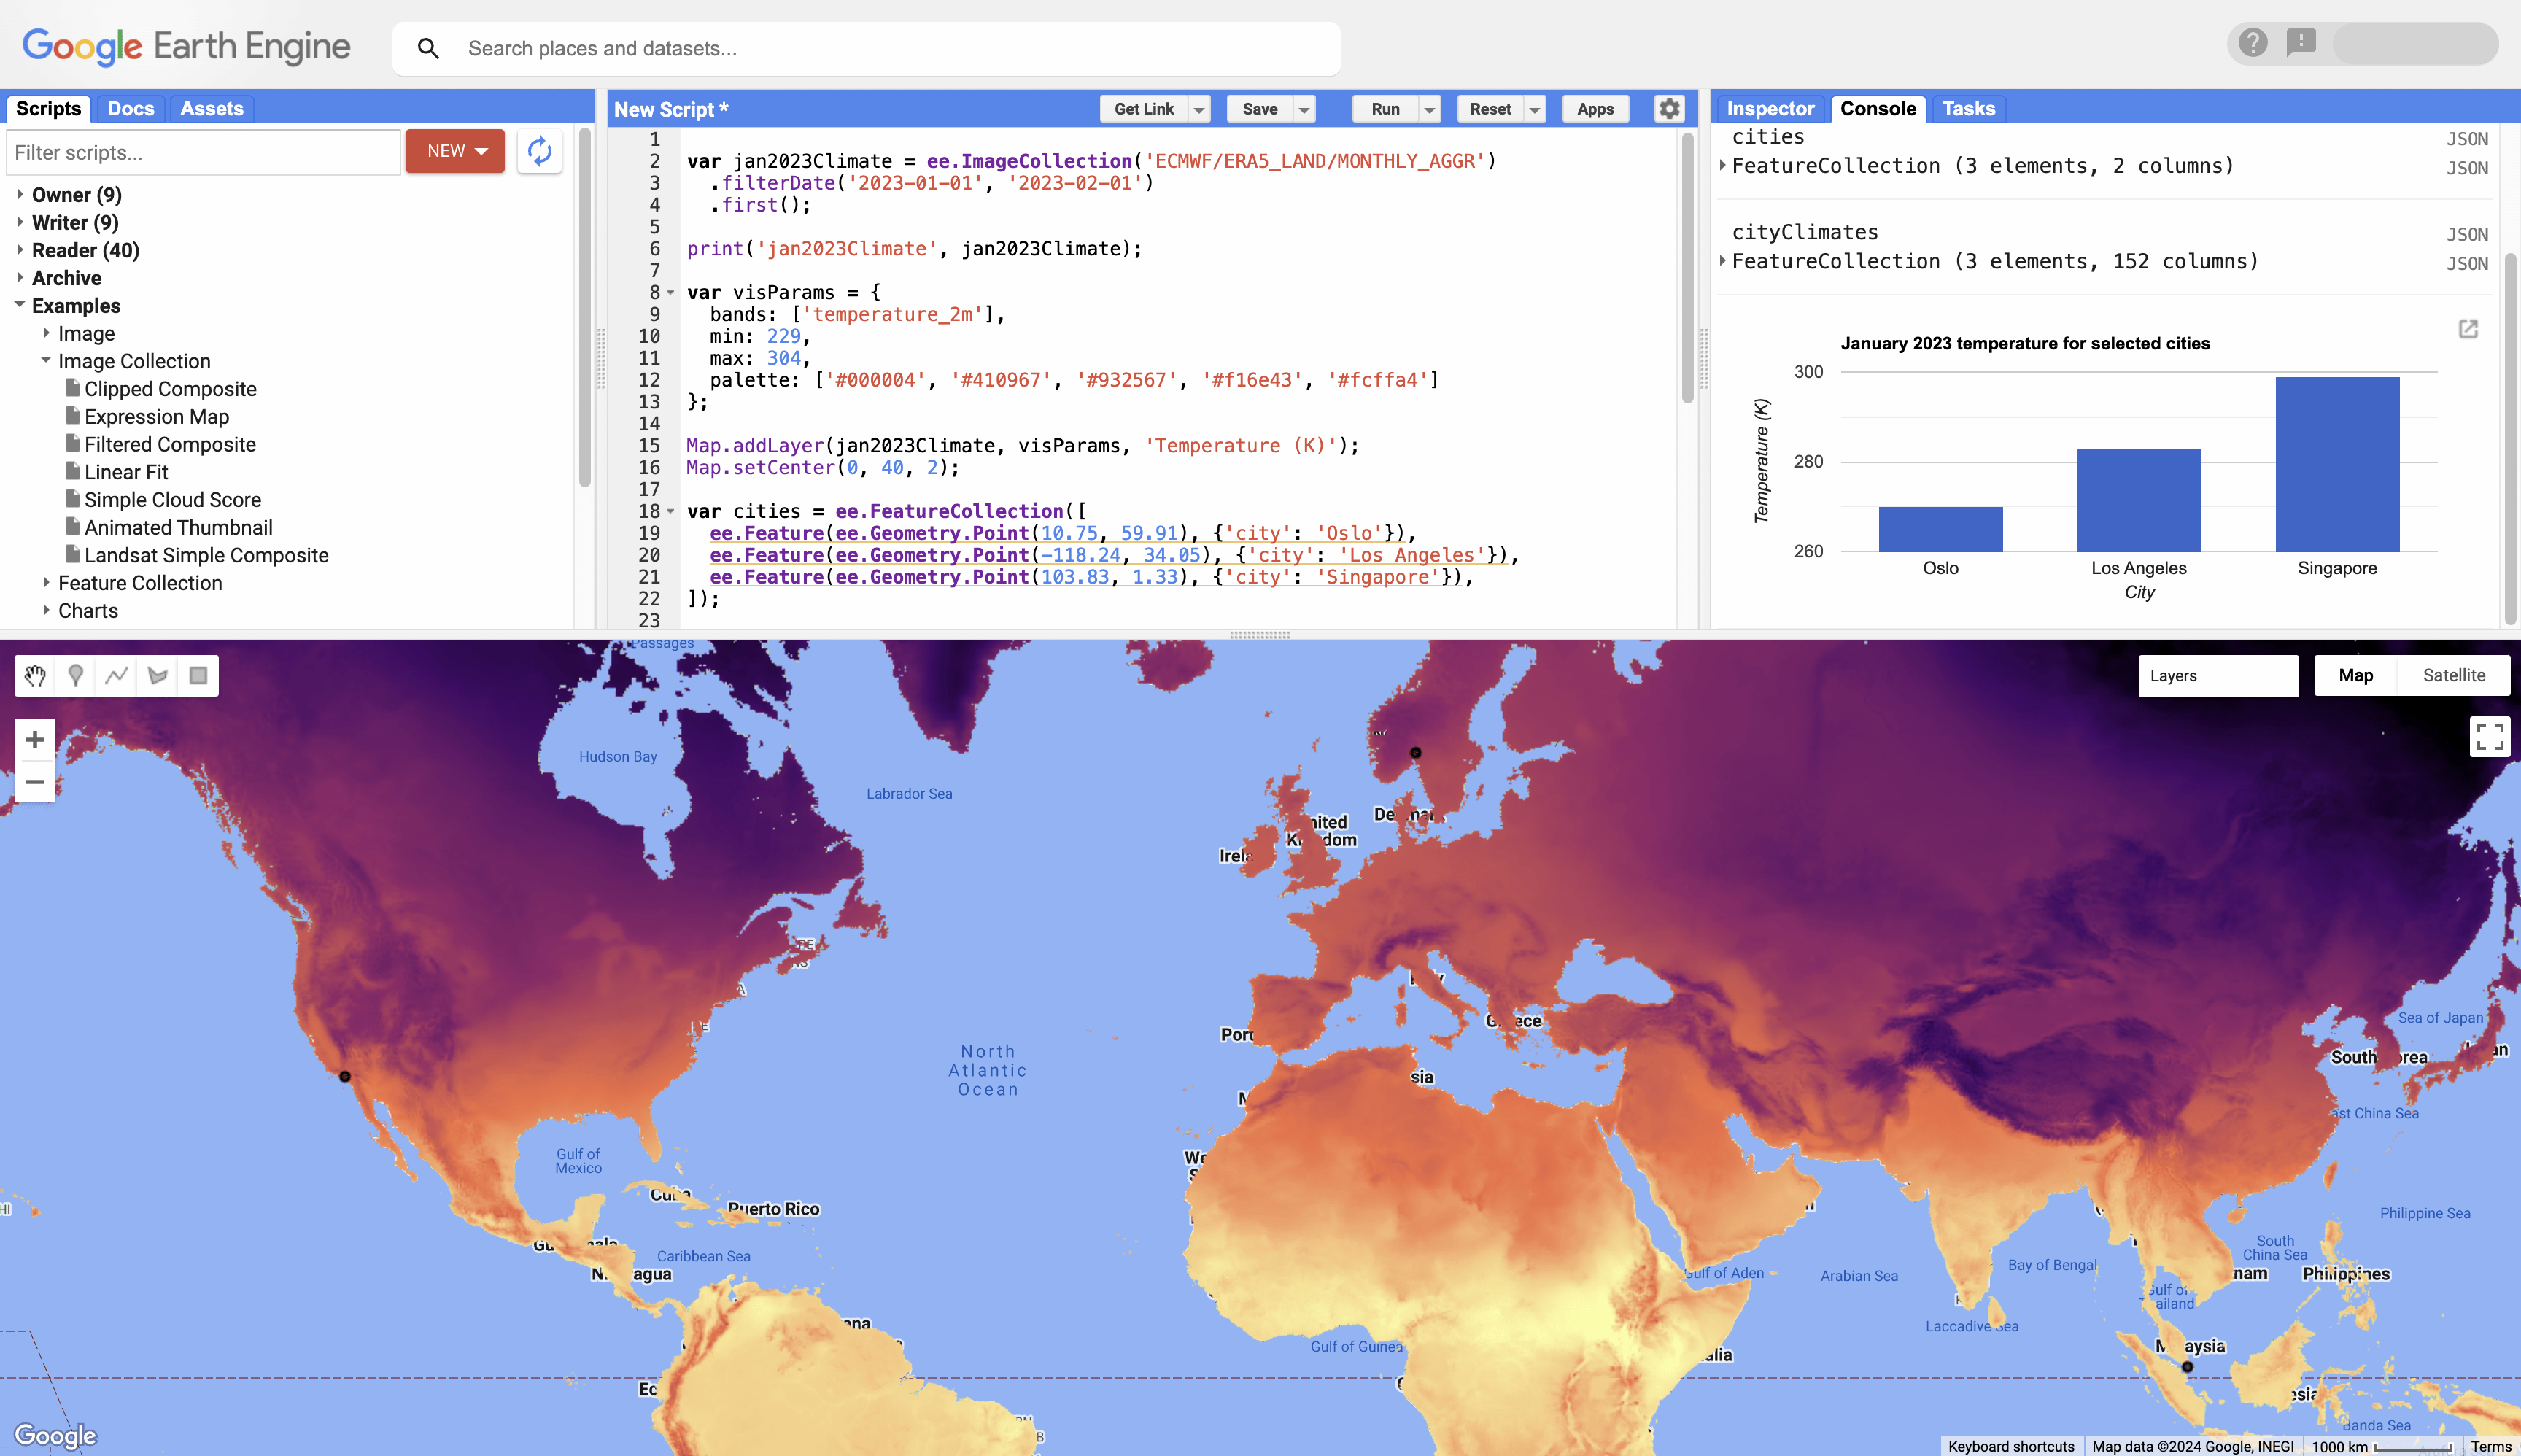 The Earth Engine Code Editor at [code.earthengine.google.com](https://code.earthengine.google.com)
## Get started
**1.** Visit [**code.earthengine.google.com**](https://code.earthengine.google.com)
to get started. On your first Code Editor visit, you may be greeted with a tour
highlighting the different features of the Code Editor.
**2.** Navigate to the login widget in the upper right corner and ensure the
project you set up for this quickstart is selected. If it's not, select
"Change Cloud Project" from the menu and follow the prompts to search for it
and select it.
**3.** In the following sections, copy each code block into the editor panel,
click "Run", and inspect the results in the map or console. Each step builds
upon previous ones, so add code progressively without removing earlier blocks.
## Add raster data to a map
**1.** Load climate data for a given period and display its metadata.
```javascript
var jan2023Climate = ee.ImageCollection('ECMWF/ERA5_LAND/MONTHLY_AGGR')
.filterDate('2023-01-01', '2023-02-01')
.first();
print('jan2023Climate', jan2023Climate);
```
**2.** Add the temperature band as a layer to the map widget with specific
visualization properties.
```javascript
var visParams = {
bands: ['temperature_2m'],
min: 229,
max: 304,
palette: ['#000004', '#410967', '#932567', '#f16e43', '#fcffa4']
};
Map.addLayer(jan2023Climate, visParams, 'Temperature (K)');
Map.setCenter(0, 40, 2);
```
## Add vector data to a map
**1.** Create a vector data object with points for three cities.
```javascript
var cities = ee.FeatureCollection([
ee.Feature(ee.Geometry.Point(10.75, 59.91), {'city': 'Oslo'}),
ee.Feature(ee.Geometry.Point(-118.24, 34.05), {'city': 'Los Angeles'}),
ee.Feature(ee.Geometry.Point(103.83, 1.33), {'city': 'Singapore'}),
]);
print('cities', cities);
```
**2.** Add the city locations to the map and rerun the script to display it.
```javascript
Map.addLayer(cities, null, 'Cities');
```
## Extract and chart data
**1.** Extract the climate data for the three cities; results are added to the
input FeatureCollection.
```javascript
var cityClimates = jan2023Climate.reduceRegions(cities, ee.Reducer.first());
print('cityClimates', cityClimates);
```
**2.** Plot the temperature for the cities as a bar chart.
```javascript
var chart = ui.Chart.feature.byFeature(cityClimates, 'city', 'temperature_2m')
.setChartType('ColumnChart')
.setOptions({
title: 'January 2023 temperature for selected cities',
hAxis: {title: 'City'},
vAxis: {title: 'Temperature (K)'},
legend: {position: 'none'}
});
print(chart);
```
## What's next
- Learn more about the [features of the Code Editor](https://developers.google.com/earth-engine/guides/playground).
- Learn about analyzing data with Earth Engine's [objects and methods](https://developers.google.com/earth-engine/guides/objects_methods_overview).
- Learn about Earth Engine's [processing environments](https://developers.google.com/earth-engine/guides/processing_environments).
- Learn about Earth Engine's [machine learning capabilities](https://developers.google.com/earth-engine/guides/machine-learning).
- Learn how to [export your computation results to BigQuery](https://developers.google.com/earth-engine/guides/exporting_to_bigquery).