The Google Health API provides dedicated aggregation endpoints that group and
summarize health records into time windows. Instead of retrieving and summing
individual raw records on the client, use the aggregation endpoints to compute
metrics (such as totals, averages, minimums, and maximums) over a reconciled
data stream:
- The [`rollUp`
endpoint](https://developers.google.com/health/reference/rest/v4/users.dataTypes.dataPoints/rollUp) aggregates data points over physical time intervals in UTC using a configurable window duration in seconds (`windowSize`).
- The [`dailyRollUp`
endpoint](https://developers.google.com/health/reference/rest/v4/users.dataTypes.dataPoints/dailyRollUp) aggregates data points across one or more calendar days (`windowSizeDays`) using civil time relative to the user's local clock.
Both endpoints automatically reconcile overlapping data points across connected
devices and exclude off-wrist periods for wearable data types that support
on-wrist detection.
## Compare aggregation endpoints
Choose the aggregation endpoint that matches how your application groups and
displays time-series health metrics:
| Feature | `rollUp` endpoint | `dailyRollUp` endpoint |
|---|---|---|
| HTTP request | `POST https://health.googleapis.com/v4/users/me/dataTypes/data-type/dataPoints:rollUp` | `POST https://health.googleapis.com/v4/users/me/dataTypes/data-type/dataPoints:dailyRollUp` |
| Time representation | Physical time in UTC (`startTime` and `endTime` in RFC 3339 format). | Civil time (`start` and `end` as `CivilDateTime` objects). |
| Window parameter | `windowSize` (required string duration in seconds, minimum `"1s"`). | `windowSizeDays` (optional integer number of days, defaults to `1`). |
| Response object | `RollupDataPoint` | `DailyRollupDataPoint` |
| Response ordering | Reverse-chronological order (newest window first). | Reverse-chronological order (newest window first). |
| Best for | Intraday charts, hourly or minute-level histograms, and fixed-duration UTC analysis. | Daily dashboards, multi-day trends, and summaries that account for time zone travel or Daylight Saving Time. |
Both endpoints enforce per-request maximum query range limits based on the data
type:
- A maximum query range of 14 days applies to `calories-in-heart-rate-zone`, `heart-rate`, `active-minutes`, and `total-calories`.
- A maximum query range of 90 days applies to all other supported data types, such as `steps` and `distance`.
To backfill longer historical periods, split your queries into sequential
chunks within these maximum range limits.
To check which data types support `rollup` and `dailyRollup`, see the
[Google Health API data types](https://developers.google.com/health/data-types.md.txt) reference.
## Aggregate over physical time intervals
Use the [`rollUp`
endpoint](https://developers.google.com/health/reference/rest/v4/users.dataTypes.dataPoints/rollUp) to aggregate
data points over a physical time `range` (in UTC) grouped by a window duration
in seconds (`windowSize`).
When calling the `rollUp` endpoint, provide a JSON request body containing the
closed-open `range` (`startTime` inclusive, `endTime` exclusive) and
`windowSize`. Keep the following `windowSize` requirements in mind:
- The `windowSize` duration must be at least 1 second (`"1s"`). The API rejects sub-second durations, zero, or negative durations with a `400 Bad
Request` (`INVALID_ROLLUP_WINDOW`) error.
- To avoid uneven distribution of aggregated data across sub-buckets, choose a `windowSize` that is equal to or larger than the underlying storage resolution of the data type (such as `"60s"` for 1-minute step intervals). For details, see [Rollup window and storage
resolution](https://developers.google.com/health/aggregate-data#rollup-window-storage-resolution).
For example, the following request rolls up step counts in 1-minute intervals
(`60s`):
### Request
```
POST https://health.googleapis.com/v4/users/me/dataTypes/steps/dataPoints:rollUp
Authorization: Bearer access-token
Accept: application/json
{
"range": {
"startTime": "2026-02-17T17:00:00Z",
"endTime": "2026-02-17T17:59:59Z"
},
"windowSize": "60s"
}
```
### Response
```
{
"rollupDataPoints": [
{
"startTime": "2026-02-17T17:55:00Z",
"endTime": "2026-02-17T17:56:00Z",
"steps": {
"countSum": "72"
}
},
{
"startTime": "2026-02-17T17:54:00Z",
"endTime": "2026-02-17T17:55:00Z",
"steps": {
"countSum": "85"
}
},
...
]
}
```
## Aggregate across calendar days
Use the [`dailyRollUp`
endpoint](https://developers.google.com/health/reference/rest/v4/users.dataTypes.dataPoints/dailyRollUp) to
aggregate data across a single calendar day or multiple days (`windowSizeDays`).
Provide the closed-open civil time `range` (`start` inclusive, `end` exclusive)
in the request body. Depending on the data type, the endpoint returns
aggregated values such as the sum or average over each civil window.
Because `dailyRollUp` operates on civil time using the UTC offsets recorded with
each data point, it automatically reconciles variable day lengths caused by
Daylight Saving Time transitions or travel across time zones. Keep the
following `dailyRollUp` behaviors in mind:
1. Because `CivilTimeInterval` is a closed-open interval (`[start, end)`), set `range.end` to the next calendar day at `00:00:00` (`{"hours": 0, "minutes": 0, "seconds": 0}`) rather than `23:59:59` on the same day. Setting `range.end.time` to `23:59:59` excludes the final second of the day (`[23:59:59, 24:00:00)`).
2. Each `dailyRollUp` request enforces a per-request maximum `range` span of `90` days for data types such as `steps` and `distance`, and `14` days for `total-calories`, `heart-rate`, `active-minutes`, and `calories-in-heart-rate-zone`. Split longer historical backfills into sequential chunks within these per-request limits.
3. For unworn windows with no manual or on-wrist data points, the `DailyRollupDataPoint` omits the data type value field (such as `steps`, indicating `0` steps). When a user wears a device during the window but records zero activity, the response includes the value field with a zero total (such as `"steps": {"countSum": "0"}`).
For example, the following request aggregates step counts over a single civil
day (`windowSizeDays: 1`):
### Request
```
POST https://health.googleapis.com/v4/users/me/dataTypes/steps/dataPoints:dailyRollUp
Authorization: Bearer access-token
Accept: application/json
{
"range": {
"start": {
"date": {
"year": 2026,
"month": 2,
"day": 26
},
"time": {
"hours": 0,
"minutes": 0,
"seconds": 0,
"nanos": 0
}
},
"end": {
"date": {
"year": 2026,
"month": 2,
"day": 27
},
"time": {
"hours": 0,
"minutes": 0,
"seconds": 0,
"nanos": 0
}
}
},
"windowSizeDays": 1
}
```
### Response
```
{
"rollupDataPoints": [
{
"civilStartTime": {
"date": {
"year": 2026,
"month": 2,
"day": 26
},
"time": {}
},
"civilEndTime": {
"date": {
"year": 2026,
"month": 2,
"day": 27
},
"time": {}
},
"steps": {
"countSum": "3822"
}
}
]
}
```
## Aggregate by data source family
Both `rollUp` and `dailyRollUp` accept an optional `dataSourceFamily` field in
the JSON request body to restrict aggregation to specific source groups:
- The `users/me/dataSourceFamilies/all-sources` option (default) aggregates data reconciled across all registered first-party and third-party sources.
- The `users/me/dataSourceFamilies/google-wearables` option aggregates data recorded by Google and Fitbit wearable tracker devices, excluding manually logged and phone-estimated data.
- The `users/me/dataSourceFamilies/google-sources` option aggregates data from first-party Google and Fitbit sources, including wearable trackers, Health Connect, and manual entries in first-party apps.
For full parameter requirements and request and response examples, see
[Filter by data source family](https://developers.google.com/health/filters.md.txt#filter-by-data-source) in the
Filter data guide.
## Rollup window and storage resolution
Although the `rollUp` endpoint accepts any `windowSize` of 1 second (`"1s"`) or
larger, different data types record and persist measurements at different
sampling rates or interval durations in underlying storage. For example,
wearable physical activity metrics such as `steps`, `distance`,
`active-minutes`, and `active-energy-burned` are typically recorded in 1-minute
(`60s`) intervals.
The following table lists the underlying storage resolutions and minimum
recommended `windowSize` values for common data types:
| Storage resolution | Minimum recommended `windowSize` | Data types |
|---|---|---|
| 1 second (`1s`) | `"1s"` | `heart-rate` |
| 1 minute (`60s`) | `"60s"` | `active-energy-burned`, `active-minutes`, `active-zone-minutes`, `altitude`, `calories-in-heart-rate-zone`, `distance`, `floors`, `steps`, `time-in-heart-rate-zone`, `total-calories` |
When aggregating interval data types, the `rollUp` endpoint places each recorded
data point into the bucket containing the data point's `startTime`. The API
does not slice, interpolate, or distribute interval data across sub-interval
buckets.
If you specify a `windowSize` that is smaller than the underlying data storage
interval (for example, requesting a 10-second window for `steps` stored at
1-minute intervals):
1. The first sub-bucket matching the interval's `startTime` (for example, `10:00:00` to `10:00:10`) receives the entire minute's accumulated count (for example, all 100 steps recorded for that minute).
2. The remaining sub-buckets within that same minute (`10:00:10` to `10:00:20`, `10:00:20` to `10:00:30`, and so on) receive no data points, because no interval begins within those windows.
This produces spiky data where the entire interval's value is concentrated in
the first sub-window, as shown in Figure 1.
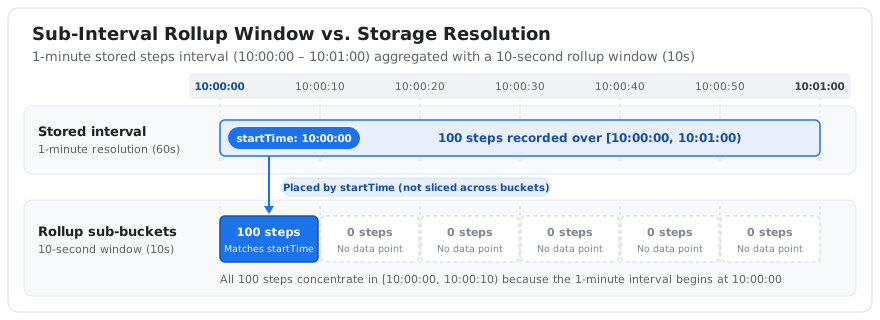 *Figure 1: Sub-interval rollup bucketing where a 1-minute interval is
assigned to the first 10-second sub-bucket by startTime*
To obtain evenly distributed and meaningful aggregates, always set `windowSize`
to a duration equal to or greater than the underlying storage resolution of the
target data type (for example, `"60s"` or larger for `steps`). For the storage
resolution and minimum recommended rollup window of each data type, see the
[Google Health API data types](https://developers.google.com/health/data-types.md.txt) reference.
## Bucketing when range is not a multiple of window size
If the requested range is not an exact multiple of `windowSize` (or
`windowSizeDays`), the final chronological bucket is truncated at the upper
endpoint of the range and covers a duration shorter than the window size. The
API accepts your request without modification and does not perform rounding,
time shifts, or data interpolation.
To cover the entire requested range, the API uses ceiling division to compute
the total number of aggregation windows:
`Number of windows = ceiling(Range duration / Window size)`
Every bucket starts sequentially from the beginning of your range. If adding
another full-sized window extends beyond your requested end time, the final
window is truncated (clamped) at the range end time.
### How bucketing works
When you request rollups with non-divisible ranges, the API applies the
following rules:
- Bucketing starts at the beginning of your requested range (`range.startTime` or `range.start`) and progresses forward by the window size (`windowSize` or `windowSizeDays`).
- The final chronological bucket is clamped at the end of your requested range (`range.endTime` or `range.end`), covering a shorter duration than the requested window size.
- The returned `RollupDataPoint` or `DailyRollupDataPoint` objects include their own explicit start and end timestamps, which you can use to inspect the actual duration of the truncated bucket.
- Because the API returns rollup data in reverse-chronological order (newest first), the final chronological bucket (the truncated bucket) appears as the first element (`index 0`) in the returned list.
Figure 2 illustrates how the API buckets a non-divisible range forward from
`range.startTime`, clamps the final bucket at `range.endTime`, and returns the
resulting buckets in reverse-chronological order.
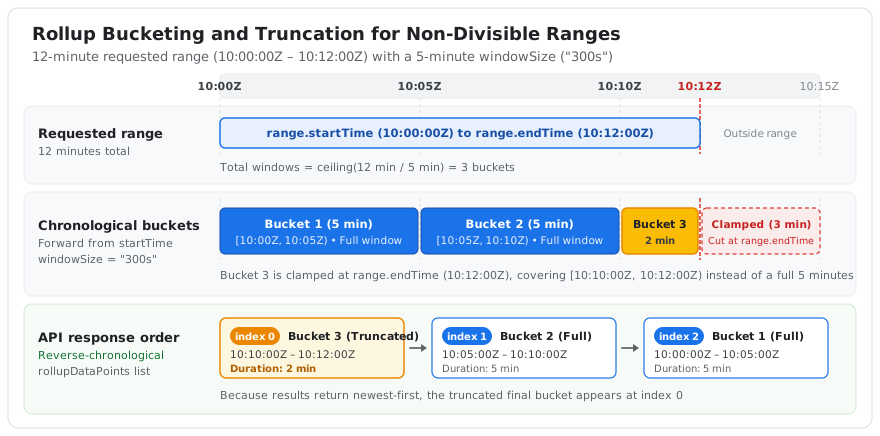 *Figure 2: Rollup bucketing, end-of-range truncation, and
reverse-chronological response ordering*
### Example 12-minute range with a 5-minute window
Suppose a client requests a rollup over a 12-minute range with a 5-minute
`windowSize` (`"300s"`):
- The `range.startTime` value is `10:00:00Z`.
- The `range.endTime` value is `10:12:00Z`, for a total duration of 12 minutes.
- The `windowSize` value is `"300s"` (5 minutes).
Because 12 minutes is not an exact multiple of 5 minutes (`12 = 5 * 2 + 2`),
the API computes the number of windows as `ceiling(12 / 5) = 3`. This produces
three chronological buckets:
| Bucket | Interval | Duration | Window status |
|---|---|---|---|
| Bucket 1 | `[10:00:00Z, 10:05:00Z)` | 5 minutes | Full window |
| Bucket 2 | `[10:05:00Z, 10:10:00Z)` | 5 minutes | Full window |
| Bucket 3 | `[10:10:00Z, 10:12:00Z)` | 2 minutes | Truncated at `range.endTime` |
### Impact on aggregated values
Because the final chronological window has a shorter duration, additive metrics
(such as the sum or count of steps) are lower in the truncated bucket due to
the shorter time span.
If a user walks at a steady pace of 100 steps per minute during this entire
12-minute range, the buckets contain the following totals:
- Bucket 1 (`10:00:00Z` to `10:05:00Z`) records 500 steps (5 minutes at 100 steps per minute).
- Bucket 2 (`10:05:00Z` to `10:10:00Z`) records 500 steps (5 minutes at 100 steps per minute).
- Bucket 3 (`10:10:00Z` to `10:12:00Z`) records 200 steps (2 minutes at 100 steps per minute).
The lower step count of 200 steps in Bucket 3 is due to the 2-minute
duration of the truncated window, not a drop in the user's activity. When
plotting or analyzing this data, normalize the counts using each bucket's
explicit duration to avoid presenting a misleading drop in user activity.
Figure 3 compares raw additive step totals (`countSum`) against
duration-normalized rates across the three buckets.
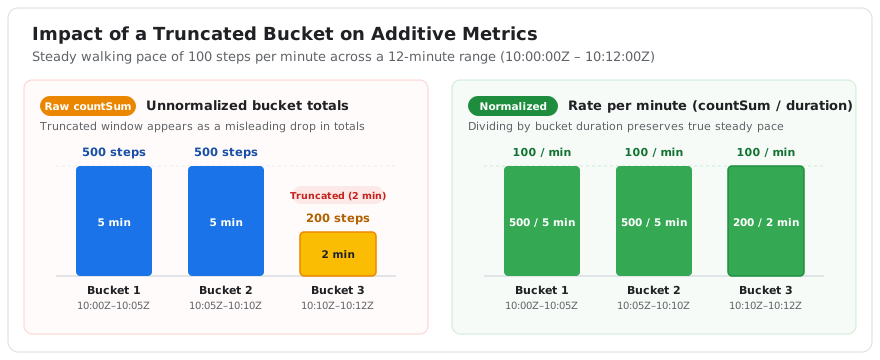 *Figure 3: Raw additive totals compared to duration-normalized rates
for a truncated rollup bucket*
### Example API response showing ordering
Because the API returns results in reverse-chronological order, the truncated
bucket appears as the first element in the returned list:
```json
{
"rollupDataPoints": [
{
"startTime": "2026-08-20T10:10:00Z",
"endTime": "2026-08-20T10:12:00Z",
"steps": {
"countSum": "200"
}
},
{
"startTime": "2026-08-20T10:05:00Z",
"endTime": "2026-08-20T10:10:00Z",
"steps": {
"countSum": "500"
}
},
{
"startTime": "2026-08-20T10:00:00Z",
"endTime": "2026-08-20T10:05:00Z",
"steps": {
"countSum": "500"
}
}
]
}
```