コミュニティ由来ビジュアル表示とのインタラクションを通じてレポートをフィルタ処理することで、コミュニティ由来ビジュアル表示をグラフフィルタとして使用することができます。
コミュニティ由来ビジュアル表示によるグラフフィルタの仕組み
コミュニティ ビジュアリゼーションをグラフフィルタとして使用するには、以下を行う必要があります。
config.interactionsプロパティを設定する- フィルタ情報を含む
dscc.sendInteraction()を呼び出すコードを記述する
インタラクションの定義
ビジュアル表示がインタラクションをサポートしている場合、設定で定義する必要があります。定義すると、プロパティ パネルにチェックボックスが表示されます。

config.interactions の例:
{
  "data": ...,
  "style": ...,
  "interactions": [
    {
      "id": "interactionsConfigId",
      "supportedActions": ["FILTER"]
    }
  ]
}
フィルタのコードを記述する
dscc.sendInteraction() を使って、ユーザーの操作をフィルタ操作に関連付けます。
例:
const handleInteraction = () => {
  // this is the interactionId defined in the config
  const interactionId = "interactionConfigId";

  // the ID of the field you want to filter on
  const dimensionId = "qt_ky8sltutsb";

  // the value of the field you want to filter on
  const value = "USA";

  // the interaction type - only FILTER is supported right now
  const FILTER = dscc.InteractionType.FILTER;

  let interactionData = {
    concepts: [dimensionId],
    values: [[value]]
  };

  // send Looker Studio an instruction to filter other charts in the dashboard
  dscc.sendInteraction(interactionId, FILTER, interactionData);
};
レポートが次の場合、Looker Studio は dscc.sendInteraction から送信されたメッセージを無視します。
エディタで「フィルタ」が有効になっていません可視化のためのインタラクションです。
フィルタ状態のトラッキング
Looker Studio がビジュアリゼーションに送信する data オブジェクトは、情報を提供します。
説明します。
data.interactions の例:
"onClick": {
  "value": {
    "type": "FILTER",
      "data": {
      "concepts": [
        "qt_h6oibrb6wb",
        "qt_i6oibrb6wb"
      ],
        "values": [
          [
            "Afternoon",
            "Sunday"
          ],
          [
            "Afternoon",
            "Thursday"
          ],
          [
            "Morning",
            "Tuesday"
          ]
        ]
    }
  },
  "supportedActions": [
    "FILTER"
  ]
}
value.data が未定義でない場合、現在ビジュアリゼーションはその他をフィルタリングしています。
ダッシュボードのコンポーネントです。
例:
const barHighlighting = (interactionsById) => {
  // the interactionId defined in the config
  const interactionId = "interactionConfigId";

  const interactionField = interactionsById[interactionId];

  // if filter is selected
  const filterSelected = interactionField.type === "FILTER";
  // if the viz is currently acting as a filter
  const filterHasData = "data" in interactionField;

  if (filterSelected && filterHasData){
    // call the highlightBar function on the selected data
    highlightBar(interactionField.data);
  } else {
    // clear highlighting if no data selected
    clearHighlight()
  }
}
interactionData の構築
interactionData オブジェクトは、Looker Studio がフィルタする方法を定義します。
できます。
単一ディメンションでのフィルタ

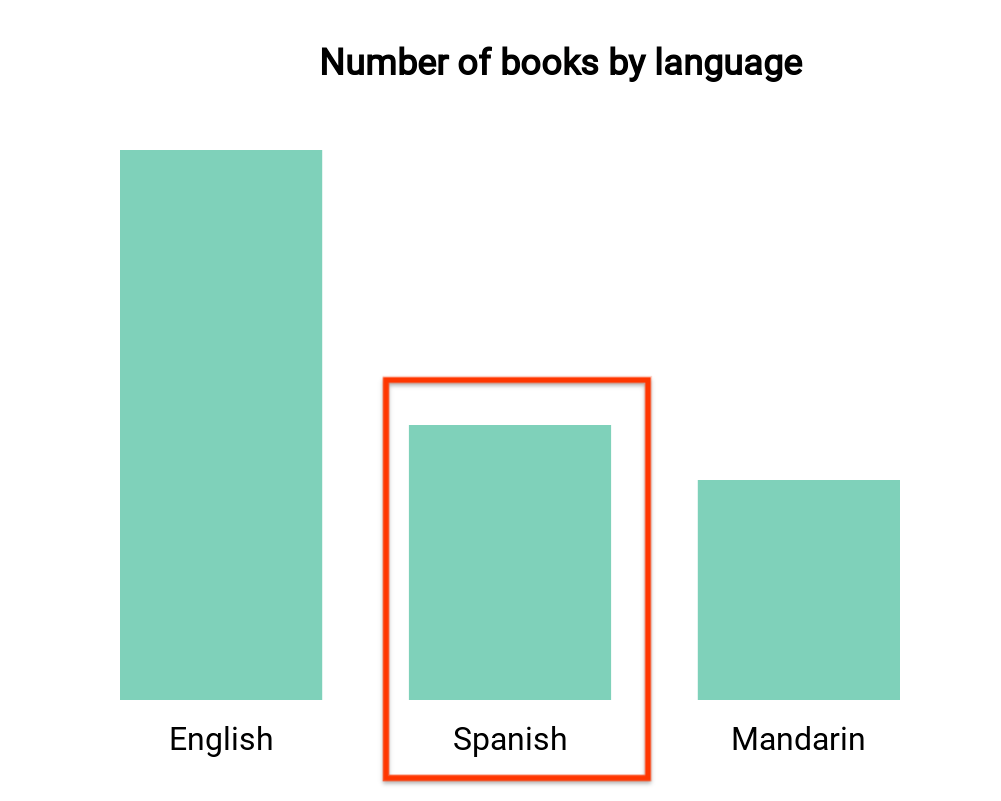
この棒グラフでは、言語別(ディメンション 1 つとディメンション 1 つ)ごとに
できます。ユーザーがスペイン語の本に対応する棒グラフを選択することで、ダッシュボードの残りの部分を除外するとします。お客様の
interactionData は次のようになります。
var interactionData = {
  "concepts": ["languageDimensionId"],
  "values": [["Spanish"]]
}
複数ディメンションでのフィルタ

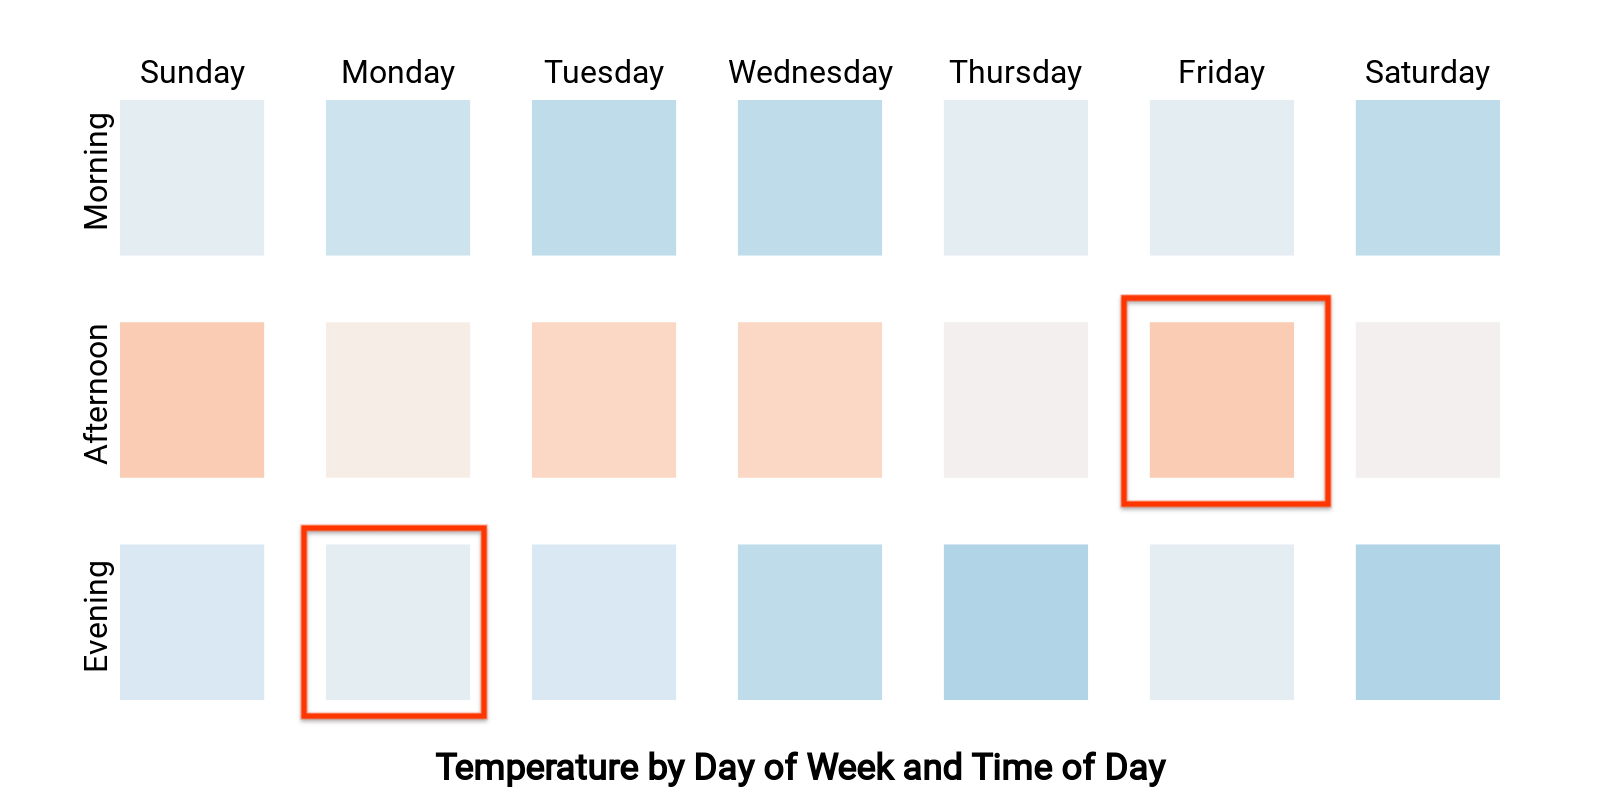
このヒートマップは、曜日と時刻ごとの温度(2 つのディメンションと 1 つの指標)を示します。ユーザーが「Monday」に対応するセルを選択したとします。
夕方」「金曜日の午後」と検索し
「月曜日の夕方」または「月曜日の夜」のまたは「金曜日」
interactionData は次のようになります。
var interactionData = {
  "concepts": ["dayOfWeekDimensionId", "timeOfDayDimensionId"],
  "values": [
    ["Monday", "evening"],
    ["Friday", "afternoon"]
  ]
}
