
커뮤니티 시각화를 차트 필터로 사용하여 커뮤니티 시각화와의 상호작용을 통해 보고할 수 있습니다.
커뮤니티 시각화 차트 필터 작동 방식
커뮤니티 시각화를 차트 필터로 사용하려면 다음을 수행해야 합니다.
config.interactions속성 구성- 필터 정보를 사용하여
dscc.sendInteraction()를 호출하는 코드를 작성합니다.
상호작용 정의
시각화가 상호작용을 지원하는 경우 구성에 정의되어 있습니다. 정의되면 을 클릭합니다.
config.interactions 예:
{
  "data": ...,
  "style": ...,
  "interactions": [
    {
      "id": "interactionsConfigId",
      "supportedActions": ["FILTER"]
    }
  ]
}
필터 코드 작성
dscc.sendInteraction()를 사용하여 사용자 상호작용을 필터 작업과 연결합니다.
예:
const handleInteraction = () => {
  // this is the interactionId defined in the config
  const interactionId = "interactionConfigId";

  // the ID of the field you want to filter on
  const dimensionId = "qt_ky8sltutsb";

  // the value of the field you want to filter on
  const value = "USA";

  // the interaction type - only FILTER is supported right now
  const FILTER = dscc.InteractionType.FILTER;

  let interactionData = {
    concepts: [dimensionId],
    values: [[value]]
  };

  // send Looker Studio an instruction to filter other charts in the dashboard
  dscc.sendInteraction(interactionId, FILTER, interactionData);
};
다음 경우 Looker Studio에서 dscc.sendInteraction님이 보낸 메시지를 무시합니다.
편집기에서 'filter'(필터)를 사용 설정하지 않았습니다. 상호작용을 시각화할 수 있습니다
필터 상태 추적
Looker Studio에서 시각화로 전송하는 data 객체는 정보를 제공합니다.
살펴봤습니다
data.interactions 예:
"onClick": {
  "value": {
    "type": "FILTER",
      "data": {
      "concepts": [
        "qt_h6oibrb6wb",
        "qt_i6oibrb6wb"
      ],
        "values": [
          [
            "Afternoon",
            "Sunday"
          ],
          [
            "Afternoon",
            "Thursday"
          ],
          [
            "Morning",
            "Tuesday"
          ]
        ]
    }
  },
  "supportedActions": [
    "FILTER"
  ]
}
value.data가 정의되지 않은 경우 시각화가 현재 기타 항목을 필터링하고 있는 것입니다.
구성요소입니다.
예:
const barHighlighting = (interactionsById) => {
  // the interactionId defined in the config
  const interactionId = "interactionConfigId";

  const interactionField = interactionsById[interactionId];

  // if filter is selected
  const filterSelected = interactionField.type === "FILTER";
  // if the viz is currently acting as a filter
  const filterHasData = "data" in interactionField;

  if (filterSelected && filterHasData){
    // call the highlightBar function on the selected data
    highlightBar(interactionField.data);
  } else {
    // clear highlighting if no data selected
    clearHighlight()
  }
}
interactionData 구성 중
interactionData 객체는 Looker Studio에서
대시보드에서 이 설정을 지정할 수 있습니다.
단일 측정기준 필터
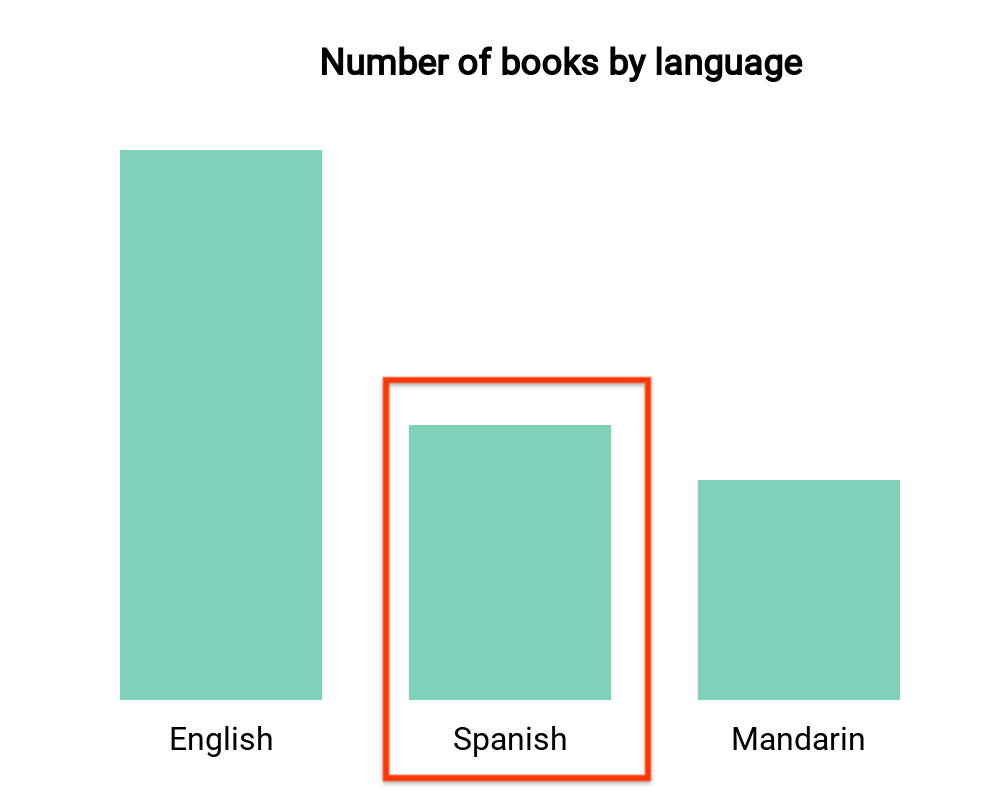
이 막대 그래프는 언어별 도서 수를 시각화합니다 (한 측정기준과 하나씩).
측정항목). 사용자가 스페인어로 된 책에 해당하는 막대를 선택했다고 가정해 보겠습니다.
선택을 통해 대시보드의 나머지 부분을 필터링하고 싶었습니다. 내
interactionData는 다음과 같이 표시됩니다.
var interactionData = {
  "concepts": ["languageDimensionId"],
  "values": [["Spanish"]]
}
여러 측정기준 필터
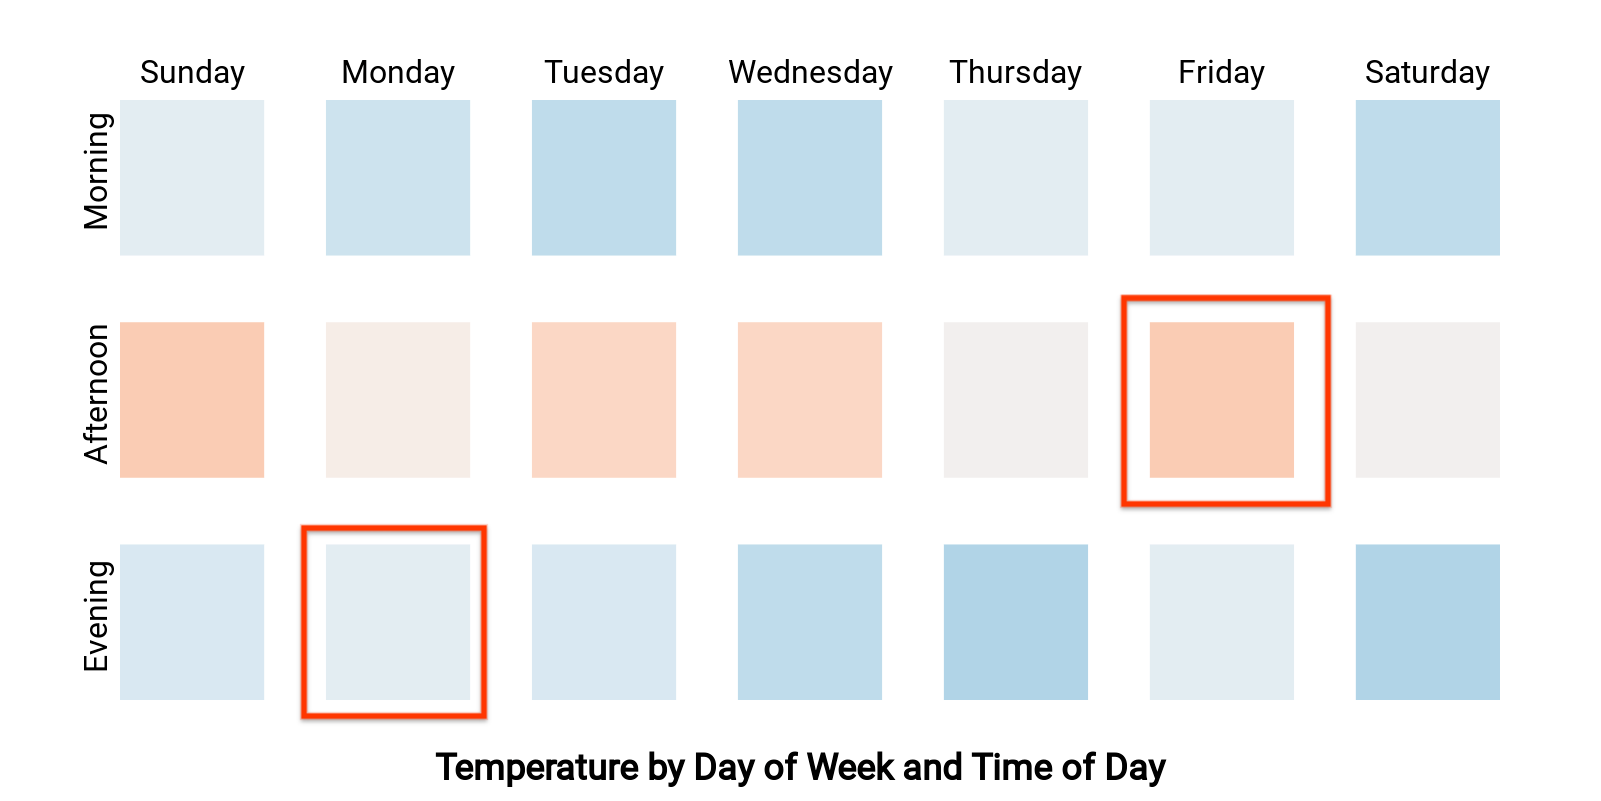
이 히트맵은 요일 및 시간별 기온을 보여줍니다 (두 개의 측정기준
측정항목 1개). 사용자가 'Monday'에 해당하는 셀을 선택했다고 가정해 보겠습니다.
저녁' '금요일 오후'를 타겟팅한다면
대시보드에 '월요일 저녁' 또는 '금요일
오후'라고 표시됩니다. interactionData이 다음과 같이 표시됩니다.
var interactionData = {
  "concepts": ["dayOfWeekDimensionId", "timeOfDayDimensionId"],
  "values": [
    ["Monday", "evening"],
    ["Friday", "afternoon"]
  ]
}