Sử dụng bộ sưu tập để sắp xếp ngăn nắp các trang
Lưu và phân loại nội dung dựa trên lựa chọn ưu tiên của bạn.
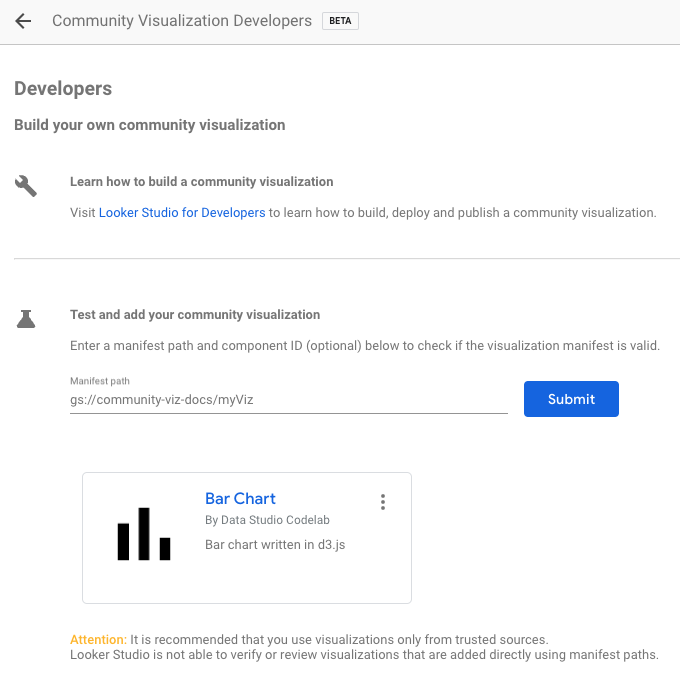
Để tải hình ảnh dữ liệu cộng đồng mà bạn đã phát triển, hãy sử dụng vị trí của tệp kê khai có tiền tố gs://.
Chỉnh sửa báo cáo
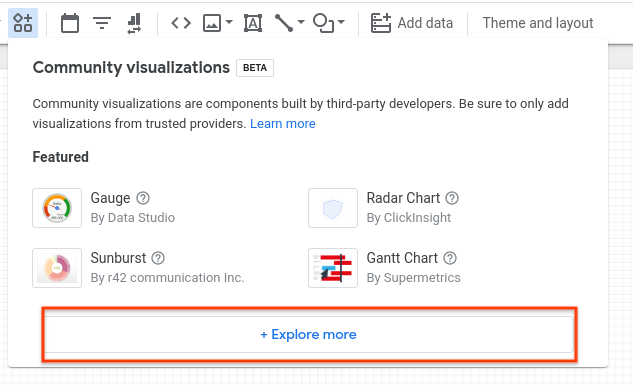
Trên thanh công cụ, hãy nhấp vào Hình ảnh trực quan và thành phần cộng đồng
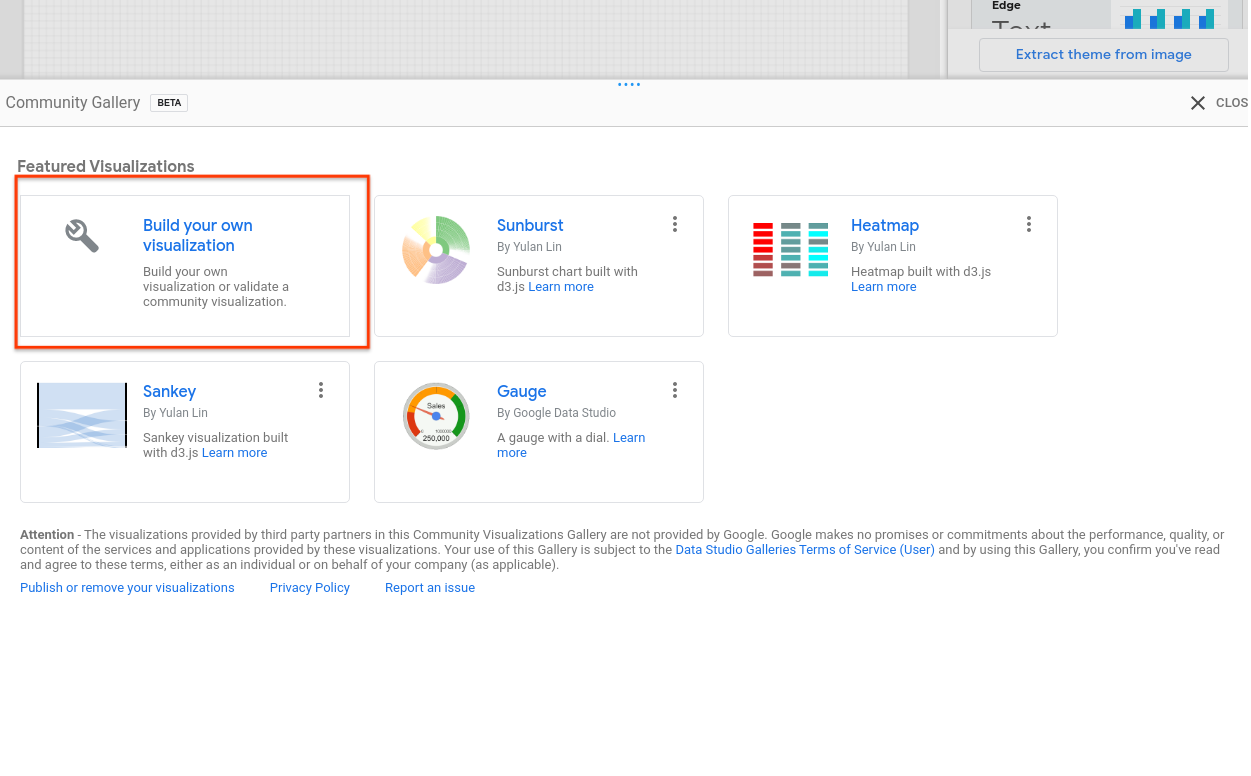
Trong hộp thoại, hãy nhấp vào Khám phá thêm để mở ngăn Thư viện cộng đồng
Nhấp vào Tạo hình ảnh của riêng bạn
Nhập Manifest Path (Đường dẫn tệp kê khai) rồi nhấp vào Submit (Gửi). Một biểu tượng trực quan sẽ được kết xuất cho từng thành phần trong tệp kê khai. Nhấp vào một biểu tượng
hình ảnh để thêm vào báo cáo.
Các bước tiếp theo
Bây giờ, bạn đã viết và triển khai hình ảnh dữ liệu cộng đồng, hãy chia sẻ hình ảnh mà bạn tạo.
[null,null,["Cập nhật lần gần đây nhất: 2025-07-25 UTC."],[[["\u003cp\u003eCommunity Visualization is a Developer Preview feature allowing users to load and utilize custom visualizations in Looker Studio reports.\u003c/p\u003e\n"],["\u003cp\u003eUsers can load their developed community visualizations by providing the manifest file's Google Cloud Storage path.\u003c/p\u003e\n"],["\u003cp\u003eAdding a community visualization involves navigating to the Community Gallery within the report editor and providing the manifest path.\u003c/p\u003e\n"],["\u003cp\u003eEach visualization within the manifest will be represented by an icon which can be clicked and added to the report.\u003c/p\u003e\n"],["\u003cp\u003eAfter development and deployment, users are encouraged to share their community visualizations with others.\u003c/p\u003e\n"]]],[],null,["# Using your visualization\n\n| **Note:** The Community Visualization feature is in \"Developer Preview\". To learn more about upcoming features and improvements during this period visit the [Developer Preview](/looker-studio/visualization/developer-preview) page.\n\nTo load a community visualization you've developed, use the location of the\nmanifest file prefixed by `gs://`.\n\n1. Edit your report\n2. In the toolbar, click **Community visualizations and components**\n3. In the dialog, click **Explore more** to open the Community Gallery shade\n4. Click **Build your own visualization**\n5. Enter your **Manifest Path** and click **Submit**. One visualization icon will be rendered for each component in your manifest. Click a visualization icon to add it to your report.\n\nNext steps\n----------\n\nNow that you have written and deployed a community visualization, [share](/looker-studio/visualization/sharing) the\nvisualizations that you build."]]