आपने जो कम्यूनिटी विज़ुअलाइज़ेशन लोड किया है उसे लोड करने के लिए, gs:// से शुरू की गई
मेनिफ़ेस्ट फ़ाइल की जगह की जानकारी का इस्तेमाल करें.
अपनी रिपोर्ट में बदलाव करना
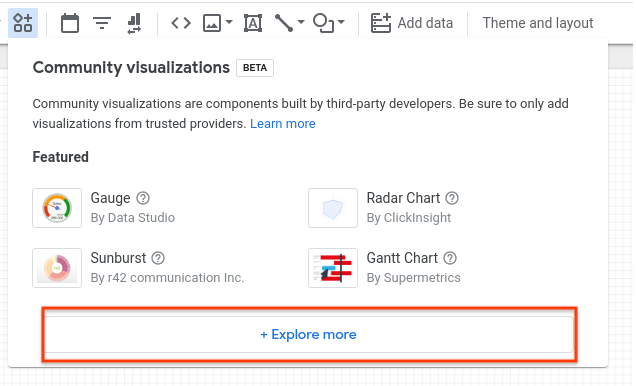
टूलबार में, कम्यूनिटी विज़ुअलाइज़ेशन और कॉम्पोनेंट पर क्लिक करें
डायलॉग में, कम्यूनिटी गैलरी शेड खोलने के लिए ज़्यादा एक्सप्लोर करें पर क्लिक करें
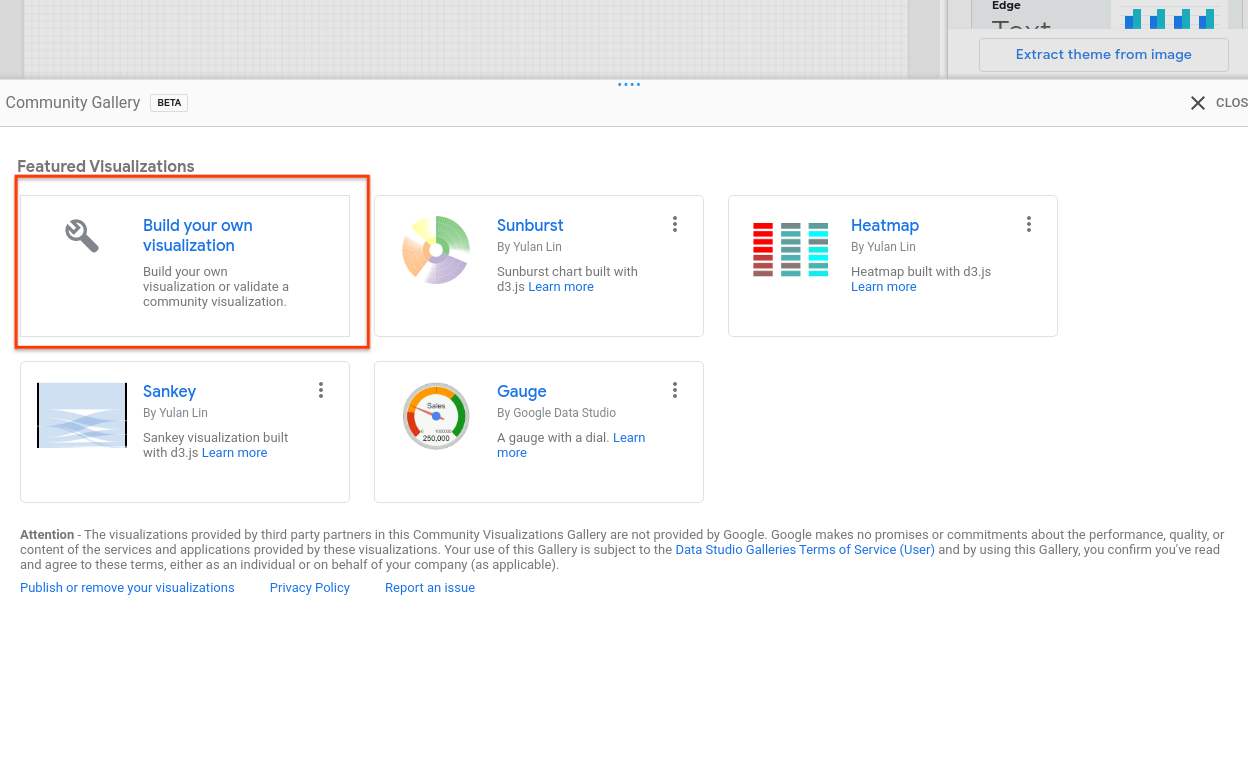
अपना विज़ुअलाइज़ेशन बनाएं पर क्लिक करें
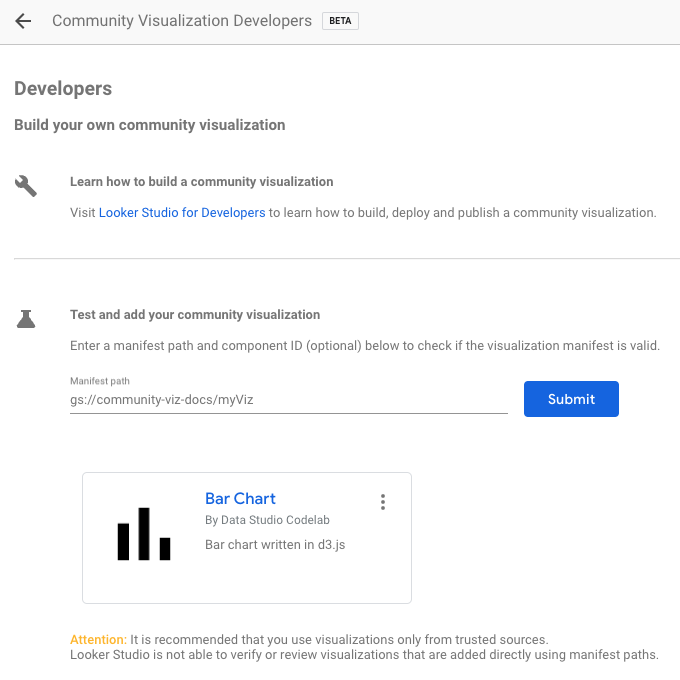
अपना मेनिफ़ेस्ट पाथ डालें और सबमिट करें पर क्लिक करें. आपके मेनिफ़ेस्ट में हर कॉम्पोनेंट के लिए,
एक विज़ुअलाइज़ेशन आइकॉन बनाया जाएगा. किसी विज़ुअलाइज़ेशन आइकॉन पर क्लिक करके
उसे अपनी रिपोर्ट में जोड़ें.
अगले चरण
अब आपने कम्यूनिटी विज़ुअलाइज़ेशन को लिखा और डिप्लॉय कर दिया है, इसलिए अपने बनाए हुए विज़ुअलाइज़ेशन शेयर करें.
[null,null,["आखिरी बार 2023-12-02 (UTC) को अपडेट किया गया."],[[["Community Visualization is a Developer Preview feature allowing users to load and utilize custom visualizations in Looker Studio reports."],["Users can load their developed community visualizations by providing the manifest file's Google Cloud Storage path."],["Adding a community visualization involves navigating to the Community Gallery within the report editor and providing the manifest path."],["Each visualization within the manifest will be represented by an icon which can be clicked and added to the report."],["After development and deployment, users are encouraged to share their community visualizations with others."]]],[]]