Tetap teratur dengan koleksi
Simpan dan kategorikan konten berdasarkan preferensi Anda.
Untuk memuat visualisasi komunitas yang telah Anda kembangkan, gunakan lokasi
file manifes yang diawali dengan gs://.
Edit laporan
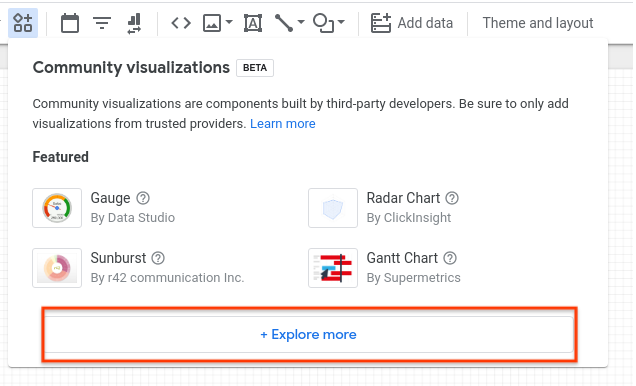
Di toolbar, klik Komponen dan visualisasi komunitas
Pada dialog, klik Jelajahi lainnya untuk membuka menu Galeri Komunitas
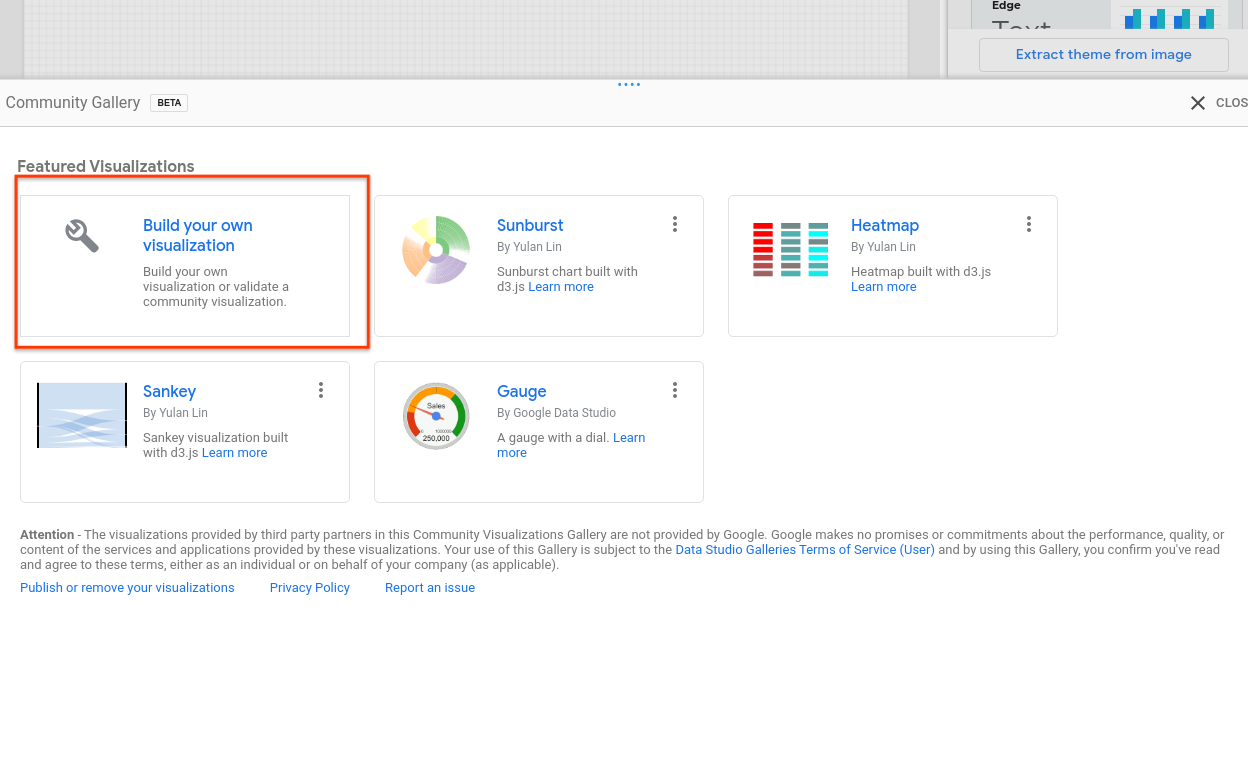
Klik Buat visualisasi Anda sendiri.
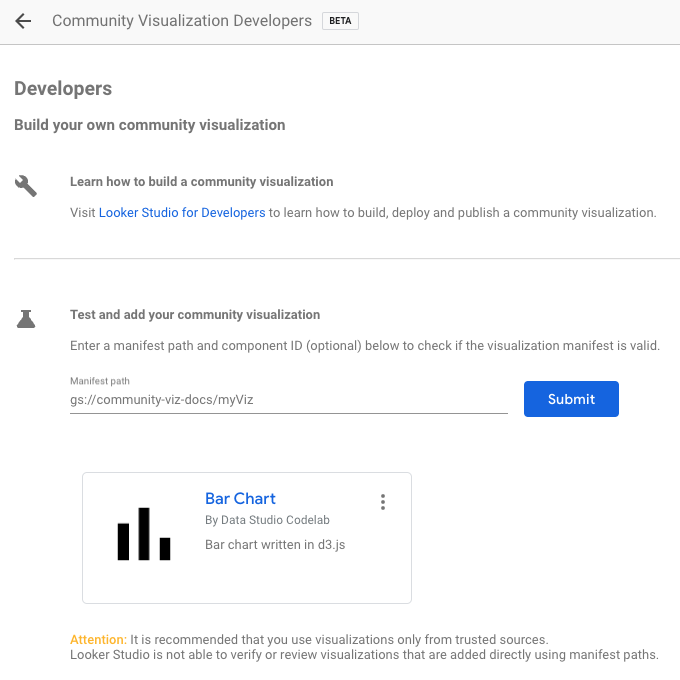
Masukkan Jalur Manifes, lalu klik Kirim. Satu ikon visualisasi
akan dirender untuk setiap komponen dalam manifes Anda. Klik ikon visualisasi untuk
menambahkannya ke laporan Anda.
Langkah berikutnya
Sekarang setelah Anda menulis dan menerapkan visualisasi komunitas, bagikan
visualisasi yang Anda buat.
[null,null,["Terakhir diperbarui pada 2025-07-25 UTC."],[[["\u003cp\u003eCommunity Visualization is a Developer Preview feature allowing users to load and utilize custom visualizations in Looker Studio reports.\u003c/p\u003e\n"],["\u003cp\u003eUsers can load their developed community visualizations by providing the manifest file's Google Cloud Storage path.\u003c/p\u003e\n"],["\u003cp\u003eAdding a community visualization involves navigating to the Community Gallery within the report editor and providing the manifest path.\u003c/p\u003e\n"],["\u003cp\u003eEach visualization within the manifest will be represented by an icon which can be clicked and added to the report.\u003c/p\u003e\n"],["\u003cp\u003eAfter development and deployment, users are encouraged to share their community visualizations with others.\u003c/p\u003e\n"]]],[],null,["# Using your visualization\n\n| **Note:** The Community Visualization feature is in \"Developer Preview\". To learn more about upcoming features and improvements during this period visit the [Developer Preview](/looker-studio/visualization/developer-preview) page.\n\nTo load a community visualization you've developed, use the location of the\nmanifest file prefixed by `gs://`.\n\n1. Edit your report\n2. In the toolbar, click **Community visualizations and components**\n3. In the dialog, click **Explore more** to open the Community Gallery shade\n4. Click **Build your own visualization**\n5. Enter your **Manifest Path** and click **Submit**. One visualization icon will be rendered for each component in your manifest. Click a visualization icon to add it to your report.\n\nNext steps\n----------\n\nNow that you have written and deployed a community visualization, [share](/looker-studio/visualization/sharing) the\nvisualizations that you build."]]