Zadbaj o dobrą organizację dzięki kolekcji
Zapisuj i kategoryzuj treści zgodnie ze swoimi preferencjami.
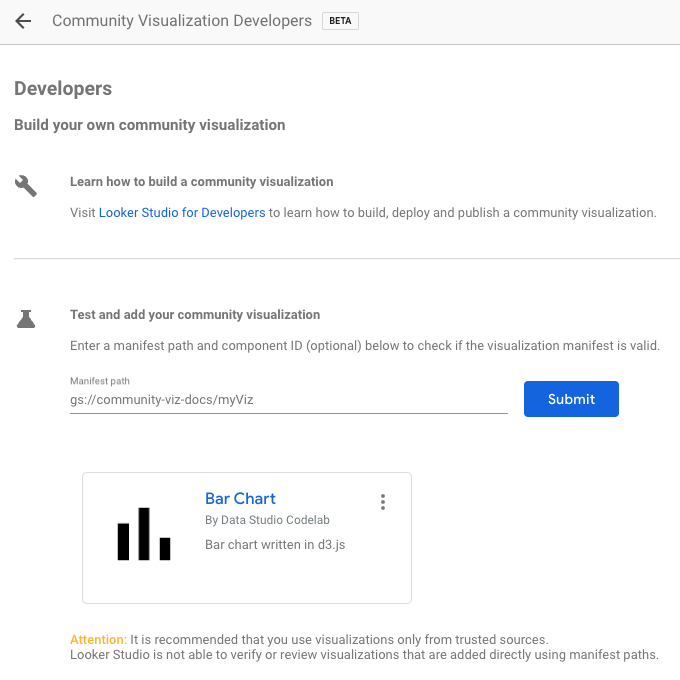
Aby wczytać opracowaną przez siebie wizualizację utworzoną przez społeczność, użyj lokalizacji pliku manifestu (przedrostek gs://).
Edytowanie raportu.
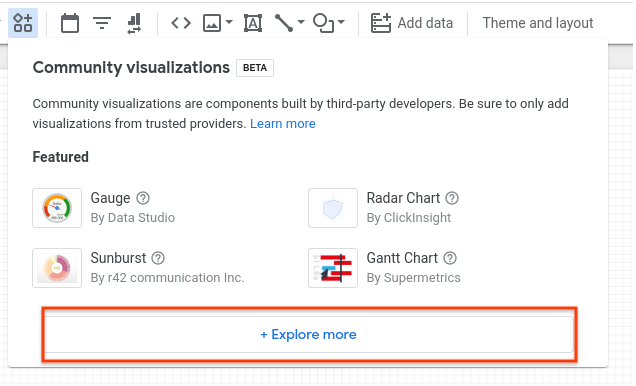
Na pasku narzędzi kliknij Wizualizacje i komponenty utworzone przez społeczność.
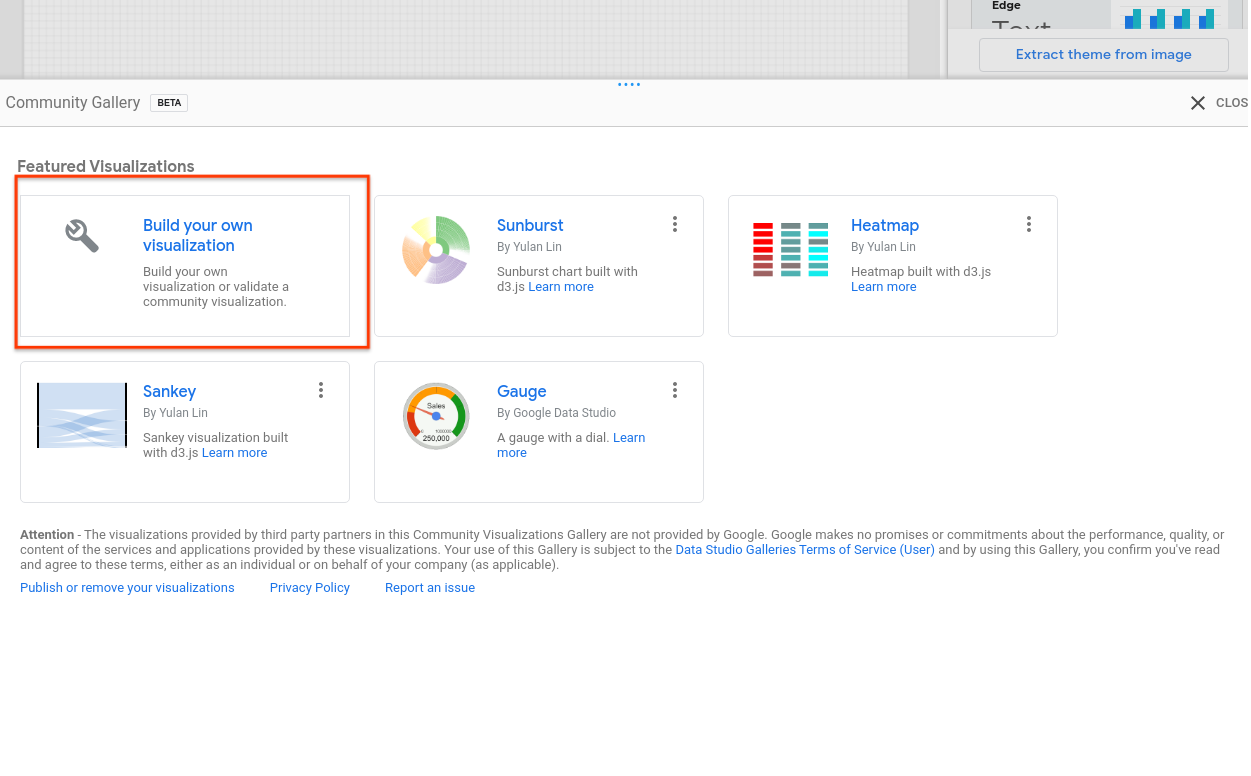
W oknie kliknij Przeglądaj więcej, aby otworzyć obszar Galerii społeczności.
Kliknij Utwórz własną wizualizację.
Wpisz ścieżkę pliku manifestu i kliknij Prześlij. Dla każdego komponentu w pliku manifestu zostanie wyrenderowana jedna ikona. Aby dodać ją do raportu,
kliknij ikonę wizualizacji.
Dalsze kroki
Po napisaniu i wdrożeniu wizualizacji utworzonej przez społeczność możesz udostępnić utworzone wizualizacje.
[null,null,["Ostatnia aktualizacja: 2025-07-25 UTC."],[[["\u003cp\u003eCommunity Visualization is a Developer Preview feature allowing users to load and utilize custom visualizations in Looker Studio reports.\u003c/p\u003e\n"],["\u003cp\u003eUsers can load their developed community visualizations by providing the manifest file's Google Cloud Storage path.\u003c/p\u003e\n"],["\u003cp\u003eAdding a community visualization involves navigating to the Community Gallery within the report editor and providing the manifest path.\u003c/p\u003e\n"],["\u003cp\u003eEach visualization within the manifest will be represented by an icon which can be clicked and added to the report.\u003c/p\u003e\n"],["\u003cp\u003eAfter development and deployment, users are encouraged to share their community visualizations with others.\u003c/p\u003e\n"]]],[],null,["# Using your visualization\n\n| **Note:** The Community Visualization feature is in \"Developer Preview\". To learn more about upcoming features and improvements during this period visit the [Developer Preview](/looker-studio/visualization/developer-preview) page.\n\nTo load a community visualization you've developed, use the location of the\nmanifest file prefixed by `gs://`.\n\n1. Edit your report\n2. In the toolbar, click **Community visualizations and components**\n3. In the dialog, click **Explore more** to open the Community Gallery shade\n4. Click **Build your own visualization**\n5. Enter your **Manifest Path** and click **Submit**. One visualization icon will be rendered for each component in your manifest. Click a visualization icon to add it to your report.\n\nNext steps\n----------\n\nNow that you have written and deployed a community visualization, [share](/looker-studio/visualization/sharing) the\nvisualizations that you build."]]