This page contains ML Fundamentals glossary terms. For all glossary terms,
[click here](https://developers.google.com/machine-learning/glossary).
## A
## accuracy
#fundamentals #Metric
The number of correct classification [**predictions**](https://developers.google.com/machine-learning/glossary/fundamentals#prediction) divided
by the total number of predictions. That is:
$$\\text{Accuracy} = \\frac{\\text{correct predictions}} {\\text{correct predictions + incorrect predictions }}$$
For example, a model that made 40 correct predictions and 10 incorrect
predictions would have an accuracy of:
$$\\text{Accuracy} = \\frac{\\text{40}} {\\text{40 + 10}} = \\text{80%}$$
[**Binary classification**](https://developers.google.com/machine-learning/glossary/fundamentals#binary_classification) provides specific names
for the different categories of *correct predictions* and
*incorrect predictions*. So, the accuracy formula for binary classification
is as follows:
$$\\text{Accuracy} = \\frac{\\text{TP} + \\text{TN}} {\\text{TP} + \\text{TN} + \\text{FP} + \\text{FN}}$$
where:
- TP is the number of [**true positives**](https://developers.google.com/machine-learning/glossary/fundamentals#TP) (correct predictions).
- TN is the number of [**true negatives**](https://developers.google.com/machine-learning/glossary/fundamentals#TN) (correct predictions).
- FP is the number of [**false positives**](https://developers.google.com/machine-learning/glossary/fundamentals#FP) (incorrect predictions).
- FN is the number of [**false negatives**](https://developers.google.com/machine-learning/glossary/fundamentals#FN) (incorrect predictions).
Compare and contrast accuracy with
[**precision**](https://developers.google.com/machine-learning/glossary/fundamentals#precision) and
[**recall**](https://developers.google.com/machine-learning/glossary/fundamentals#recall).
#### Click the icon for details about accuracy and class-imbalanced datasets.
Although a valuable metric for some situations, accuracy is highly
misleading for others. Notably, accuracy is usually a poor metric
for evaluating classification models that process
[**class-imbalanced datasets**](https://developers.google.com/machine-learning/glossary/fundamentals#class_imbalanced_data_set).
For example, suppose snow falls only 25 days per century in a certain
subtropical city. Since days without snow (the negative class) vastly
outnumber days with snow (the positive class), the snow dataset for
this city is class-imbalanced.
Imagine a [**binary classification**](https://developers.google.com/machine-learning/glossary/fundamentals#binary-classification)
model that is supposed to predict either snow or no snow each day but
simply predicts "no snow" every day.
This model is highly accurate but has no predictive power.
The following table summarizes the results for a century of predictions:
| Category | Number |
|---|---|
| TP | 0 |
| TN | 36499 |
| FP | 0 |
| FN | 25 |
The accuracy of this model is therefore:
```
accuracy = (TP + TN) / (TP + TN + FP + FN)
accuracy = (0 + 36499) / (0 + 36499 + 0 + 25) = 0.9993 = 99.93%
```
Although 99.93% accuracy seems like a very impressive percentage, the model
actually has no predictive power.
[**Precision**](https://developers.google.com/machine-learning/glossary/fundamentals#precision) and
[**recall**](https://developers.google.com/machine-learning/glossary/fundamentals#recall) are usually more useful metrics
than **accuracy** for evaluating models trained on class-imbalanced datasets.
*** ** * ** ***
See [Classification: Accuracy, recall, precision and related
metrics](https://developers.google.com/machine-learning/crash-course/classification/accuracy-precision-recall)
in Machine Learning Crash Course for more information.
## activation function
#fundamentals
A function that enables [**neural networks**](https://developers.google.com/machine-learning/glossary/fundamentals#neural_network) to learn
[**nonlinear**](https://developers.google.com/machine-learning/glossary/fundamentals#nonlinear) (complex) relationships between features
and the label.
Popular activation functions include:
- [**ReLU**](https://developers.google.com/machine-learning/glossary/fundamentals#ReLU)
- [**Sigmoid**](https://developers.google.com/machine-learning/glossary/fundamentals#sigmoid-function)
The plots of activation functions are never single straight lines.
For example, the plot of the ReLU activation function consists of
two straight lines:

A plot of the sigmoid activation function looks as follows:

#### Click the icon to see an example.
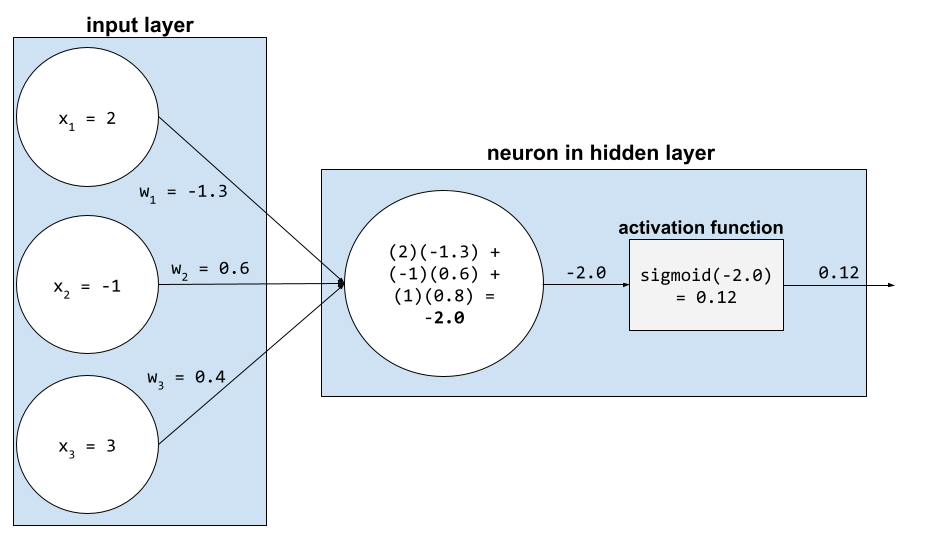
In a neural network, activation functions manipulate the
[weighted sum](https://developers.google.com/machine-learning/glossary/fundamentals#weighted_sum) of all the inputs to a
[neuron](https://developers.google.com/machine-learning/glossary/fundamentals#neuron). To calculate a weighted sum, the neuron adds up
the products of the relevant values and weights. For example, suppose the
relevant input to a neuron consists of the following:
|---|---|
| input value | input weight |
| 2 | -1.3 |
| -1 | 0.6 |
| 3 | 0.4 |
The weighted sum is therefore:
```
weighted sum = (2)(-1.3) + (-1)(0.6) + (3)(0.4) = -2.0
```
Suppose the designer of this neural network chooses the [**sigmoid function**](https://developers.google.com/machine-learning/glossary/fundamentals#sigmoid-function) to be the activation function. In that case, the neuron calculates the sigmoid of -2.0, which is approximately 0.12. Therefore, the neuron passes 0.12 (rather than -2.0) to the next layer in the neural network. The following figure illustrates the relevant part of the process:
*** ** * ** ***
See [Neural networks: Activation
functions](https://developers.google.com/machine-learning/crash-course/neural-networks/activation-functions)
in Machine Learning Crash Course for more information.
## artificial intelligence
#fundamentals
A non-human program or [**model**](https://developers.google.com/machine-learning/glossary/fundamentals#model) that can solve sophisticated tasks.
For example, a program or model that translates text or a program or model that
identifies diseases from radiologic images both exhibit artificial intelligence.
Formally, [**machine learning**](https://developers.google.com/machine-learning/glossary/fundamentals#machine_learning) is a sub-field of artificial
intelligence. However, in recent years, some organizations have begun using the
terms *artificial intelligence* and *machine learning* interchangeably.
## AUC (Area under the ROC curve)
#fundamentals #Metric
A number between 0.0 and 1.0 representing a
[**binary classification**](https://developers.google.com/machine-learning/glossary/fundamentals#binary-classification) model's
ability to separate [**positive classes**](https://developers.google.com/machine-learning/glossary/fundamentals#positive_class) from
[**negative classes**](https://developers.google.com/machine-learning/glossary/fundamentals#negative_class).
The closer the AUC is to 1.0, the better the model's ability to separate
classes from each other.
For example, the following illustration shows a
[**classification model**](https://developers.google.com/machine-learning/glossary/fundamentals#classification-model) that separates positive
classes (green ovals) from negative classes (purple rectangles) perfectly.
This unrealistically perfect model has an AUC of 1.0:

Conversely, the following illustration shows the results for a
[**classification model**](https://developers.google.com/machine-learning/glossary/fundamentals#classification-model) that generated random
results. This model has an AUC of 0.5:

Yes, the preceding model has an AUC of 0.5, not 0.0.
Most models are somewhere between the two extremes. For instance, the
following model separates positives from negatives somewhat, and therefore
has an AUC somewhere between 0.5 and 1.0:

AUC ignores any value you set for
[**classification threshold**](https://developers.google.com/machine-learning/glossary/fundamentals#classification-threshold). Instead, AUC
considers *all* possible classification thresholds.
#### Click the icon to learn about the relationship between AUC and ROC curves.
AUC represents the *area* under an
[**ROC curve**](https://developers.google.com/machine-learning/glossary/fundamentals#ROC).
For example,
the ROC curve for a model that perfectly separates positives from
negatives looks as follows:
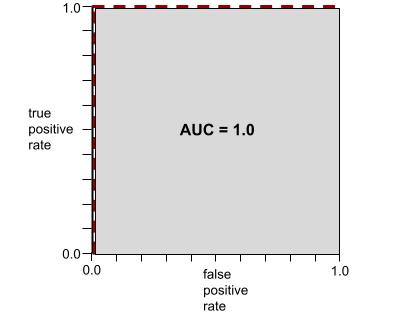
AUC is the area of the gray region in the preceding illustration.
In this unusual case, the area is simply the length of the gray region
(1.0) multiplied by the width of the gray region (1.0). So, the product
of 1.0 and 1.0 yields an AUC of exactly 1.0, which is the highest possible
AUC score.
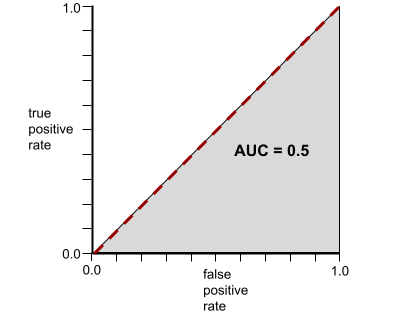
Conversely, the ROC curve for a
[**classification model**](https://developers.google.com/machine-learning/glossary/fundamentals#classification-model) that can't
separate classes at all is as follows. The area of this gray region is 0.5.
A more typical ROC curve looks approximately like the following:
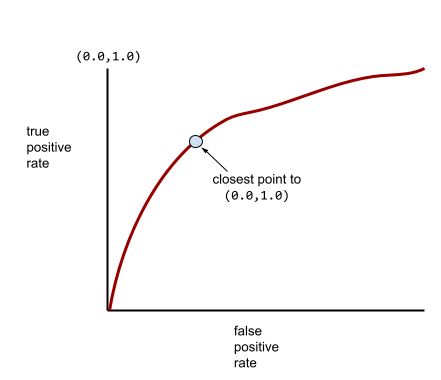
It would be painstaking to calculate the area under this curve manually,
which is why a program typically calculates most AUC values.
*** ** * ** ***
#### Click the icon for a more formal definition of AUC.
AUC is the probability that a
[**classification model**](https://developers.google.com/machine-learning/glossary/fundamentals#classification-model) will be more
confident that a randomly chosen positive example is actually positive than
that a randomly chosen negative example is positive.
*** ** * ** ***
See [Classification: ROC and
AUC](https://developers.google.com/machine-learning/crash-course/classification/roc-and-auc)
in Machine Learning Crash Course for more information.
## B
## backpropagation
#fundamentals
The algorithm that implements
[**gradient descent**](https://developers.google.com/machine-learning/glossary/fundamentals#gradient_descent) in
[**neural networks**](https://developers.google.com/machine-learning/glossary/fundamentals#neural_network).
Training a neural network involves many [**iterations**](https://developers.google.com/machine-learning/glossary/fundamentals#iteration)
of the following two-pass cycle:
1. During the **forward pass** , the system processes a [**batch**](https://developers.google.com/machine-learning/glossary/fundamentals#batch) of [**examples**](https://developers.google.com/machine-learning/glossary/fundamentals#example) to yield prediction(s). The system compares each prediction to each [**label**](https://developers.google.com/machine-learning/glossary/fundamentals#label) value. The difference between the prediction and the label value is the [**loss**](https://developers.google.com/machine-learning/glossary/fundamentals#loss) for that example. The system aggregates the losses for all the examples to compute the total loss for the current batch.
2. During the **backward pass** (backpropagation), the system reduces loss by adjusting the weights of all the [**neurons**](https://developers.google.com/machine-learning/glossary/fundamentals#neuron) in all the [**hidden layer(s)**](https://developers.google.com/machine-learning/glossary/fundamentals#hidden_layer).
Neural networks often contain many neurons across many hidden layers.
Each of those neurons contribute to the overall loss in different ways.
Backpropagation determines whether to increase or decrease the weights
applied to particular neurons.
The [**learning rate**](https://developers.google.com/machine-learning/glossary/fundamentals#learning_rate) is a multiplier that controls the
degree to which each backward pass increases or decreases each weight.
A large learning rate will increase or decrease each weight more than a
small learning rate.
In calculus terms, backpropagation implements the
[**chain rule**](https://www.khanacademy.org/math/ap-calculus-ab/ab-differentiation-2-new/ab-3-1a/v/chain-rule-introduction).
from calculus. That is, backpropagation calculates the
[**partial derivative**](https://developers.google.com/machine-learning/glossary#partial_derivative) of the error with
respect to each parameter.
Years ago, ML practitioners had to write code to implement backpropagation.
Modern ML APIs like Keras now implement backpropagation for you. Phew!
See [Neural networks](https://developers.google.com/machine-learning/crash-course/neural-networks)
in Machine Learning Crash Course for more information.
## batch
#fundamentals
The set of [**examples**](https://developers.google.com/machine-learning/glossary/fundamentals#example) used in one training
[**iteration**](https://developers.google.com/machine-learning/glossary/fundamentals#iteration).
The [**batch size**](https://developers.google.com/machine-learning/glossary/fundamentals#batch_size) determines the number of examples in a
batch.
See [**epoch**](https://developers.google.com/machine-learning/glossary/fundamentals#epoch) for an explanation of how a batch relates to
an epoch.
See [Linear regression:
Hyperparameters](https://developers.google.com/machine-learning/crash-course/linear-regression/hyperparameters)
in Machine Learning Crash Course for more information.
## batch size
#fundamentals
The number of [**examples**](https://developers.google.com/machine-learning/glossary/fundamentals#example) in a [**batch**](https://developers.google.com/machine-learning/glossary/fundamentals#batch).
For instance, if the batch size is 100, then the model processes
100 examples per [**iteration**](https://developers.google.com/machine-learning/glossary/fundamentals#iteration).
The following are popular batch size strategies:
- [**Stochastic Gradient Descent (SGD)**](https://developers.google.com/machine-learning/glossary/fundamentals#SGD), in which the batch size is 1.
- Full batch, in which the batch size is the number of examples in the entire [**training set**](https://developers.google.com/machine-learning/glossary/fundamentals#training_set). For instance, if the training set contains a million examples, then the batch size would be a million examples. Full batch is usually an inefficient strategy.
- [**mini-batch**](https://developers.google.com/machine-learning/glossary/fundamentals#mini-batch) in which the batch size is usually between 10 and 1000. Mini-batch is usually the most efficient strategy.
See the following for more information:
- [Production ML systems: Static versus dynamic
inference](https://developers.google.com/machine-learning/crash-course/production-ml-systems/static-vs-dynamic-inference) in Machine Learning Crash Course.
- [Deep Learning Tuning
Playbook](https://developers.google.com/machine-learning/guides/deep-learning-tuning-playbook).
## bias (ethics/fairness)
#responsible #fundamentals
1. Stereotyping, prejudice or favoritism towards some things, people,
or groups over others. These biases can affect collection and
interpretation of data, the design of a system, and how users interact
with a system. Forms of this type of bias include:
- [**automation bias**](https://developers.google.com/machine-learning/glossary#automation_bias)
- [**confirmation bias**](https://developers.google.com/machine-learning/glossary#confirmation_bias)
- [**experimenter's bias**](https://developers.google.com/machine-learning/glossary#confirmation_bias)
- [**group attribution bias**](https://developers.google.com/machine-learning/glossary#group_attribution_bias)
- [**implicit bias**](https://developers.google.com/machine-learning/glossary#implicit_bias)
- [**in-group bias**](https://developers.google.com/machine-learning/glossary#in-group_bias)
- [**out-group homogeneity bias**](https://developers.google.com/machine-learning/glossary#out-group_homogeneity_bias)
2. Systematic error introduced by a sampling or reporting procedure.
Forms of this type of bias include:
- [**coverage bias**](https://developers.google.com/machine-learning/glossary#selection_bias)
- [**non-response bias**](https://developers.google.com/machine-learning/glossary#selection_bias)
- [**participation bias**](https://developers.google.com/machine-learning/glossary#participation_bias)
- [**reporting bias**](https://developers.google.com/machine-learning/glossary#reporting_bias)
- [**sampling bias**](https://developers.google.com/machine-learning/glossary#selection_bias)
- [**selection bias**](https://developers.google.com/machine-learning/glossary#selection_bias)
Not to be confused with the [**bias term**](https://developers.google.com/machine-learning/glossary/fundamentals#bias) in machine learning models
or [**prediction bias**](https://developers.google.com/machine-learning/glossary#prediction_bias).
See [Fairness: Types of
bias](https://developers.google.com/machine-learning/crash-course/fairness/types-of-bias) in
Machine Learning Crash Course for more information.
## bias (math) or bias term
#fundamentals
An intercept or offset from an origin. Bias is a parameter in
machine learning models, which is symbolized by either of the
following:
- *b*
- *w~0~*
For example, bias is the *b* in the following formula:
$$y' = b + w_1x_1 + w_2x_2 + ... w_nx_n$$
In a simple two-dimensional line, bias just means "y-intercept."
For example, the bias of the line in the following illustration is 2.
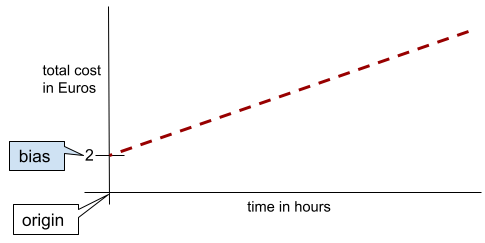
Bias exists because not all models start from the origin (0,0). For example,
suppose an amusement park costs 2 Euros to enter and an additional
0.5 Euro for every hour a customer stays. Therefore, a model mapping the
total cost has a bias of 2 because the lowest cost is 2 Euros.
Bias is not to be confused with [**bias in ethics and fairness**](https://developers.google.com/machine-learning/glossary/fundamentals#bias_ethics)
or [**prediction bias**](https://developers.google.com/machine-learning/glossary#prediction_bias).
See [Linear Regression](https://developers.google.com/machine-learning/crash-course/linear-regression)
in Machine Learning Crash Course for more information.
## binary classification
#fundamentals
A type of [**classification**](https://developers.google.com/machine-learning/glossary/fundamentals#classification_model) task that
predicts one of two mutually exclusive classes:
- the [**positive class**](https://developers.google.com/machine-learning/glossary/fundamentals#positive_class)
- the [**negative class**](https://developers.google.com/machine-learning/glossary/fundamentals#negative_class)
For example, the following two machine learning models each perform
binary classification:
- A model that determines whether email messages are *spam* (the positive class) or *not spam* (the negative class).
- A model that evaluates medical symptoms to determine whether a person has a particular disease (the positive class) or doesn't have that disease (the negative class).
Contrast with [**multi-class classification**](https://developers.google.com/machine-learning/glossary/fundamentals#multi-class).
See also [**logistic regression**](https://developers.google.com/machine-learning/glossary/fundamentals#logistic_regression) and
[**classification threshold**](https://developers.google.com/machine-learning/glossary/fundamentals#classification-threshold).
See [Classification](https://developers.google.com/machine-learning/crash-course/classification)
in Machine Learning Crash Course for more information.
## bucketing
#fundamentals
Converting a single [**feature**](https://developers.google.com/machine-learning/glossary/fundamentals#feature) into multiple binary features
called **buckets** or **bins** ,
typically based on a value range. The chopped feature is typically a
[**continuous feature**](https://developers.google.com/machine-learning/glossary/fundamentals#continuous_feature).
For example, instead of representing temperature as a single
continuous floating-point feature, you could chop ranges of temperatures
into discrete buckets, such as:
- \<= 10 degrees Celsius would be the "cold" bucket.
- 11 - 24 degrees Celsius would be the "temperate" bucket.
- \>= 25 degrees Celsius would be the "warm" bucket.
The model will treat every value in the same bucket identically. For
example, the values `13` and `22` are both in the temperate bucket, so the
model treats the two values identically.
#### Click the icon for additional notes.
If you represent temperature as a continuous feature, then the model
treats temperature as a single feature. If you represent temperature
as three buckets, then the model treats each bucket as a separate feature.
That is, a model can learn separate relationships of each bucket to the
[**label**](https://developers.google.com/machine-learning/glossary/fundamentals#label). For example, a
[**linear regression**](https://developers.google.com/machine-learning/glossary/fundamentals#linear_regression) model can learn
separate [**weights**](https://developers.google.com/machine-learning/glossary/fundamentals#weight) for each bucket.
Increasing the number of buckets makes your model more complicated by
increasing the number of relationships that your model must learn.
For example, the cold, temperate, and warm buckets are essentially
three separate features for your model to train on. If you decide to add
two more buckets--for example, freezing and hot--your model would
now have to train on five separate features.
How do you know how many buckets to create, or what the ranges for each
bucket should be? The answers typically require a fair amount of
experimentation.
*** ** * ** ***
See [Numerical data:
Binning](https://developers.google.com/machine-learning/crash-course/numerical-data/binning)
in Machine Learning Crash Course for more information.
## C
## categorical data
#fundamentals
[**Features**](https://developers.google.com/machine-learning/glossary/fundamentals#feature) having a specific set of possible values. For example,
consider a categorical feature named `traffic-light-state`, which can only
have one of the following three possible values:
- `red`
- `yellow`
- `green`
By representing `traffic-light-state` as a categorical feature,
a model can learn the
differing impacts of `red`, `green`, and `yellow` on driver behavior.
Categorical features are sometimes called
[**discrete features**](https://developers.google.com/machine-learning/glossary/fundamentals#discrete_feature).
Contrast with [**numerical data**](https://developers.google.com/machine-learning/glossary/fundamentals#numerical_data).
See [Working with categorical
data](https://developers.google.com/machine-learning/crash-course/categorical-data)
in Machine Learning Crash Course for more information.
## class
#fundamentals
A category that a [**label**](https://developers.google.com/machine-learning/glossary/fundamentals#label) can belong to.
For example:
- In a [**binary classification**](https://developers.google.com/machine-learning/glossary/fundamentals#binary_classification) model that detects spam, the two classes might be *spam* and *not spam*.
- In a [**multi-class classification**](https://developers.google.com/machine-learning/glossary/fundamentals#multi-class) model that identifies dog breeds, the classes might be *poodle* , *beagle* , *pug*, and so on.
A [**classification model**](https://developers.google.com/machine-learning/glossary/fundamentals#classification_model) predicts a class.
In contrast, a [**regression model**](https://developers.google.com/machine-learning/glossary/fundamentals#regression_model) predicts a number
rather than a class.
See [Classification](https://developers.google.com/machine-learning/crash-course/classification)
in Machine Learning Crash Course for more information.
## classification model
#fundamentals
A [**model**](https://developers.google.com/machine-learning/glossary/fundamentals#model) whose prediction is a [**class**](https://developers.google.com/machine-learning/glossary/fundamentals#class).
For example, the following are all classification models:
- A model that predicts an input sentence's language (French? Spanish? Italian?).
- A model that predicts tree species (Maple? Oak? Baobab?).
- A model that predicts the positive or negative class for a particular medical condition.
In contrast, [**regression models**](https://developers.google.com/machine-learning/glossary/fundamentals#regression_model) predict numbers
rather than classes.
Two common types of classification models are:
- [**binary classification**](https://developers.google.com/machine-learning/glossary/fundamentals#binary-classification)
- [**multi-class classification**](https://developers.google.com/machine-learning/glossary/fundamentals#multi-class)
## classification threshold
#fundamentals
In a [**binary classification**](https://developers.google.com/machine-learning/glossary/fundamentals#binary-classification), a
number between 0 and 1 that converts the raw output of a
[**logistic regression**](https://developers.google.com/machine-learning/glossary/fundamentals#logistic_regression) model
into a prediction of either the [**positive class**](https://developers.google.com/machine-learning/glossary/fundamentals#positive_class)
or the [**negative class**](https://developers.google.com/machine-learning/glossary/fundamentals#negative_class).
Note that the classification threshold is a value that a human chooses,
not a value chosen by model training.
A logistic regression model outputs a raw value between 0 and 1. Then:
- If this raw value is *greater than* the classification threshold, then the positive class is predicted.
- If this raw value is *less than* the classification threshold, then the negative class is predicted.
For example, suppose the classification threshold is 0.8. If the raw value
is 0.9, then the model predicts the positive class. If the raw value is
0.7, then the model predicts the negative class.
The choice of classification threshold strongly influences the number of
[**false positives**](https://developers.google.com/machine-learning/glossary/fundamentals#FP) and
[**false negatives**](https://developers.google.com/machine-learning/glossary/fundamentals#FN).
#### Click the icon for additional notes.
As models or datasets evolve, engineers sometimes also change the
classification threshold. When the classification threshold changes,
positive class predictions can suddenly become negative classes
and vice-versa.
For example, consider a binary classification disease prediction model.
Suppose that when the system runs in the first year:
- The raw value for a particular patient is 0.95.
- The classification threshold is 0.94.
Therefore, the system diagnoses the positive class. (The patient gasps,
"Oh no! I'm sick!")
A year later, perhaps the values now look as follows:
- The raw value for the same patient remains at 0.95.
- The classification threshold changes to 0.97.
Therefore, the system now reclassifies that patient as the negative class.
("Happy day! I'm not sick.") Same patient. Different diagnosis.
*** ** * ** ***
See [Thresholds and the confusion
matrix](https://developers.google.com/machine-learning/crash-course/classification/thresholding)
in Machine Learning Crash Course for more information.
## classifier
#fundamentals
A casual term for a [**classification model**](https://developers.google.com/machine-learning/glossary/fundamentals#classification_model).
## class-imbalanced dataset
#fundamentals
A [**dataset**](https://developers.google.com/machine-learning/glossary/fundamentals#dataset) for a [**classification**](https://developers.google.com/machine-learning/glossary/fundamentals#classification-model)
in which the total number of [**labels**](https://developers.google.com/machine-learning/glossary/fundamentals#label) of each [**class**](https://developers.google.com/machine-learning/glossary/fundamentals#class)
differs significantly. For example, consider a
[**binary classification**](https://developers.google.com/machine-learning/glossary/fundamentals#binary-classification) dataset whose two labels
are divided as follows:
- 1,000,000 negative labels
- 10 positive labels
The ratio of negative to positive labels is 100,000 to 1, so this
is a class-imbalanced dataset.
In contrast, the following dataset is
[**class-balanced**](https://developers.google.com/machine-learning/glossary#class-balanced-dataset) because the ratio of negative
labels to positive labels is relatively close to 1:
- 517 negative labels
- 483 positive labels
Multi-class datasets can also be class-imbalanced. For example, the following
multi-class classification dataset is also class-imbalanced because one label
has far more examples than the other two:
- 1,000,000 labels with class "green"
- 200 labels with class "purple"
- 350 labels with class "orange"
Training class-imbalanced datasets can present special challenges. See
[Imbalanced datasets](https://developers.google.com/machine-learning/crash-course/overfitting/imbalanced-datasets)
in Machine Learning Crash Course for details.
See also [**entropy**](https://developers.google.com/machine-learning/glossary#entropy), [**majority class**](https://developers.google.com/machine-learning/glossary/fundamentals#majority_class),
and [**minority class**](https://developers.google.com/machine-learning/glossary/fundamentals#minority_class).
## clipping
#fundamentals
A technique for handling [**outliers**](https://developers.google.com/machine-learning/glossary#outliers) by doing
either or both of the following:
- Reducing [**feature**](https://developers.google.com/machine-learning/glossary/fundamentals#feature) values that are greater than a maximum threshold down to that maximum threshold.
- Increasing feature values that are less than a minimum threshold up to that minimum threshold.
For example, suppose that \<0.5% of values for a particular feature fall
outside the range 40--60. In this case, you could do the following:
- Clip all values over 60 (the maximum threshold) to be exactly 60.
- Clip all values under 40 (the minimum threshold) to be exactly 40.
Outliers can damage models, sometimes causing [**weights**](https://developers.google.com/machine-learning/glossary/fundamentals#weight)
to overflow during training. Some outliers can also dramatically spoil
metrics like [**accuracy**](https://developers.google.com/machine-learning/glossary/fundamentals#accuracy). Clipping is a common technique to limit
the damage.
[**Gradient clipping**](https://developers.google.com/machine-learning/glossary#gradient_clipping) forces
[**gradient**](https://developers.google.com/machine-learning/glossary#gradient) values within a designated range during training.
See [Numerical data:
Normalization](https://developers.google.com/machine-learning/crash-course/numerical-data/normalization)
in Machine Learning Crash Course for more information.
## confusion matrix
#fundamentals
An NxN table that summarizes the number of correct and incorrect predictions
that a [**classification model**](https://developers.google.com/machine-learning/glossary/fundamentals#classification_model) made.
For example, consider the following confusion matrix for a
[**binary classification**](https://developers.google.com/machine-learning/glossary/fundamentals#binary_classification) model:
| | Tumor (predicted) | Non-Tumor (predicted) |
|---|---|---|
| Tumor (ground truth) | 18 (TP) | 1 (FN) |
| Non-Tumor (ground truth) | 6 (FP) | 452 (TN) |
The preceding confusion matrix shows the following:
- Of the 19 predictions in which [**ground truth**](https://developers.google.com/machine-learning/glossary/fundamentals#ground_truth) was Tumor, the model correctly classified 18 and incorrectly classified 1.
- Of the 458 predictions in which ground truth was Non-Tumor, the model correctly classified 452 and incorrectly classified 6.
The confusion matrix for a [**multi-class classification**](https://developers.google.com/machine-learning/glossary/fundamentals#multi-class)
problem can help you identify patterns of mistakes.
For example, consider the following confusion matrix for a 3-class
multi-class classification model that categorizes three different iris types
(Virginica, Versicolor, and Setosa). When the ground truth was Virginica, the
confusion matrix shows that the model was far more likely to mistakenly
predict Versicolor than Setosa:
| | Setosa (predicted) | Versicolor (predicted) | Virginica (predicted) |
|---|---|---|---|
| Setosa (ground truth) | 88 | 12 | 0 |
| Versicolor (ground truth) | 6 | 141 | 7 |
| Virginica (ground truth) | 2 | 27 | 109 |
As yet another example, a confusion matrix could reveal that a model trained
to recognize handwritten digits tends to mistakenly predict 9 instead of 4,
or mistakenly predict 1 instead of 7.
Confusion matrixes contain sufficient information to calculate a
variety of performance metrics, including [**precision**](https://developers.google.com/machine-learning/glossary/fundamentals#precision)
and [**recall**](https://developers.google.com/machine-learning/glossary/fundamentals#recall).
## continuous feature
#fundamentals
A floating-point [**feature**](https://developers.google.com/machine-learning/glossary/fundamentals#feature) with an infinite range of possible
values, such as temperature or weight.
Contrast with [**discrete feature**](https://developers.google.com/machine-learning/glossary/fundamentals#discrete_feature).
## convergence
#fundamentals
A state reached when [**loss**](https://developers.google.com/machine-learning/glossary/fundamentals#loss) values change very little or
not at all with each [**iteration**](https://developers.google.com/machine-learning/glossary/fundamentals#iteration). For example, the following
[**loss curve**](https://developers.google.com/machine-learning/glossary/fundamentals#loss_curve) suggests convergence at around 700 iterations:
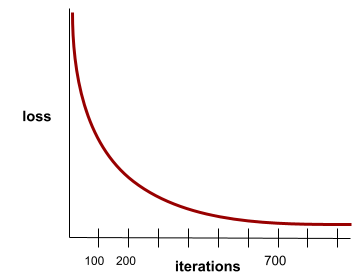
A model **converges** when additional training won't
improve the model.
In [**deep learning**](https://developers.google.com/machine-learning/glossary/fundamentals#deep_model), loss values sometimes stay constant or
nearly so for many iterations before finally descending. During a long period
of constant loss values, you may temporarily get a false sense of convergence.
See also [**early stopping**](https://developers.google.com/machine-learning/glossary/fundamentals#early_stopping).
See [Model convergence and loss
curves](https://developers.google.com/machine-learning/crash-course/linear-regression/gradient-descent#model_convergence_and_loss_curves)
in Machine Learning Crash Course for more information.
## D
## DataFrame
#fundamentals
A popular [**pandas**](https://developers.google.com/machine-learning/glossary/fundamentals#pandas) data type for representing
[**datasets**](https://developers.google.com/machine-learning/glossary/fundamentals#dataset) in memory.
A DataFrame is analogous to a table or a spreadsheet. Each column of
a DataFrame has a name (a header), and each row is identified by a
unique number.
Each column in a DataFrame is structured like a 2D array, except that
each column can be assigned its own data type.
See also the official
[**pandas.DataFrame reference
page**](https://pandas.pydata.org/docs/reference/api/pandas.DataFrame.html).
## data set or dataset
#fundamentals
A collection of raw data, commonly (but not exclusively) organized in one
of the following formats:
- a spreadsheet
- a file in CSV (comma-separated values) format
## deep model
#fundamentals
A [**neural network**](https://developers.google.com/machine-learning/glossary/fundamentals#neural_network) containing more than one
[**hidden layer**](https://developers.google.com/machine-learning/glossary/fundamentals#hidden_layer).
A deep model is also called a **deep neural network**.
Contrast with [**wide model**](https://developers.google.com/machine-learning/glossary#wide_model).
## dense feature
#fundamentals
A [**feature**](https://developers.google.com/machine-learning/glossary/fundamentals#feature) in which most or all values are nonzero, typically
a [**Tensor**](https://developers.google.com/machine-learning/glossary#tensor) of floating-point values. For example, the following
10-element Tensor is dense because 9 of its values are nonzero:
|---|---|---|---|---|---|---|---|---|---|
| 8 | 3 | 7 | 5 | 2 | 4 | 0 | 4 | 9 | 6 |
Contrast with [**sparse feature**](https://developers.google.com/machine-learning/glossary/fundamentals#sparse_features).
## depth
#fundamentals
The sum of the following in a [**neural network**](https://developers.google.com/machine-learning/glossary/fundamentals#neural_network):
- the number of [**hidden layers**](https://developers.google.com/machine-learning/glossary/fundamentals#hidden_layer)
- the number of [**output layers**](https://developers.google.com/machine-learning/glossary/fundamentals#output_layer), which is typically 1
- the number of any [**embedding layers**](https://developers.google.com/machine-learning/glossary/fundamentals#embedding_layer)
For example, a neural network with five hidden layers and one output layer
has a depth of 6.
Notice that the [**input layer**](https://developers.google.com/machine-learning/glossary/fundamentals#input-layer) doesn't
influence depth.
## discrete feature
#fundamentals
A [**feature**](https://developers.google.com/machine-learning/glossary/fundamentals#feature) with a finite set of possible values. For example,
a feature whose values may only be *animal* , *vegetable* , or *mineral* is a
discrete (or categorical) feature.
Contrast with [**continuous feature**](https://developers.google.com/machine-learning/glossary/fundamentals#continuous_feature).
## dynamic
#fundamentals
Something done frequently or continuously.
The terms **dynamic** and **online** are synonyms in machine learning.
The following are common uses of **dynamic** and **online** in machine
learning:
- A [**dynamic model**](https://developers.google.com/machine-learning/glossary/fundamentals#dynamic_model) (or **online model**) is a model that is retrained frequently or continuously.
- **Dynamic training** (or **online training**) is the process of training frequently or continuously.
- **Dynamic inference** (or **online inference**) is the process of generating predictions on demand.
## dynamic model
#fundamentals
A [**model**](https://developers.google.com/machine-learning/glossary/fundamentals#model) that is frequently (maybe even continuously)
retrained. A dynamic model is a "lifelong learner" that
constantly adapts to evolving data. A dynamic model is also known as an
**online model**.
Contrast with [**static model**](https://developers.google.com/machine-learning/glossary/fundamentals#static-model).
## E
## early stopping
#fundamentals
A method for [**regularization**](https://developers.google.com/machine-learning/glossary/fundamentals#regularization) that involves ending
[**training**](https://developers.google.com/machine-learning/glossary/fundamentals#training) *before* training loss finishes
decreasing. In early stopping, you intentionally stop training the model
when the loss on a [**validation dataset**](https://developers.google.com/machine-learning/glossary/fundamentals#validation_set) starts to
increase; that is, when
[**generalization**](https://developers.google.com/machine-learning/glossary/fundamentals#generalization) performance worsens.
#### Click the icon for additional notes.
Early stopping may seem counterintuitive. After all, telling a model to halt
training while the loss is still decreasing may seem like telling a chef to
stop cooking before the dessert has fully baked. However, training a model for
too long can lead to [overfitting](https://developers.google.com/machine-learning/glossary/fundamentals#overfitting). That is, if you
train a model too long, the model may fit the training data so closely that
the model doesn't make good predictions on new examples.
*** ** * ** ***
Contrast with [**early exit**](https://developers.google.com/machine-learning/glossary#early-exit).
## embedding layer
#fundamentals
A special [**hidden layer**](https://developers.google.com/machine-learning/glossary/fundamentals#hidden_layer) that trains on a
high-dimensional [**categorical**](https://developers.google.com/machine-learning/glossary/fundamentals#categorical_data) feature to
gradually learn a lower dimension embedding vector. An
embedding layer enables a neural network to train far more
efficiently than training just on the high-dimensional categorical feature.
For example, Earth currently supports about 73,000 tree species. Suppose
tree species is a [**feature**](https://developers.google.com/machine-learning/glossary/fundamentals#feature) in your model, so your model's
input layer includes a [**one-hot vector**](https://developers.google.com/machine-learning/glossary/fundamentals#one-hot_encoding) 73,000
elements long.
For example, perhaps `baobab` would be represented something like this:

A 73,000-element array is very long. If you don't add an embedding layer
to the model, training is going to be very time consuming due to
multiplying 72,999 zeros. Perhaps you pick the embedding layer to consist
of 12 dimensions. Consequently, the embedding layer will gradually learn
a new embedding vector for each tree species.
In certain situations, [**hashing**](https://developers.google.com/machine-learning/glossary#hashing) is a reasonable alternative
to an embedding layer.
See [Embeddings](https://developers.google.com/machine-learning/crash-course/embeddings)
in Machine Learning Crash Course for more information.
## epoch
#fundamentals
A full training pass over the entire [**training set**](https://developers.google.com/machine-learning/glossary/fundamentals#training_set)
such that each [**example**](https://developers.google.com/machine-learning/glossary/fundamentals#example) has been processed once.
An epoch represents `N`/[**batch size**](https://developers.google.com/machine-learning/glossary/fundamentals#batch_size)
training [**iterations**](https://developers.google.com/machine-learning/glossary/fundamentals#iteration), where `N` is the
total number of examples.
For instance, suppose the following:
- The dataset consists of 1,000 examples.
- The batch size is 50 examples.
Therefore, a single epoch requires 20 iterations:
```
1 epoch = (N/batch size) = (1,000 / 50) = 20 iterations
```
See [Linear regression:
Hyperparameters](https://developers.google.com/machine-learning/crash-course/linear-regression/hyperparameters)
in Machine Learning Crash Course for more information.
## example
#fundamentals
The values of one row of [**features**](https://developers.google.com/machine-learning/glossary/fundamentals#feature) and possibly
a [**label**](https://developers.google.com/machine-learning/glossary/fundamentals#label). Examples in
[**supervised learning**](https://developers.google.com/machine-learning/glossary/fundamentals#supervised_machine_learning) fall into two
general categories:
- A [**labeled example**](https://developers.google.com/machine-learning/glossary/fundamentals#labeled_example) consists of one or more features and a label. Labeled examples are used during training.
- An [**unlabeled example**](https://developers.google.com/machine-learning/glossary/fundamentals#unlabeled_example) consists of one or more features but no label. Unlabeled examples are used during inference.
For instance, suppose you are training a model to determine the influence
of weather conditions on student test scores. Here are three labeled examples:
| Features ||| Label |
| Temperature | Humidity | Pressure | Test score |
|---|---|---|---|
| 15 | 47 | 998 | Good |
| 19 | 34 | 1020 | Excellent |
| 18 | 92 | 1012 | Poor |
Here are three unlabeled examples:
| Temperature | Humidity | Pressure | |
|---|---|---|---|
| 12 | 62 | 1014 | |
| 21 | 47 | 1017 | |
| 19 | 41 | 1021 | |
The row of a [**dataset**](https://developers.google.com/machine-learning/glossary/fundamentals#dataset) is typically the raw source for an example.
That is, an example typically consists of a subset of the columns in
the dataset. Furthermore, the features in an example can also include
[**synthetic features**](https://developers.google.com/machine-learning/glossary/fundamentals#synthetic_feature), such as
[**feature crosses**](https://developers.google.com/machine-learning/glossary/fundamentals#feature_cross).
See [Supervised Learning](https://developers.google.com/machine-learning/intro-to-ml/supervised) in
the Introduction to Machine Learning course for more information.
## F
## false negative (FN)
#fundamentals #Metric
An example in which the model mistakenly predicts the
[**negative class**](https://developers.google.com/machine-learning/glossary/fundamentals#negative_class). For example, the model
predicts that a particular email message is *not spam*
(the negative class), but that email message *actually is spam*.
## false positive (FP)
#fundamentals #Metric
An example in which the model mistakenly predicts the
[**positive class**](https://developers.google.com/machine-learning/glossary/fundamentals#positive_class). For example, the model predicts
that a particular email message is *spam* (the positive class), but that
email message is *actually not spam*.
See [Thresholds and the confusion
matrix](https://developers.google.com/machine-learning/crash-course/classification/thresholding)
in Machine Learning Crash Course for more information.
## false positive rate (FPR)
#fundamentals #Metric
The proportion of actual negative examples for which the model mistakenly
predicted the positive class. The following formula calculates the false
positive rate:
$$\\text{false positive rate} = \\frac{\\text{false positives}}{\\text{false positives} + \\text{true negatives}}$$
The false positive rate is the x-axis in an [**ROC curve**](https://developers.google.com/machine-learning/glossary/fundamentals#ROC).
See [Classification: ROC and
AUC](https://developers.google.com/machine-learning/crash-course/classification/roc-and-auc)
in Machine Learning Crash Course for more information.
## feature
#fundamentals
An input variable to a machine learning model. An [**example**](https://developers.google.com/machine-learning/glossary/fundamentals#example)
consists of one or more features. For instance, suppose you are training a
model to determine the influence of weather conditions on student test scores.
The following table shows three examples, each of which contains
three features and one label:
| Features ||| Label |
| Temperature | Humidity | Pressure | Test score |
|---|---|---|---|
| 15 | 47 | 998 | 92 |
| 19 | 34 | 1020 | 84 |
| 18 | 92 | 1012 | 87 |
Contrast with [**label**](https://developers.google.com/machine-learning/glossary/fundamentals#label).
See [Supervised Learning](https://developers.google.com/machine-learning/intro-to-ml/supervised)
in the Introduction to Machine Learning course for more information.
## feature cross
#fundamentals
A [**synthetic feature**](https://developers.google.com/machine-learning/glossary/fundamentals#synthetic_feature) formed by "crossing"
[**categorical**](https://developers.google.com/machine-learning/glossary/fundamentals#categorical_data) or [**bucketed**](https://developers.google.com/machine-learning/glossary/fundamentals#bucketing) features.
For example, consider a "mood forecasting" model that represents
temperature in one of the following four buckets:
- `freezing`
- `chilly`
- `temperate`
- `warm`
And represents wind speed in one of the following three buckets:
- `still`
- `light`
- `windy`
Without feature crosses, the linear model trains independently on each of the
preceding seven various buckets. So, the model trains on, for example,
`freezing` independently of the training on, for example,
`windy`.
Alternatively, you could create a feature cross of temperature and
wind speed. This synthetic feature would have the following 12 possible
values:
- `freezing-still`
- `freezing-light`
- `freezing-windy`
- `chilly-still`
- `chilly-light`
- `chilly-windy`
- `temperate-still`
- `temperate-light`
- `temperate-windy`
- `warm-still`
- `warm-light`
- `warm-windy`
Thanks to feature crosses, the model can learn mood differences
between a `freezing-windy` day and a `freezing-still` day.
If you create a synthetic feature from two features that each have a lot of
different buckets, the resulting feature cross will have a huge number
of possible combinations. For example, if one feature has 1,000 buckets and
the other feature has 2,000 buckets, the resulting feature cross has 2,000,000
buckets.
Formally, a cross is a
[Cartesian product](https://wikipedia.org/wiki/Cartesian_product).
Feature crosses are mostly used with linear models and are rarely used
with neural networks.
See [Categorical data: Feature
crosses](https://developers.google.com/machine-learning/crash-course/categorical-data/feature-crosses)
in Machine Learning Crash Course for more information.
## feature engineering
#fundamentals #TensorFlow
A process that involves the following steps:
1. Determining which [**features**](https://developers.google.com/machine-learning/glossary/fundamentals#feature) might be useful in training a model.
2. Converting raw data from the dataset into efficient versions of those features.
For example, you might determine that `temperature` might be a useful
feature. Then, you might experiment with [**bucketing**](https://developers.google.com/machine-learning/glossary/fundamentals#bucketing)
to optimize what the model can learn from different `temperature` ranges.
Feature engineering is sometimes called
[**feature extraction**](https://developers.google.com/machine-learning/glossary#feature_extraction) or
[**featurization**](https://developers.google.com/machine-learning/glossary#featurization).
#### Click the icon for additional notes about TensorFlow.
In TensorFlow, feature engineering often means converting raw log file
entries to [**tf.Example**](https://developers.google.com/machine-learning/glossary#tf.Example) protocol buffers.
See also
[tf.Transform](https://github.com/tensorflow/transform).
*** ** * ** ***
See [Numerical data: How a model ingests data using feature
vectors](https://developers.google.com/machine-learning/crash-course/numerical-data/feature-vectors)
in Machine Learning Crash Course for more information.
## feature set
#fundamentals
The group of [**features**](https://developers.google.com/machine-learning/glossary/fundamentals#feature) your machine learning
[**model**](https://developers.google.com/machine-learning/glossary/fundamentals#model) trains on.
For example, a simple feature set for a model that predicts housing prices
might consist of postal code, property size, and property condition.
## feature vector
#fundamentals
The array of [**feature**](https://developers.google.com/machine-learning/glossary/fundamentals#feature) values comprising an
[**example**](https://developers.google.com/machine-learning/glossary/fundamentals#example). The feature vector is input during
[**training**](https://developers.google.com/machine-learning/glossary/fundamentals#training) and during [**inference**](https://developers.google.com/machine-learning/glossary/fundamentals#inference).
For example, the feature vector for a model with two discrete features
might be:
```
[0.92, 0.56]
```
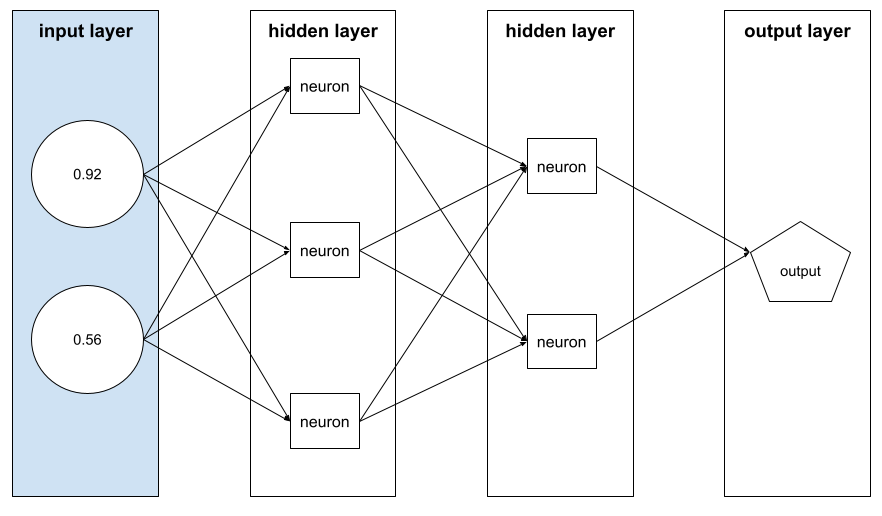
Each example supplies different values for the feature vector, so the
feature vector for the next example could be something like:
```
[0.73, 0.49]
```
[**Feature engineering**](https://developers.google.com/machine-learning/glossary/fundamentals#feature_engineering) determines how to represent
features in the feature vector. For example, a binary categorical feature with
five possible values might be represented with
[**one-hot encoding**](https://developers.google.com/machine-learning/glossary/fundamentals#one-hot_encoding). In this case, the portion of the
feature vector for a particular example would consist of four zeroes and
a single 1.0 in the third position, as follows:
```
[0.0, 0.0, 1.0, 0.0, 0.0]
```
As another example, suppose your model consists of three features:
- a binary categorical feature with *five* possible values represented with one-hot encoding; for example: `[0.0, 1.0, 0.0, 0.0, 0.0]`
- another binary categorical feature with *three* possible values represented with one-hot encoding; for example: `[0.0, 0.0, 1.0]`
- a floating-point feature; for example: `8.3`.
In this case, the feature vector for each example would be represented
by *nine* values. Given the example values in the preceding list, the
feature vector would be:
```
0.0
1.0
0.0
0.0
0.0
0.0
0.0
1.0
8.3
```
See [Numerical data: How a model ingests data using feature
vectors](https://developers.google.com/machine-learning/crash-course/numerical-data/feature-vectors)
in Machine Learning Crash Course for more information.
## feedback loop
#fundamentals
In machine learning, a situation in which a model's predictions influence the
training data for the same model or another model. For example, a model that
recommends movies will influence the movies that people see, which will then
influence subsequent movie recommendation models.
See [Production ML systems: Questions to
ask](https://developers.google.com/machine-learning/crash-course/production-ml-systems/questions)
in Machine Learning Crash Course for more information.
## G
## generalization
#fundamentals
A [**model's**](https://developers.google.com/machine-learning/glossary/fundamentals#model) ability to make correct predictions on new,
previously unseen data. A model that can generalize is the opposite
of a model that is [**overfitting**](https://developers.google.com/machine-learning/glossary/fundamentals#overfitting).
#### Click the icon for additional notes.
You train a model on the examples in the training set. Consequently, the
model learns the peculiarities of the data in the training set. Generalization
essentially asks whether your model can make good predictions on examples
that are *not* in the training set.
To encourage generalization,
[**regularization**](https://developers.google.com/machine-learning/glossary/fundamentals#regularization) helps a model train
less exactly to the peculiarities of the data in the training set.
*** ** * ** ***
See [Generalization](https://developers.google.com/machine-learning/crash-course/overfitting/generalization)
in Machine Learning Crash Course for more information.
## generalization curve
#fundamentals
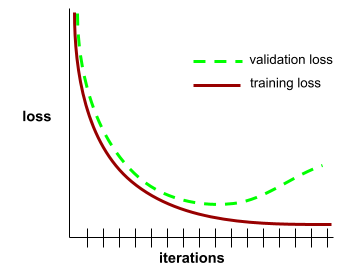
A plot of both [**training loss**](https://developers.google.com/machine-learning/glossary/fundamentals#training-loss) and
[**validation loss**](https://developers.google.com/machine-learning/glossary/fundamentals#validation-loss) as a function of the number of
[**iterations**](https://developers.google.com/machine-learning/glossary/fundamentals#iteration).
A generalization curve can help you detect possible
[**overfitting**](https://developers.google.com/machine-learning/glossary/fundamentals#overfitting). For example, the following
generalization curve suggests overfitting because validation loss
ultimately becomes significantly higher than training loss.
See [Generalization](https://developers.google.com/machine-learning/crash-course/overfitting/generalization)
in Machine Learning Crash Course for more information.
## gradient descent
#fundamentals
A mathematical technique to minimize [**loss**](https://developers.google.com/machine-learning/glossary/fundamentals#loss).
Gradient descent iteratively adjusts
[**weights**](https://developers.google.com/machine-learning/glossary/fundamentals#weight) and [**biases**](https://developers.google.com/machine-learning/glossary/fundamentals#bias),
gradually finding the best combination to minimize loss.
Gradient descent is older---much, much older---than machine learning.
See the [Linear regression: Gradient
descent](https://developers.google.com/machine-learning/crash-course/linear-regression/gradient-descent)
in Machine Learning Crash Course for more information.
## ground truth
#fundamentals
Reality.
The thing that actually happened.
For example, consider a [**binary classification**](https://developers.google.com/machine-learning/glossary/fundamentals#binary_classification)
model that predicts whether a student in their first year of university
will graduate within six years. Ground truth for this model is whether or
not that student actually graduated within six years.
#### Click the icon for additional notes.
We assess model quality against ground truth. However, ground truth
is not always completely, well, truthful. For example, consider the
following examples of potential imperfections in ground truth:
- In the graduation example, are we *certain* that the graduation records for each student are always correct? Is the university's record-keeping flawless?
- Suppose the label is a floating-point value measured by instruments (for example, barometers). How can we be sure that each instrument is calibrated identically or that each reading was taken under the same circumstances?
- If the label is a matter of human opinion, how can we be sure that each human [**rater**](https://developers.google.com/machine-learning/glossary/fundamentals#rater) is evaluating events in the same way? To improve consistency, *expert* human raters sometimes intervene.
*** ** * ** ***
## H
## hidden layer
#fundamentals
A layer in a [**neural network**](https://developers.google.com/machine-learning/glossary/fundamentals#neural_network) between the
[**input layer**](https://developers.google.com/machine-learning/glossary/fundamentals#input-layer) (the features) and the
[**output layer**](https://developers.google.com/machine-learning/glossary/fundamentals#output_layer) (the prediction).
Each hidden layer consists of one or more [**neurons**](https://developers.google.com/machine-learning/glossary/fundamentals#neuron).
For example, the following neural network contains two hidden layers,
the first with three neurons and the second with two neurons:
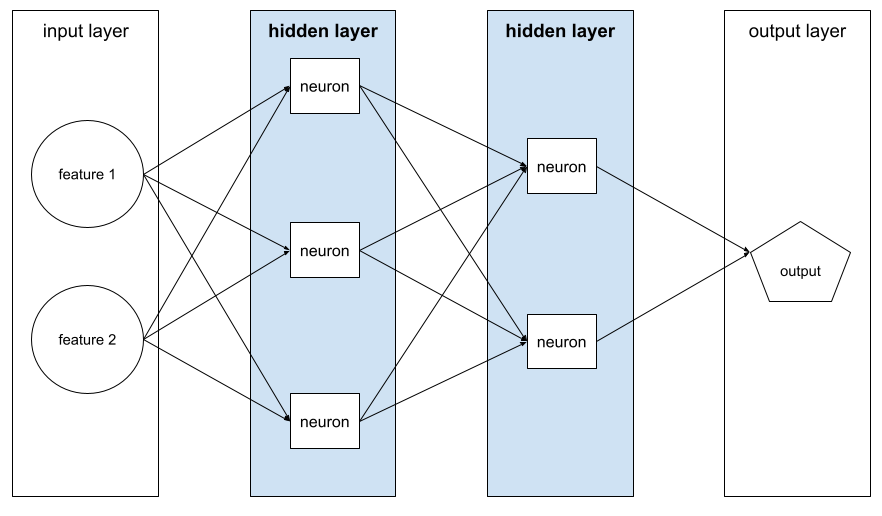
A [**deep neural network**](https://developers.google.com/machine-learning/glossary#deep_neural_network) contains more than one
hidden layer. For example, the preceding illustration is a deep neural
network because the model contains two hidden layers.
See [Neural networks: Nodes and hidden
layers](https://developers.google.com/machine-learning/crash-course/neural-networks/nodes-hidden-layers)
in Machine Learning Crash Course for more information.
## hyperparameter
#fundamentals
The variables that you or a hyperparameter tuning service
adjust during successive runs of training a model. For example,
[**learning rate**](https://developers.google.com/machine-learning/glossary/fundamentals#learning_rate) is a hyperparameter. You could
set the learning rate to 0.01 before one training session. If you
determine that 0.01 is too high, you could perhaps set the learning
rate to 0.003 for the next training session.
In contrast, [**parameters**](https://developers.google.com/machine-learning/glossary/fundamentals#parameter) are the various
[**weights**](https://developers.google.com/machine-learning/glossary/fundamentals#weight) and [**bias**](https://developers.google.com/machine-learning/glossary/fundamentals#bias) that the model
*learns* during training.
See [Linear regression:
Hyperparameters](https://developers.google.com/machine-learning/crash-course/linear-regression/hyperparameters)
in Machine Learning Crash Course for more information.
## I
## independently and identically distributed (i.i.d)
#fundamentals
Data drawn from a distribution that doesn't change, and where each value
drawn doesn't depend on values that have been drawn previously. An i.i.d.
is the [ideal gas](https://wikipedia.org/wiki/Ideal_gas)
of machine
learning---a useful mathematical construct but almost never exactly found
in the real world. For example, the distribution of visitors to a web page
may be i.i.d. over a brief window of time; that is, the distribution doesn't
change during that brief window and one person's visit is generally
independent of another's visit. However, if you expand that window of time,
seasonal differences in the web page's visitors may appear.
See also [**nonstationarity**](https://developers.google.com/machine-learning/glossary/fundamentals#nonstationarity).
## inference
#fundamentals #generativeAI
In traditional machine learning, the process of making predictions by
applying a trained model to [**unlabeled examples**](https://developers.google.com/machine-learning/glossary/fundamentals#unlabeled_example).
See [Supervised Learning](https://developers.google.com/machine-learning/intro-to-ml/supervised)
in the Intro to ML course to learn more.
In [**large language models**](https://developers.google.com/machine-learning/glossary#large-language-model), inference is the
process of using a trained model to generate a [**response**](https://developers.google.com/machine-learning/glossary#response)
to an input [**prompt**](https://developers.google.com/machine-learning/glossary#prompt).
Inference has a somewhat different meaning in statistics. See the
[Wikipedia article on statistical inference](https://wikipedia.org/wiki/Statistical_inference) for details.
## input layer
#fundamentals
The [**layer**](https://developers.google.com/machine-learning/glossary/fundamentals#layer) of a [**neural network**](https://developers.google.com/machine-learning/glossary/fundamentals#neural_network) that
holds the [**feature vector**](https://developers.google.com/machine-learning/glossary/fundamentals#feature_vector). That is, the input layer
provides [**examples**](https://developers.google.com/machine-learning/glossary/fundamentals#example) for [**training**](https://developers.google.com/machine-learning/glossary/fundamentals#training) or
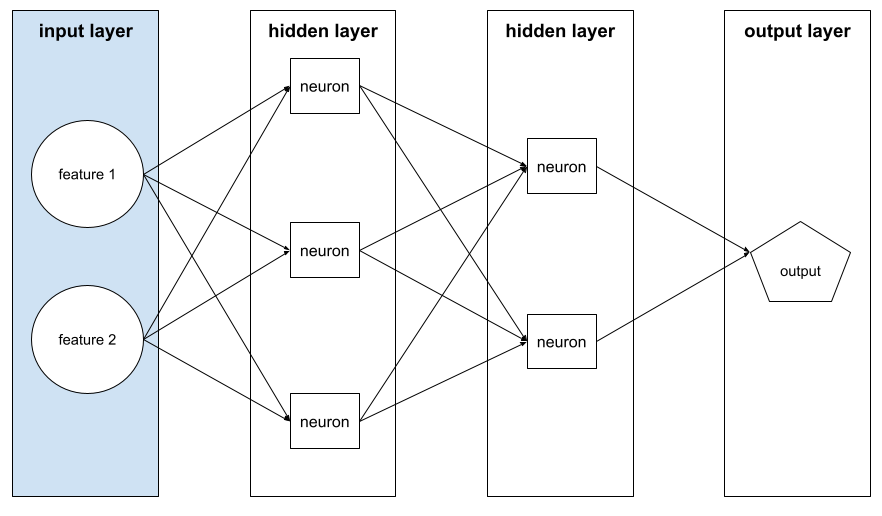
[**inference**](https://developers.google.com/machine-learning/glossary/fundamentals#inference). For example, the input layer in the following
neural network consists of two features:
## interpretability
#fundamentals
The ability to explain or to present an ML [**model's**](https://developers.google.com/machine-learning/glossary/fundamentals#model) reasoning in
understandable terms to a human.
Most [**linear regression**](https://developers.google.com/machine-learning/glossary/fundamentals#linear_regression) models, for example, are highly
interpretable. (You merely need to look at the trained weights for each
feature.) Decision forests are also highly interpretable. Some models, however,
require sophisticated visualization to become interpretable.
You can use the
[**Learning Interpretability Tool (LIT)**](https://developers.google.com/machine-learning/glossary#Learning-Interpretability-Tool)
to interpret ML models.
## iteration
#fundamentals
A single update of a [**model's**](https://developers.google.com/machine-learning/glossary/fundamentals#model) parameters---the model's
[**weights**](https://developers.google.com/machine-learning/glossary/fundamentals#weight) and [**biases**](https://developers.google.com/machine-learning/glossary/fundamentals#bias)---during
[**training**](https://developers.google.com/machine-learning/glossary/fundamentals#training). The [**batch size**](https://developers.google.com/machine-learning/glossary/fundamentals#batch_size) determines
how many examples the model processes in a single iteration. For instance,
if the batch size is 20, then the model processes 20 examples before
adjusting the parameters.
When training a [**neural network**](https://developers.google.com/machine-learning/glossary/fundamentals#neural_network), a single iteration
involves the following two passes:
1. A forward pass to evaluate loss on a single batch.
2. A backward pass ([**backpropagation**](https://developers.google.com/machine-learning/glossary/fundamentals#backpropagation)) to adjust the model's parameters based on the loss and the learning rate.
See [Gradient
descent](https://developers.google.com/machine-learning/crash-course/linear-regression/gradient-descent)
in Machine Learning Crash Course for more information.
## L
## L~0~ regularization
#fundamentals
A type of [**regularization**](https://developers.google.com/machine-learning/glossary/fundamentals#regularization) that
penalizes the *total number* of nonzero [**weights**](https://developers.google.com/machine-learning/glossary/fundamentals#weight)
in a model. For example, a model having 11 nonzero weights
would be penalized more than a similar model having 10 nonzero weights.
L~0~ regularization is sometimes called *L0-norm regularization*.
#### Click the icon for additional notes.
L~0~ regularization is generally impractical in large models because
L~0~ regularization turns training into a
[**convex**](https://developers.google.com/machine-learning/glossary#convex_function)
optimization problem.
*** ** * ** ***
## L~1~ loss
#fundamentals #Metric
A [**loss function**](https://developers.google.com/machine-learning/glossary/fundamentals#loss-function) that calculates the absolute value
of the difference between actual [**label**](https://developers.google.com/machine-learning/glossary/fundamentals#label) values and
the values that a [**model**](https://developers.google.com/machine-learning/glossary/fundamentals#model) predicts. For example, here's the
calculation of L~1~ loss for a [**batch**](https://developers.google.com/machine-learning/glossary/fundamentals#batch) of five
[**examples**](https://developers.google.com/machine-learning/glossary/fundamentals#example):
| Actual value of example | Model's predicted value | Absolute value of delta |
|---|---|---|
| 7 | 6 | 1 |
| 5 | 4 | 1 |
| 8 | 11 | 3 |
| 4 | 6 | 2 |
| 9 | 8 | 1 |
L~1~ loss is less sensitive to [**outliers**](https://developers.google.com/machine-learning/glossary#outliers)
than [**L~2~ loss**](https://developers.google.com/machine-learning/glossary/fundamentals#squared_loss).
The [**Mean Absolute Error**](https://developers.google.com/machine-learning/glossary#MAE) is the average
L~1~ loss per example.
#### Click the icon to see the formal math.
$$ L_1 loss = \\sum_{i=0}\^n \| y_i - \\hat{y}_i \|$$
where:
- $n$ is the number of examples.
- $y$ is the actual value of the label.
- $\\hat{y}$ is the value that the model predicts for $y$.
*** ** * ** ***
See
[Linear regression: Loss](https://developers.google.com/machine-learning/crash-course/linear-regression/loss)
in Machine Learning Crash Course for more information.
## L~1~ regularization
#fundamentals
A type of [**regularization**](https://developers.google.com/machine-learning/glossary/fundamentals#regularization) that penalizes
[**weights**](https://developers.google.com/machine-learning/glossary/fundamentals#weight) in proportion to the sum of the absolute value of
the weights. L~1~ regularization helps drive the weights of irrelevant
or barely relevant features to *exactly 0* . A [**feature**](https://developers.google.com/machine-learning/glossary/fundamentals#feature) with
a weight of 0 is effectively removed from the model.
Contrast with [**L~2~ regularization**](https://developers.google.com/machine-learning/glossary/fundamentals#L2_regularization).
## L~2~ loss
#fundamentals #Metric
A [**loss function**](https://developers.google.com/machine-learning/glossary/fundamentals#loss-function) that calculates the square
of the difference between actual [**label**](https://developers.google.com/machine-learning/glossary/fundamentals#label) values and
the values that a [**model**](https://developers.google.com/machine-learning/glossary/fundamentals#model) predicts. For example, here's the
calculation of L~2~ loss for a [**batch**](https://developers.google.com/machine-learning/glossary/fundamentals#batch) of five
[**examples**](https://developers.google.com/machine-learning/glossary/fundamentals#example):
| Actual value of example | Model's predicted value | Square of delta |
|---|---|---|
| 7 | 6 | 1 |
| 5 | 4 | 1 |
| 8 | 11 | 9 |
| 4 | 6 | 4 |
| 9 | 8 | 1 |
Due to squaring, L~2~ loss amplifies the influence of
[**outliers**](https://developers.google.com/machine-learning/glossary#outliers).
That is, L~2~ loss reacts more strongly to bad predictions than
[**L~1~ loss**](https://developers.google.com/machine-learning/glossary/fundamentals#L1_loss). For example, the L~1~ loss
for the preceding batch would be 8 rather than 16. Notice that a single
outlier accounts for 9 of the 16.
[**Regression models**](https://developers.google.com/machine-learning/glossary/fundamentals#regression_model) typically use L~2~ loss
as the loss function.
The [**Mean Squared Error**](https://developers.google.com/machine-learning/glossary#MSE) is the average
L~2~ loss per example.
**Squared loss** is another name for L~2~ loss.
#### Click the icon to see the formal math.
$$ L_2 loss = \\sum_{i=0}\^n {(y_i - \\hat{y}_i)}\^2$$
where:
- $n$ is the number of examples.
- $y$ is the actual value of the label.
- $\\hat{y}$ is the value that the model predicts for $y$.
*** ** * ** ***
See [Logistic regression: Loss and
regularization](https://developers.google.com/machine-learning/crash-course/logistic-regression/loss-regularization)
in Machine Learning Crash Course for more information.
## L~2~ regularization
#fundamentals
A type of [**regularization**](https://developers.google.com/machine-learning/glossary/fundamentals#regularization) that penalizes
[**weights**](https://developers.google.com/machine-learning/glossary/fundamentals#weight) in proportion to the sum of the *squares* of the weights.
L~2~ regularization helps drive [**outlier**](https://developers.google.com/machine-learning/glossary#outliers) weights (those
with high positive or low negative values) closer to 0 but *not quite to 0*.
Features with values very close to 0 remain in the model
but don't influence the model's prediction very much.
L~2~ regularization always improves generalization in
[**linear models**](https://developers.google.com/machine-learning/glossary/fundamentals#linear_model).
Contrast with [**L~1~ regularization**](https://developers.google.com/machine-learning/glossary/fundamentals#L1_regularization).
See [Overfitting: L2
regularization](https://developers.google.com/machine-learning/crash-course/overfitting/regularization)
in Machine Learning Crash Course for more information.
## label
#fundamentals
In [**supervised machine learning**](https://developers.google.com/machine-learning/glossary/fundamentals#supervised_machine_learning), the
"answer" or "result" portion of an [**example**](https://developers.google.com/machine-learning/glossary/fundamentals#example).
Each [**labeled example**](https://developers.google.com/machine-learning/glossary/fundamentals#labeled_example) consists of one or more
[**features**](https://developers.google.com/machine-learning/glossary/fundamentals#feature) and a label. For example, in a spam
detection dataset, the label would probably be either "spam" or
"not spam." In a rainfall dataset, the label might be the amount of
rain that fell during a certain period.
See [Supervised Learning](https://developers.google.com/machine-learning/intro-to-ml/supervised)
in Introduction to Machine Learning for more information.
## labeled example
#fundamentals
An example that contains one or more [**features**](https://developers.google.com/machine-learning/glossary/fundamentals#feature) and a
[**label**](https://developers.google.com/machine-learning/glossary/fundamentals#label). For example, the following table shows three
labeled examples from a house valuation model, each with three features
and one label:
| Number of bedrooms | Number of bathrooms | House age | House price (label) |
|---|---|---|---|
| 3 | 2 | 15 | $345,000 |
| 2 | 1 | 72 | $179,000 |
| 4 | 2 | 34 | $392,000 |
In [**supervised machine learning**](https://developers.google.com/machine-learning/glossary/fundamentals#supervised_machine_learning),
models train on labeled examples and make predictions on
[**unlabeled examples**](https://developers.google.com/machine-learning/glossary/fundamentals#unlabeled_example).
Contrast labeled example with unlabeled examples.
See [Supervised Learning](https://developers.google.com/machine-learning/intro-to-ml/supervised)
in Introduction to Machine Learning for more information.
## lambda
#fundamentals
Synonym for [**regularization rate**](https://developers.google.com/machine-learning/glossary/fundamentals#regularization_rate).
Lambda is an overloaded term. Here we're focusing on the term's
definition within [**regularization**](https://developers.google.com/machine-learning/glossary/fundamentals#regularization).
## layer
#fundamentals
A set of [**neurons**](https://developers.google.com/machine-learning/glossary/fundamentals#neuron) in a
[**neural network**](https://developers.google.com/machine-learning/glossary/fundamentals#neural_network). Three common types of layers
are as follows:
- The [**input layer**](https://developers.google.com/machine-learning/glossary/fundamentals#input-layer), which provides values for all the [**features**](https://developers.google.com/machine-learning/glossary/fundamentals#feature).
- One or more [**hidden layers**](https://developers.google.com/machine-learning/glossary/fundamentals#hidden_layer), which find nonlinear relationships between the features and the label.
- The [**output layer**](https://developers.google.com/machine-learning/glossary/fundamentals#output_layer), which provides the prediction.
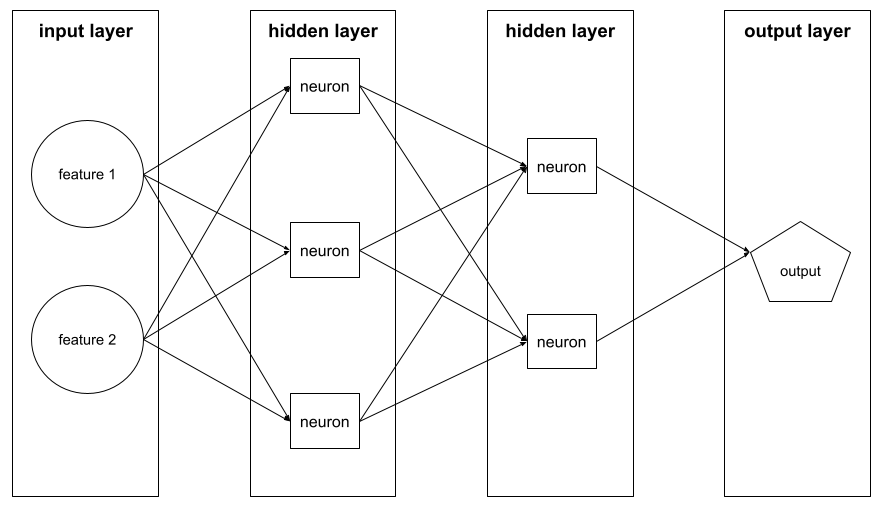
For example, the following illustration shows a neural network with
one input layer, two hidden layers, and one output layer:
In [**TensorFlow**](https://developers.google.com/machine-learning/glossary#TensorFlow), **layers** are also Python functions that take
[**Tensors**](https://developers.google.com/machine-learning/glossary#tensor) and configuration options as input and
produce other tensors as output.
## learning rate
#fundamentals
A floating-point number that tells the [**gradient descent**](https://developers.google.com/machine-learning/glossary/fundamentals#gradient_descent)
algorithm how strongly to adjust weights and biases on each
[**iteration**](https://developers.google.com/machine-learning/glossary/fundamentals#iteration). For example, a learning rate of 0.3 would
adjust weights and biases three times more powerfully than a learning rate
of 0.1.
Learning rate is a key [**hyperparameter**](https://developers.google.com/machine-learning/glossary/fundamentals#hyperparameter). If you set
the learning rate too low, training will take too long. If
you set the learning rate too high, gradient descent often has trouble
reaching [**convergence**](https://developers.google.com/machine-learning/glossary/fundamentals#convergence).
#### Click the icon for a more mathematical explanation.
During each iteration, the
[**gradient descent**](https://developers.google.com/machine-learning/glossary/fundamentals#gradient_descent)
algorithm multiplies the
learning rate by the gradient. The resulting product is called the
**gradient step**.
*** ** * ** ***
See [Linear regression:
Hyperparameters](https://developers.google.com/machine-learning/crash-course/linear-regression/hyperparameters)
in Machine Learning Crash Course for more information.
## linear
#fundamentals
A relationship between two or more variables that can be represented solely
through addition and multiplication.
The plot of a linear relationship is a line.
Contrast with [**nonlinear**](https://developers.google.com/machine-learning/glossary/fundamentals#nonlinear).
## linear model
#fundamentals
A [**model**](https://developers.google.com/machine-learning/glossary/fundamentals#model) that assigns one [**weight**](https://developers.google.com/machine-learning/glossary/fundamentals#weight) per
[**feature**](https://developers.google.com/machine-learning/glossary/fundamentals#feature) to make [**predictions**](https://developers.google.com/machine-learning/glossary/fundamentals#prediction).
(Linear models also incorporate a [**bias**](https://developers.google.com/machine-learning/glossary/fundamentals#bias).) In contrast,
the relationship of features to predictions in [**deep models**](https://developers.google.com/machine-learning/glossary/fundamentals#deep_model)
is generally **nonlinear**.
Linear models are usually easier to train and more
[**interpretable**](https://developers.google.com/machine-learning/glossary/fundamentals#interpretability) than deep models. However,
deep models can learn complex relationships *between* features.
[**Linear regression**](https://developers.google.com/machine-learning/glossary/fundamentals#linear_regression) and
[**logistic regression**](https://developers.google.com/machine-learning/glossary/fundamentals#logistic_regression) are two types of linear models.
#### Click the icon to see the math.
A linear model follows this formula:
$$y' = b + w_1x_1 + w_2x_2 + ... w_nx_n$$ where:
- y' is the raw prediction. (In certain kinds of linear models, this raw prediction will be further modified. For example, see [**logistic regression**](https://developers.google.com/machine-learning/glossary/fundamentals#logistic_regression).)
- b is the [**bias**](https://developers.google.com/machine-learning/glossary/fundamentals#bias).
- w is a [**weight**](https://developers.google.com/machine-learning/glossary/fundamentals#weight), so w~1~ is the weight of the first feature, w~2~ is the weight of the second feature, and so on.
- x is a [**feature**](https://developers.google.com/machine-learning/glossary/fundamentals#feature), so x~1~ is the value of the first feature, x~2~ is the value of the second feature, and so on.
For example, suppose a linear model for three features learns the following bias and weights:
- b = 7
- w~1~ = -2.5
- w~2~ = -1.2
- w~3~ = 1.4
Therefore, given three features (x~1~, x~2~, and x~3~), the linear model uses the following equation to generate each prediction:
```
y' = 7 + (-2.5)(x1) + (-1.2)(x2) + (1.4)(x3)
```
Suppose a particular example contains the following values:
- x~1~ = 4
- x~2~ = -10
- x~3~ = 5
Plugging those values into the formula yields a prediction for this example:
```
y' = 7 + (-2.5)(4) + (-1.2)(-10) + (1.4)(5)
y' = 16
```
Linear models include not only models that use only a linear equation to
make predictions but also a broader set of models that use a linear equation
as just one component of the formula that makes predictions.
For example, logistic regression post-processes the raw
prediction (y') to produce a final prediction value between 0 and 1,
exclusively.
*** ** * ** ***
## linear regression
#fundamentals
A type of machine learning model in which both of the following are true:
- The model is a [**linear model**](https://developers.google.com/machine-learning/glossary/fundamentals#linear_model).
- The prediction is a floating-point value. (This is the [**regression**](https://developers.google.com/machine-learning/glossary/fundamentals#regression_model) part of *linear regression*.)
Contrast linear regression with [**logistic regression**](https://developers.google.com/machine-learning/glossary/fundamentals#logistic_regression).
Also, contrast regression with [**classification**](https://developers.google.com/machine-learning/glossary/fundamentals#classification_model).
See [Linear regression](https://developers.google.com/machine-learning/crash-course/linear-regression)
in Machine Learning Crash Course for more information.
## logistic regression
#fundamentals
A type of [**regression model**](https://developers.google.com/machine-learning/glossary/fundamentals#regression_model) that predicts a probability.
Logistic regression models have the following characteristics:
- The label is [**categorical**](https://developers.google.com/machine-learning/glossary/fundamentals#categorical_data). The term logistic regression usually refers to **binary logistic regression** , that is, to a model that calculates probabilities for labels with two possible values. A less common variant, **multinomial logistic regression**, calculates probabilities for labels with more than two possible values.
- The loss function during training is [**Log Loss**](https://developers.google.com/machine-learning/glossary/fundamentals#Log_Loss). (Multiple Log Loss units can be placed in parallel for labels with more than two possible values.)
- The model has a linear architecture, not a deep neural network. However, the remainder of this definition also applies to [**deep models**](https://developers.google.com/machine-learning/glossary/fundamentals#deep_model) that predict probabilities for categorical labels.
For example, consider a logistic regression model that calculates the
probability of an input email being either spam or not spam.
During inference, suppose the model predicts 0.72. Therefore, the
model is estimating:
- A 72% chance of the email being spam.
- A 28% chance of the email not being spam.
A logistic regression model uses the following two-step architecture:
1. The model generates a raw prediction (y') by applying a linear function of input features.
2. The model uses that raw prediction as input to a [**sigmoid function**](https://developers.google.com/machine-learning/glossary/fundamentals#sigmoid-function), which converts the raw prediction to a value between 0 and 1, exclusive.
Like any regression model, a logistic regression model predicts a number.
However, this number typically becomes part of a binary classification
model as follows:
- If the predicted number is *greater* than the [**classification threshold**](https://developers.google.com/machine-learning/glossary/fundamentals#classification_threshold), the binary classification model predicts the positive class.
- If the predicted number is *less* than the classification threshold, the binary classification model predicts the negative class.
See [Logistic regression](https://developers.google.com/machine-learning/crash-course/logistic-regression)
in Machine Learning Crash Course for more information.
## Log Loss
#fundamentals
The [**loss function**](https://developers.google.com/machine-learning/glossary/fundamentals#loss-function) used in binary
[**logistic regression**](https://developers.google.com/machine-learning/glossary/fundamentals#logistic_regression).
#### Click the icon to see the math.
The following formula calculates Log Loss:
$$\\text{Log Loss} = \\sum_{(x,y)\\in D} -y\\log(y') - (1 - y)\\log(1 - y')$$ where:
- \\((x,y)\\in D\\) is the dataset containing many labeled examples, which are \\((x,y)\\) pairs.
- \\(y\\) is the label in a labeled example. Since this is logistic regression, every value of \\(y\\) must either be 0 or 1.
- \\(y'\\) is the predicted value (somewhere between 0 and 1, exclusive), given the set of features in \\(x\\).
*** ** * ** ***
See [Logistic regression: Loss and regularization](https://developers.google.com/machine-learning/crash-course/logistic-regression/loss-regularization)
in Machine Learning Crash Course for more information.
## log-odds
#fundamentals
The logarithm of the odds of some event.
#### Click the icon to see the math.
If the event is a binary probability, then **odds** refers to
the ratio of the probability of success (*p*) to the probability of
failure (1-*p*). For example, suppose that a given event has a 90%
probability of success and a 10% probability of failure. In this case,
odds is calculated as follows:
$$ {\\text{odds}} = \\frac{\\text{p}} {\\text{(1-p)}} = \\frac{.9} {.1} = {\\text{9}} $$
The log-odds is simply the logarithm of the odds. By convention,
"logarithm" refers to
[natural logarithm](https://wikipedia.org/wiki/Natural_logarithm),
but logarithm could actually be any base greater than 1.
Sticking to convention, the log-odds of our example is therefore:
$$ {\\text{log-odds}} = ln(9) \~= 2.2 $$
The log-odds function is the inverse of the
[**sigmoid function**](https://developers.google.com/machine-learning/glossary/fundamentals#sigmoid-function).
*** ** * ** ***
## loss
#fundamentals #Metric
During the [**training**](https://developers.google.com/machine-learning/glossary/fundamentals#training) of a
[**supervised model**](https://developers.google.com/machine-learning/glossary/fundamentals#supervised_machine_learning), a measure of how far a
model's [**prediction**](https://developers.google.com/machine-learning/glossary/fundamentals#prediction) is from its [**label**](https://developers.google.com/machine-learning/glossary/fundamentals#label).
A [**loss function**](https://developers.google.com/machine-learning/glossary/fundamentals#loss-function) calculates the loss.
See [Linear regression: Loss](https://developers.google.com/machine-learning/crash-course/linear-regression/loss)
in Machine Learning Crash Course for more information.
## loss curve
#fundamentals
A plot of [**loss**](https://developers.google.com/machine-learning/glossary/fundamentals#loss) as a function of the number of training
[**iterations**](https://developers.google.com/machine-learning/glossary/fundamentals#iteration). The following plot shows a typical loss
curve:
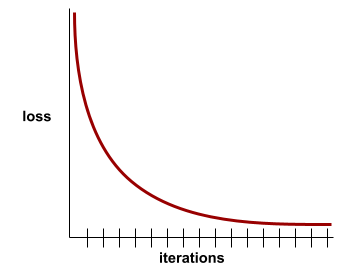
Loss curves can help you determine when your model is
[**converging**](https://developers.google.com/machine-learning/glossary/fundamentals#convergence) or [**overfitting**](https://developers.google.com/machine-learning/glossary/fundamentals#overfitting).
Loss curves can plot all of the following types of loss:
- [**training loss**](https://developers.google.com/machine-learning/glossary/fundamentals#training-loss)
- [**validation loss**](https://developers.google.com/machine-learning/glossary/fundamentals#validation-loss)
- [**test loss**](https://developers.google.com/machine-learning/glossary/fundamentals#test-loss)
See also [**generalization curve**](https://developers.google.com/machine-learning/glossary/fundamentals#generalization_curve).
See [Overfitting: Interpreting loss curves](https://developers.google.com/machine-learning/crash-course/overfitting/interpreting-loss-curves)
in Machine Learning Crash Course for more information.
## loss function
#fundamentals #Metric
During [**training**](https://developers.google.com/machine-learning/glossary/fundamentals#training) or testing, a
mathematical function that calculates the
loss on a [**batch**](https://developers.google.com/machine-learning/glossary/fundamentals#batch) of examples. A loss function returns a lower loss
for models that makes good predictions than for models that make
bad predictions.
The goal of training is typically to minimize the loss that a loss function
returns.
Many different kinds of loss functions exist. Pick the appropriate loss
function for the kind of model you are building. For example:
- [**L~2~ loss**](https://developers.google.com/machine-learning/glossary/fundamentals#L2_loss) (or [**Mean Squared Error**](https://developers.google.com/machine-learning/glossary#MSE)) is the loss function for [**linear regression**](https://developers.google.com/machine-learning/glossary/fundamentals#linear_regression).
- [**Log Loss**](https://developers.google.com/machine-learning/glossary/fundamentals#Log_Loss) is the loss function for [**logistic regression**](https://developers.google.com/machine-learning/glossary/fundamentals#logistic_regression).
## M
## machine learning
#fundamentals
A program or system that [**trains**](https://developers.google.com/machine-learning/glossary/fundamentals#training) a
[**model**](https://developers.google.com/machine-learning/glossary/fundamentals#model) from input data. The trained model can
make useful predictions from new (never-before-seen) data drawn from
the same distribution as the one used to train the model.
Machine learning also refers to the field of study concerned
with these programs or systems.
See the [Introduction to Machine Learning](https://developers.google.com/machine-learning/intro-to-ml)
course for more information.
## majority class
#fundamentals
The more common label in a
[**class-imbalanced dataset**](https://developers.google.com/machine-learning/glossary/fundamentals#class_imbalanced_data_set). For example,
given a dataset containing 99% negative labels and 1% positive labels, the
negative labels are the majority class.
Contrast with [**minority class**](https://developers.google.com/machine-learning/glossary/fundamentals#minority_class).
See [Datasets: Imbalanced datasets](https://developers.google.com/machine-learning/crash-course/overfitting/imbalanced-datasets)
in Machine Learning Crash Course for more information.
## mini-batch
#fundamentals
A small, randomly selected subset of a [**batch**](https://developers.google.com/machine-learning/glossary/fundamentals#batch) processed in one
[**iteration**](https://developers.google.com/machine-learning/glossary/fundamentals#iteration).
The [**batch size**](https://developers.google.com/machine-learning/glossary/fundamentals#batch_size) of a mini-batch is usually
between 10 and 1,000 examples.
For example, suppose the entire training set (the full batch)
consists of 1,000 examples. Further suppose that you set the
[**batch size**](https://developers.google.com/machine-learning/glossary/fundamentals#batch_size) of each mini-batch to 20. Therefore, each
iteration determines the loss on a random 20 of the 1,000 examples and then
adjusts the [**weights**](https://developers.google.com/machine-learning/glossary/fundamentals#weight) and [**biases**](https://developers.google.com/machine-learning/glossary/fundamentals#bias) accordingly.
It is much more efficient to calculate the loss on a mini-batch than the
loss on all the examples in the full batch.
See [Linear regression:
Hyperparameters](https://developers.google.com/machine-learning/crash-course/linear-regression/hyperparameters#batch_size)
in Machine Learning Crash Course for more information.
## minority class
#fundamentals
The less common label in a
[**class-imbalanced dataset**](https://developers.google.com/machine-learning/glossary/fundamentals#class_imbalanced_data_set). For example,
given a dataset containing 99% negative labels and 1% positive labels, the
positive labels are the minority class.
Contrast with [**majority class**](https://developers.google.com/machine-learning/glossary/fundamentals#majority_class).
#### Click the icon for additional notes.
A training set with a million [examples](https://developers.google.com/machine-learning/glossary/fundamentals#example) sounds
impressive. However, if the minority class is poorly represented,
then even a very large training set might be insufficient. Focus less
on the total number of examples in the dataset and more on the number of
examples in the minority class.
If your dataset doesn't contain enough minority class examples, consider
using [**downsampling**](https://developers.google.com/machine-learning/glossary#downsampling) (the definition
in the second bullet) to supplement the minority class.
*** ** * ** ***
See [Datasets: Imbalanced datasets](https://developers.google.com/machine-learning/crash-course/overfitting/imbalanced-datasets)
in Machine Learning Crash Course for more information.
## model
#fundamentals
In general, any mathematical construct that processes input data and returns
output. Phrased differently, a model is the set of parameters and structure
needed for a system to make predictions.
In [**supervised machine learning**](https://developers.google.com/machine-learning/glossary/fundamentals#supervised_machine_learning),
a model takes an [**example**](https://developers.google.com/machine-learning/glossary/fundamentals#example) as input and infers a
[**prediction**](https://developers.google.com/machine-learning/glossary/fundamentals#prediction) as output. Within supervised machine learning,
models differ somewhat. For example:
- A linear regression model consists of a set of [**weights**](https://developers.google.com/machine-learning/glossary/fundamentals#weight) and a [**bias**](https://developers.google.com/machine-learning/glossary/fundamentals#bias).
- A [**neural network**](https://developers.google.com/machine-learning/glossary/fundamentals#neural-network) model consists of:
- A set of [**hidden layers**](https://developers.google.com/machine-learning/glossary/fundamentals#hidden_layer), each containing one or more [**neurons**](https://developers.google.com/machine-learning/glossary/fundamentals#neuron).
- The weights and bias associated with each neuron.
- A [**decision tree**](https://developers.google.com/machine-learning/glossary#decision-tree) model consists of:
- The shape of the tree; that is, the pattern in which the conditions and leaves are connected.
- The conditions and leaves.
You can save, restore, or make copies of a model.
[**Unsupervised machine learning**](https://developers.google.com/machine-learning/glossary/fundamentals#unsupervised_machine_learning) also
generates models, typically a function that can map an input example to
the most appropriate [**cluster**](https://developers.google.com/machine-learning/glossary#clustering).
#### Click the icon to compare algebraic and programming functions to ML models.
An algebraic function such as the following is a model:
```
f(x, y) = 3x -5xy + y2 + 17
```
The preceding function maps input values (x and y) to
output.
Similarly, a programming function like the following is also a model:
```
def half_of_greater(x, y):
if (x > y):
return(x / 2)
else
return(y / 2)
```
A caller passes arguments to the preceding Python function, and the
Python function generates output (via the return statement).
Although a [**deep neural network**](https://developers.google.com/machine-learning/glossary#deep_neural_network)
has a very different mathematical structure than an algebraic or programming
function, a deep neural network still takes input (an example) and returns
output (a prediction).
A human programmer codes a programming function manually. In contrast,
a machine learning model gradually learns the optimal parameters
during automated training.
*** ** * ** ***
## multi-class classification
#fundamentals
In supervised learning, a [**classification**](https://developers.google.com/machine-learning/glossary/fundamentals#classification_model) problem
in which the dataset contains *more than two* [**classes**](https://developers.google.com/machine-learning/glossary/fundamentals#class) of labels.
For example, the labels in the Iris dataset must be one of the following
three classes:
- Iris setosa
- Iris virginica
- Iris versicolor
A model trained on the Iris dataset that predicts Iris type on new examples
is performing multi-class classification.
In contrast, classification problems that distinguish between exactly two
classes are [**binary classification models**](https://developers.google.com/machine-learning/glossary/fundamentals#binary_classification).
For example, an email model that predicts either *spam* or *not spam*
is a binary classification model.
In clustering problems, multi-class classification refers to more than
two clusters.
See [Neural networks: Multi-class classification](https://developers.google.com/machine-learning/crash-course/neural-networks/multi-class)
in Machine Learning Crash Course for more information.
## N
## negative class
#fundamentals #Metric
In [**binary classification**](https://developers.google.com/machine-learning/glossary/fundamentals#binary_classification), one class is
termed *positive* and the other is termed *negative*. The positive class is
the thing or event that the model is testing for and the negative class is the
other possibility. For example:
- The negative class in a medical test might be "not tumor."
- The negative class in an email [**classification model**](https://developers.google.com/machine-learning/glossary/fundamentals#classification-model) might be "not spam."
Contrast with [**positive class**](https://developers.google.com/machine-learning/glossary/fundamentals#positive_class).
## neural network
#fundamentals
A [**model**](https://developers.google.com/machine-learning/glossary/fundamentals#model) containing at least one
[**hidden layer**](https://developers.google.com/machine-learning/glossary/fundamentals#hidden_layer).
A [**deep neural network**](https://developers.google.com/machine-learning/glossary#deep_neural_network) is a type of neural network
containing more than one hidden layer. For example, the following diagram
shows a deep neural network containing two hidden layers.
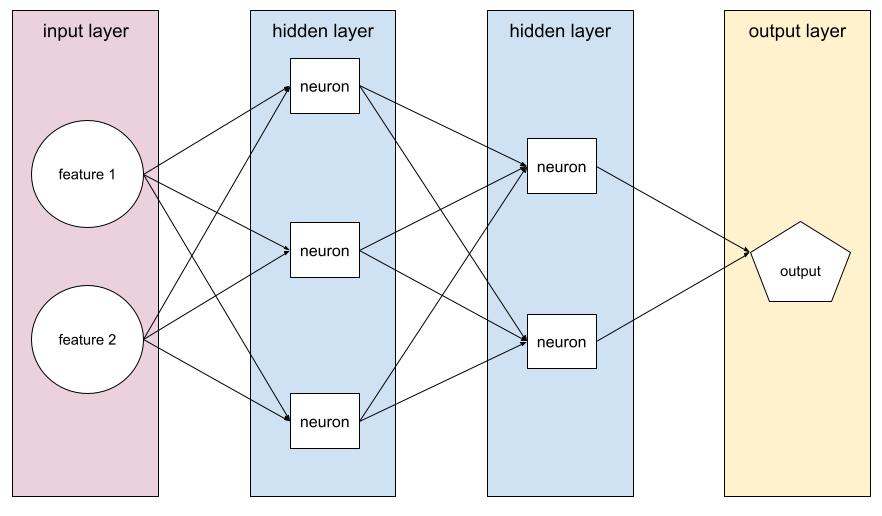
Each neuron in a neural network connects to all of the nodes in the next layer.
For example, in the preceding diagram, notice that each of the three neurons
in the first hidden layer separately connect to both of the two neurons in the
second hidden layer.
Neural networks implemented on computers are sometimes called
**artificial neural networks** to differentiate them from
neural networks found in brains and other nervous systems.
Some neural networks can mimic extremely complex nonlinear relationships
between different features and the label.
See also [**convolutional neural network**](https://developers.google.com/machine-learning/glossary#convolutional_neural_network) and
[**recurrent neural network**](https://developers.google.com/machine-learning/glossary#recurrent_neural_network).
See [Neural networks](https://developers.google.com/machine-learning/crash-course/neural-networks)
in Machine Learning Crash Course for more information.
## neuron
#fundamentals
In machine learning, a distinct unit within a [**hidden layer**](https://developers.google.com/machine-learning/glossary/fundamentals#hidden_layer)
of a [**neural network**](https://developers.google.com/machine-learning/glossary/fundamentals#neural_network). Each neuron performs the following
two-step action:
1. Calculates the [**weighted sum**](https://developers.google.com/machine-learning/glossary/fundamentals#weighted_sum) of input values multiplied by their corresponding weights.
2. Passes the weighted sum as input to an [**activation function**](https://developers.google.com/machine-learning/glossary/fundamentals#activation_function).
A neuron in the first hidden layer accepts inputs from the feature values
in the [**input layer**](https://developers.google.com/machine-learning/glossary/fundamentals#input-layer). A neuron in any hidden layer beyond
the first accepts inputs from the neurons in the preceding hidden layer.
For example, a neuron in the second hidden layer accepts inputs from the
neurons in the first hidden layer.
The following illustration highlights two neurons and their
inputs.
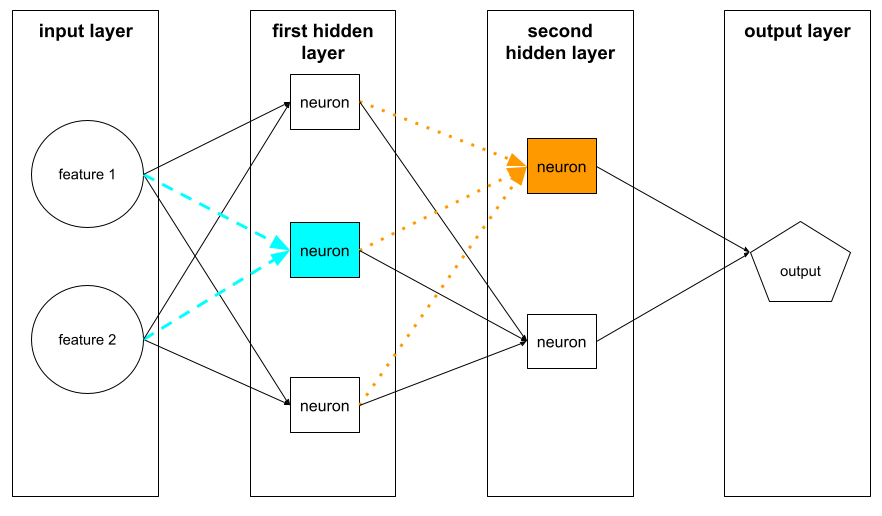
A neuron in a neural network mimics the behavior of neurons in brains and
other parts of nervous systems.
## node (neural network)
#fundamentals
A [**neuron**](https://developers.google.com/machine-learning/glossary/fundamentals#neuron) in a [**hidden layer**](https://developers.google.com/machine-learning/glossary/fundamentals#hidden_layer).
See [Neural Networks](https://developers.google.com/machine-learning/crash-course/neural-networks)
in Machine Learning Crash Course for more information.
## nonlinear
#fundamentals
A relationship between two or more variables that can't be represented solely
through addition and multiplication. A *linear* relationship
can be represented as a line; a *nonlinear* relationship can't be
represented as a line. For example, consider two models that each relate
a single feature to a single label. The model on the left is linear
and the model on the right is nonlinear:
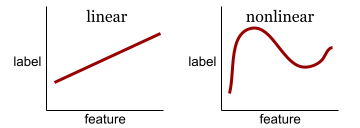
See [Neural networks: Nodes and hidden layers](https://developers.google.com/machine-learning/crash-course/neural-networks/nodes-hidden-layers)
in Machine Learning Crash Course to experiment with different kinds
of nonlinear functions.
## nonstationarity
#fundamentals
A feature whose values change across one or more dimensions, usually time.
For example, consider the following examples of nonstationarity:
- The number of swimsuits sold at a particular store varies with the season.
- The quantity of a particular fruit harvested in a particular region is zero for much of the year but large for a brief period.
- Due to climate change, annual mean temperatures are shifting.
Contrast with [**stationarity**](https://developers.google.com/machine-learning/glossary/fundamentals#stationarity).
## normalization
#fundamentals
Broadly speaking, the process of converting a variable's actual range
of values into a standard range of values, such as:
- -1 to +1
- 0 to 1
- Z-scores (roughly, -3 to +3)
For example, suppose the actual range of values of a certain feature is
800 to 2,400. As part of [**feature engineering**](https://developers.google.com/machine-learning/glossary/fundamentals#feature_engineering),
you could normalize the actual values down to a standard range, such
as -1 to +1.
Normalization is a common task in
[**feature engineering**](https://developers.google.com/machine-learning/glossary/fundamentals#feature_engineering). Models usually train faster
(and produce better predictions) when every numerical feature in the
[**feature vector**](https://developers.google.com/machine-learning/glossary/fundamentals#feature_vector) has roughly the same range.
See also [**Z-score normalization**](https://developers.google.com/machine-learning/glossary/fundamentals#Z-score-normalization).
See [Numerical Data: Normalization](https://developers.google.com/machine-learning/crash-course/numerical-data/normalization)
in Machine Learning Crash Course for more information.
## numerical data
#fundamentals
[**Features**](https://developers.google.com/machine-learning/glossary/fundamentals#feature) represented as integers or real-valued numbers.
For example, a house valuation model would probably represent the size
of a house (in square feet or square meters) as numerical data. Representing
a feature as numerical data indicates that the feature's values have
a *mathematical* relationship to the label.
That is, the number of square meters in a house probably has some
mathematical relationship to the value of the house.
Not all integer data should be represented as numerical data. For example,
postal codes in some parts of the world are integers; however, integer postal
codes shouldn't be represented as numerical data in models. That's because a
postal code of `20000` is not twice (or half) as potent as a postal code of
10000. Furthermore, although different postal codes *do* correlate to different
real estate values, we can't assume that real estate values at postal code
20000 are twice as valuable as real estate values at postal code 10000.
Postal codes should be represented as [**categorical data**](https://developers.google.com/machine-learning/glossary/fundamentals#categorical_data)
instead.
Numerical features are sometimes called
[**continuous features**](https://developers.google.com/machine-learning/glossary/fundamentals#continuous_feature).
See [Working with numerical data](https://developers.google.com/machine-learning/crash-course/numerical-data)
in Machine Learning Crash Course for more information.
## O
## offline
#fundamentals
Synonym for [**static**](https://developers.google.com/machine-learning/glossary/fundamentals#static).
## offline inference
#fundamentals
The process of a model generating a batch of [**predictions**](https://developers.google.com/machine-learning/glossary/fundamentals#prediction)
and then caching (saving) those predictions. Apps can then access the inferred
prediction from the cache rather than rerunning the model.
For example, consider a model that generates local weather forecasts
(predictions) once every four hours. After each model run, the system
caches all the local weather forecasts. Weather apps retrieve the forecasts
from the cache.
Offline inference is also called **static inference**.
Contrast with [**online inference**](https://developers.google.com/machine-learning/glossary/fundamentals#online_inference).
See [Production ML systems: Static versus dynamic inference](https://developers.google.com/machine-learning/crash-course/production-ml-systems/static-vs-dynamic-inference)
in Machine Learning Crash Course for more information.
## one-hot encoding
#fundamentals
Representing categorical data as a vector in which:
- One element is set to 1.
- All other elements are set to 0.
One-hot encoding is commonly used to represent strings or identifiers that
have a finite set of possible values.
For example, suppose a certain categorical feature named
`Scandinavia` has five possible values:
- "Denmark"
- "Sweden"
- "Norway"
- "Finland"
- "Iceland"
One-hot encoding could represent each of the five values as follows:
| Country | Vector |||||
|---|---|---|---|---|---|
| "Denmark" | 1 | 0 | 0 | 0 | 0 |
| "Sweden" | 0 | 1 | 0 | 0 | 0 |
| "Norway" | 0 | 0 | 1 | 0 | 0 |
| "Finland" | 0 | 0 | 0 | 1 | 0 |
| "Iceland" | 0 | 0 | 0 | 0 | 1 |
Thanks to one-hot encoding, a model can learn different connections
based on each of the five countries.
Representing a feature as [**numerical data**](https://developers.google.com/machine-learning/glossary/fundamentals#numerical_data) is an
alternative to one-hot encoding. Unfortunately, representing the
Scandinavian countries numerically is not a good choice. For example,
consider the following numeric representation:
- "Denmark" is 0
- "Sweden" is 1
- "Norway" is 2
- "Finland" is 3
- "Iceland" is 4
With numeric encoding, a model would interpret the raw numbers
mathematically and would try to train on those numbers.
However, Iceland isn't actually twice as much (or half as much) of
something as Norway, so the model would come to some strange conclusions.
See [Categorical data: Vocabulary and one-hot
encoding](https://developers.google.com/machine-learning/crash-course/categorical-data/one-hot-encoding)
in Machine Learning Crash Course for more information.
## one-vs.-all
#fundamentals
Given a classification problem with N classes, a
solution consisting of N separate
[**binary classification**](https://developers.google.com/machine-learning/glossary/fundamentals#binary_classification) model---one binary
classification model for each possible outcome. For example, given a model
that classifies examples as animal, vegetable, or mineral, a one-vs.-all
solution would provide the following three separate binary classification
models:
- animal versus not animal
- vegetable versus not vegetable
- mineral versus not mineral
## online
#fundamentals
Synonym for [**dynamic**](https://developers.google.com/machine-learning/glossary/fundamentals#dynamic).
## online inference
#fundamentals
Generating [**predictions**](https://developers.google.com/machine-learning/glossary/fundamentals#prediction) on demand. For example,
suppose an app passes input to a model and issues a request for a
prediction.
A system using online inference responds to the request by running
the model (and returning the prediction to the app).
Contrast with [**offline inference**](https://developers.google.com/machine-learning/glossary/fundamentals#offline_inference).
See [Production ML systems: Static versus dynamic inference](https://developers.google.com/machine-learning/crash-course/production-ml-systems/static-vs-dynamic-inference)
in Machine Learning Crash Course for more information.
## output layer
#fundamentals
The "final" layer of a neural network. The output layer contains the prediction.
The following illustration shows a small deep neural network with an input
layer, two hidden layers, and an output layer:
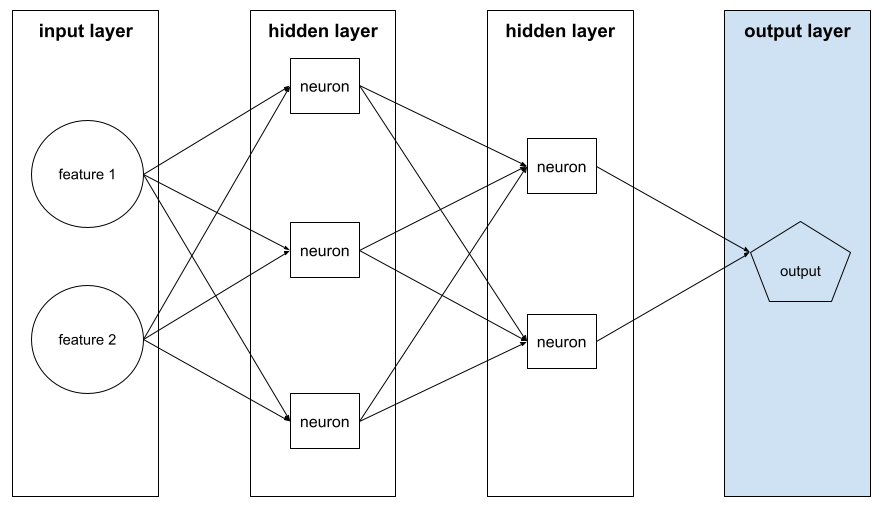
## overfitting
#fundamentals
Creating a [**model**](https://developers.google.com/machine-learning/glossary/fundamentals#model) that matches the
[**training data**](https://developers.google.com/machine-learning/glossary/fundamentals#training_set) so closely that the model fails to
make correct predictions on new data.
[**Regularization**](https://developers.google.com/machine-learning/glossary/fundamentals#regularization) can reduce overfitting.
Training on a large and diverse training set can also reduce overfitting.
#### Click the icon for additional notes.
Overfitting is like strictly following advice from only your favorite
teacher. You'll probably be successful in that teacher's class, but you
might "overfit" to that teacher's ideas and be unsuccessful in other
classes. Following advice from a mixture of teachers will enable you to
adapt better to new situations.
*** ** * ** ***
See [Overfitting](https://developers.google.com/machine-learning/crash-course/overfitting/overfitting)
in Machine Learning Crash Course for more information.
## P
## pandas
#fundamentals
A column-oriented data analysis API built on top of [**numpy**](https://developers.google.com/machine-learning/glossary#numpy).
Many machine learning frameworks,
including TensorFlow, support pandas data structures as inputs. See the
[pandas documentation](http://pandas.pydata.org/)
for details.
## parameter
#fundamentals
The [**weights**](https://developers.google.com/machine-learning/glossary/fundamentals#weight) and [**biases**](https://developers.google.com/machine-learning/glossary/fundamentals#bias) that a model learns during
[**training**](https://developers.google.com/machine-learning/glossary/fundamentals#training). For example, in a
[**linear regression**](https://developers.google.com/machine-learning/glossary/fundamentals#linear_regression) model, the parameters consist of
the bias (*b* ) and all the weights (*w~1~*, *w~2~*,
and so on) in the following formula:
$$y' = b + w_1x_1 + w_2x_2 + ... w_nx_n$$
In contrast, [**hyperparameters**](https://developers.google.com/machine-learning/glossary/fundamentals#hyperparameter) are the values that
*you* (or a hyperparameter tuning service) supply to the model.
For example, [**learning rate**](https://developers.google.com/machine-learning/glossary/fundamentals#learning_rate) is a hyperparameter.
## positive class
#fundamentals #Metric
The class you are testing for.
For example, the positive class in a cancer model might be "tumor."
The positive class in an email [**classification model**](https://developers.google.com/machine-learning/glossary/fundamentals#classification-model)
might be "spam."
Contrast with [**negative class**](https://developers.google.com/machine-learning/glossary/fundamentals#negative_class).
#### Click the icon for additional notes.
The term **positive class** can be confusing because the "positive" outcome
of many tests is often an undesirable result. For example, the positive class in
many medical tests corresponds to tumors or diseases. In general, you want a
doctor to tell you, "Congratulations! Your test results were negative."
Regardless, the positive class is the event that the test is seeking to find.
Admittedly, you're simultaneously testing for both the positive and negative
classes.
*** ** * ** ***
## post-processing
#responsible #fundamentals
Adjusting the output of a model *after* the model has been run.
Post-processing can be used to enforce fairness constraints without
modifying models themselves.
For example, one might apply post-processing to a
[**binary classification model**](https://developers.google.com/machine-learning/glossary/fundamentals#binary-classification) by setting a
[**classification threshold**](https://developers.google.com/machine-learning/glossary/fundamentals#classification-threshold) such that
[**equality of opportunity**](https://developers.google.com/machine-learning/glossary#equality_of_opportunity) is maintained
for some attribute by checking that the [**true positive rate**](https://developers.google.com/machine-learning/glossary/fundamentals#TP_rate)
is the same for all values of that attribute.
## precision
#fundamentals #Metric
A metric for [**classification models**](https://developers.google.com/machine-learning/glossary/fundamentals#classification_model) that answers
the following question:
> When the model predicted the [**positive class**](https://developers.google.com/machine-learning/glossary/fundamentals#positive_class),
> what percentage of the predictions were correct?
Here is the formula:
$$\\text{Precision} = \\frac{\\text{true positives}} {\\text{true positives} + \\text{false positives}}$$
where:
- true positive means the model *correctly* predicted the positive class.
- false positive means the model *mistakenly* predicted the positive class.
For example, suppose a model made 200 positive predictions.
Of these 200 positive predictions:
- 150 were true positives.
- 50 were false positives.
In this case:
$$\\text{Precision} = \\frac{\\text{150}} {\\text{150} + \\text{50}} = 0.75$$
Contrast with [**accuracy**](https://developers.google.com/machine-learning/glossary/fundamentals#accuracy) and [**recall**](https://developers.google.com/machine-learning/glossary/fundamentals#recall).
See [Classification: Accuracy, recall, precision and related
metrics](https://developers.google.com/machine-learning/crash-course/classification/accuracy-precision-recall)
in Machine Learning Crash Course for more information.
## prediction
#fundamentals
A model's output. For example:
- The prediction of a binary classification model is either the positive class or the negative class.
- The prediction of a multi-class classification model is one class.
- The prediction of a linear regression model is a number.
## proxy labels
#fundamentals
Data used to approximate labels not directly available in a dataset.
For example, suppose you must train a model to predict employee
stress level. Your dataset contains a lot of predictive features but
doesn't contain a label named *stress level.*
Undaunted, you pick "workplace accidents" as a proxy label for
stress level. After all, employees under high stress get into more
accidents than calm employees. Or do they? Maybe workplace accidents
actually rise and fall for multiple reasons.
As a second example, suppose you want *is it raining?* to be a Boolean label
for your dataset, but your dataset doesn't contain rain data. If
photographs are available, you might establish pictures of people
carrying umbrellas as a proxy label for *is it raining?* Is that
a good proxy label? Possibly, but people in some cultures may be
more likely to carry umbrellas to protect against sun than the rain.
Proxy labels are often imperfect. When possible, choose actual labels over
proxy labels. That said, when an actual label is absent, pick the proxy
label very carefully, choosing the least horrible proxy label candidate.
See [Datasets: Labels](https://developers.google.com/machine-learning/crash-course/overfitting/labels)
in Machine Learning Crash Course for more information.
## R
## RAG
#fundamentals
Abbreviation for
[**retrieval-augmented generation**](https://developers.google.com/machine-learning/glossary/fundamentals#retrieval-augmented_generation).
## rater
#fundamentals
A human who provides [**labels**](https://developers.google.com/machine-learning/glossary/fundamentals#label) for [**examples**](https://developers.google.com/machine-learning/glossary/fundamentals#example).
"Annotator" is another name for rater.
See [Categorical data: Common issues](https://developers.google.com/machine-learning/crash-course/categorical-data/issues)
in Machine Learning Crash Course for more information.
## recall
#fundamentals #Metric
A metric for [**classification models**](https://developers.google.com/machine-learning/glossary/fundamentals#classification_model) that answers
the following question:
> When [**ground truth**](https://developers.google.com/machine-learning/glossary/fundamentals#ground_truth) was the
> [**positive class**](https://developers.google.com/machine-learning/glossary/fundamentals#positive_class), what percentage of predictions did
> the model correctly identify as the positive class?
Here is the formula:
\\\[\\text{Recall} =
\\frac{\\text{true positives}} {\\text{true positives} + \\text{false negatives}}
\\\]
where:
- true positive means the model *correctly* predicted the positive class.
- false negative means that the model *mistakenly* predicted the [**negative class**](https://developers.google.com/machine-learning/glossary/fundamentals#negative_class).
For instance, suppose your model made 200 predictions on examples for which
ground truth was the positive class. Of these 200 predictions:
- 180 were true positives.
- 20 were false negatives.
In this case:
\\\[\\text{Recall} =
\\frac{\\text{180}} {\\text{180} + \\text{20}} = 0.9
\\\]
#### Click the icon for notes about class-imbalanced datasets.
Recall is particularly useful for determining the predictive power of
classification models in which the positive class is rare. For example, consider
a [**class-imbalanced dataset**](https://developers.google.com/machine-learning/glossary/fundamentals#class_imbalanced_data_set)
in which the positive class for a certain disease occurs in only 10 patients
out of a million. Suppose your model makes five million predictions that yield
the following outcomes:
- 30 True Positives
- 20 False Negatives
- 4,999,000 True Negatives
- 950 False Positives
The recall of this model is therefore:
```
recall = TP / (TP + FN)
recall = 30 / (30 + 20) = 0.6 = 60%
```
By contrast, the [**accuracy**](https://developers.google.com/machine-learning/glossary/fundamentals#accuracy) of this model is:
```
accuracy = (TP + TN) / (TP + TN + FP + FN)
accuracy = (30 + 4,999,000) / (30 + 4,999,000 + 950 + 20) = 99.98%
```
That high value of accuracy looks impressive but is essentially meaningless.
Recall is a much more useful metric for class-imbalanced datasets than accuracy.
*** ** * ** ***
See [Classification: Accuracy, recall, precision and related
metrics](https://developers.google.com/machine-learning/crash-course/classification/accuracy-precision-recall)
for more information.
## Rectified Linear Unit (ReLU)
#fundamentals
An [**activation function**](https://developers.google.com/machine-learning/glossary/fundamentals#activation_function) with the following behavior:
- If input is negative or zero, then the output is 0.
- If input is positive, then the output is equal to the input.
For example:
- If the input is -3, then the output is 0.
- If the input is +3, then the output is 3.0.
Here is a plot of ReLU:
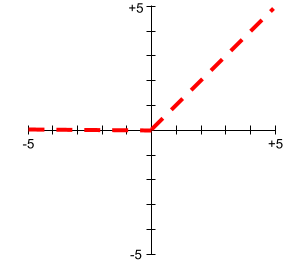
ReLU is a very popular activation function. Despite its simple behavior,
ReLU still enables a neural network to learn [**nonlinear**](https://developers.google.com/machine-learning/glossary/fundamentals#nonlinear)
relationships between [**features**](https://developers.google.com/machine-learning/glossary/fundamentals#feature) and the [**label**](https://developers.google.com/machine-learning/glossary/fundamentals#label).
## regression model
#fundamentals
Informally, a model that generates a numerical prediction. (In contrast,
a [**classification model**](https://developers.google.com/machine-learning/glossary/fundamentals#classification_model) generates a class
prediction.) For example, the following are all regression models:
- A model that predicts a certain house's value in Euros, such as 423,000.
- A model that predicts a certain tree's life expectancy in years, such as 23.2.
- A model that predicts the amount of rain in inches that will fall in a certain city over the next six hours, such as 0.18.
Two common types of regression models are:
- [**Linear regression**](https://developers.google.com/machine-learning/glossary/fundamentals#linear_regression), which finds the line that best fits label values to features.
- [**Logistic regression**](https://developers.google.com/machine-learning/glossary/fundamentals#logistic_regression), which generates a probability between 0.0 and 1.0 that a system typically then maps to a class prediction.
Not every model that outputs numerical predictions is a regression model.
In some cases, a numeric prediction is really just a classification model
that happens to have numeric class names. For example, a model that predicts
a numeric postal code is a classification model, not a regression model.
## regularization
#fundamentals
Any mechanism that reduces [**overfitting**](https://developers.google.com/machine-learning/glossary/fundamentals#overfitting).
Popular types of regularization include:
- [**L~1~ regularization**](https://developers.google.com/machine-learning/glossary/fundamentals#L1_regularization)
- [**L~2~ regularization**](https://developers.google.com/machine-learning/glossary/fundamentals#L2_regularization)
- [**dropout regularization**](https://developers.google.com/machine-learning/glossary#dropout_regularization)
- [**early stopping**](https://developers.google.com/machine-learning/glossary/fundamentals#early_stopping) (this is not a formal regularization method, but can effectively limit overfitting)
Regularization can also be defined as the penalty on a model's complexity.
#### Click the icon for additional notes.
Regularization is counterintuitive. Increasing regularization usually
*increases* training loss, which is confusing because, well, isn't
the goal to *minimize* training loss?
Actually, no. The goal isn't to minimize training loss. The goal is to
make excellent predictions on real-world examples. Remarkably, even though
increasing regularization increases training loss, it usually helps models make
better predictions on real-world examples.
*** ** * ** ***
See [Overfitting: Model complexity](https://developers.google.com/machine-learning/crash-course/overfitting/model-complexity)
in Machine Learning Crash Course for more information.
## regularization rate
#fundamentals
A number that specifies the relative importance of
[**regularization**](https://developers.google.com/machine-learning/glossary/fundamentals#regularization) during training. Raising the
regularization rate reduces [**overfitting**](https://developers.google.com/machine-learning/glossary/fundamentals#overfitting) but may
reduce the model's predictive power. Conversely, reducing or omitting
the regularization rate increases overfitting.
#### Click the icon to see the math.
The regularization rate is usually represented as the Greek letter lambda.
The following simplified [**loss**](https://developers.google.com/machine-learning/glossary/fundamentals#loss) equation shows
lambda's influence:
$$\\text{minimize(loss function + }\\lambda\\text{(regularization))}$$
where *regularization* is any regularization mechanism, including;
- [**L~1~ regularization**](https://developers.google.com/machine-learning/glossary/fundamentals#L1_regularization)
- [**L~2~ regularization**](https://developers.google.com/machine-learning/glossary/fundamentals#L2_regularization)
*** ** * ** ***
See [Overfitting: L2
regularization](https://developers.google.com/machine-learning/crash-course/overfitting/regularization)
in Machine Learning Crash Course for more information.
## ReLU
#fundamentals
Abbreviation for [**Rectified Linear Unit**](https://developers.google.com/machine-learning/glossary/fundamentals#ReLU).
## retrieval-augmented generation (RAG)
#fundamentals
A technique for improving the quality of
[**large language model (LLM)**](https://developers.google.com/machine-learning/glossary#large-language-model) output
by grounding it with sources of knowledge retrieved after the model was trained.
RAG improves the accuracy of LLM [**responses**](https://developers.google.com/machine-learning/glossary#response) by providing the
trained LLM with access to information retrieved from trusted knowledge bases
or documents.
Common motivations to use retrieval-augmented generation include:
- Increasing the factual accuracy of a model's generated responses.
- Giving the model access to knowledge it was not trained on.
- Changing the knowledge that the model uses.
- Enabling the model to cite sources.
For example, suppose that a chemistry app uses the [PaLM
API](https://developers.generativeai.google/products/palm) to generate summaries
related to user queries. When the app's backend receives a query, the backend:
1. Searches for ("retrieves") data that's relevant to the user's query.
2. Appends ("augments") the relevant chemistry data to the user's query.
3. Instructs the LLM to create a summary based on the appended data.
## ROC (receiver operating characteristic) Curve
#fundamentals #Metric
A graph of [**true positive rate**](https://developers.google.com/machine-learning/glossary/fundamentals#TP_rate) versus
[**false positive rate**](https://developers.google.com/machine-learning/glossary/fundamentals#FP_rate) for different
[**classification thresholds**](https://developers.google.com/machine-learning/glossary/fundamentals#classification_threshold) in binary
classification.
The shape of an ROC curve suggests a binary classification model's ability
to separate positive classes from negative classes. Suppose, for example,
that a binary classification model perfectly separates all the negative
classes from all the positive classes:
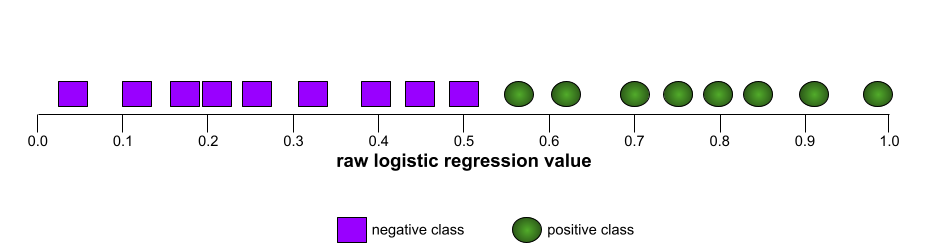
The ROC curve for the preceding model looks as follows:
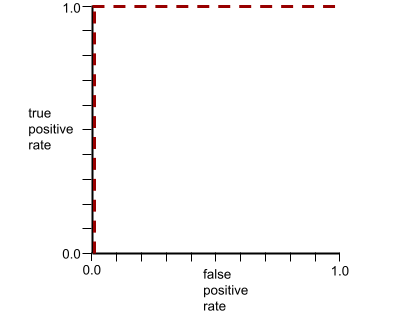
In contrast, the following illustration graphs the raw logistic regression
values for a terrible model that can't separate negative classes from
positive classes at all:
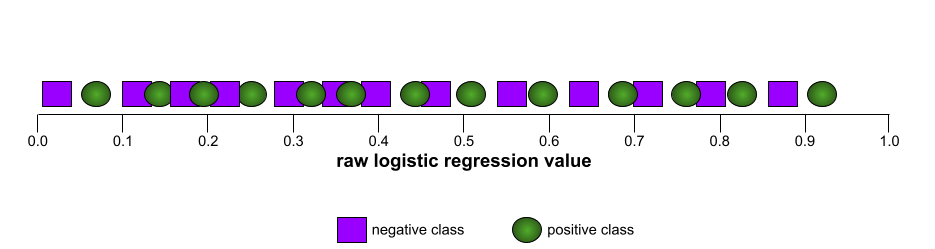
The ROC curve for this model looks as follows:
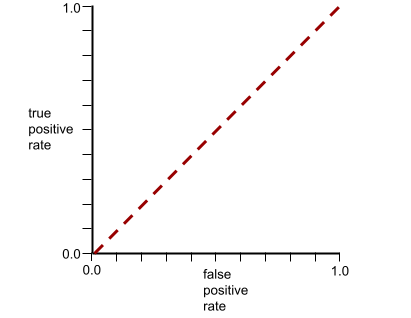
Meanwhile, back in the real world, most binary classification models separate
positive and negative classes to some degree, but usually not perfectly. So,
a typical ROC curve falls somewhere between the two extremes:

The point on an ROC curve closest to (0.0,1.0) theoretically identifies the
ideal classification threshold. However, several other real-world issues
influence the selection of the ideal classification threshold. For example,
perhaps false negatives cause far more pain than false positives.
A numerical metric called [**AUC**](https://developers.google.com/machine-learning/glossary/fundamentals#AUC) summarizes the ROC curve into
a single floating-point value.
## Root Mean Squared Error (RMSE)
#fundamentals #Metric
The square root of the [**Mean Squared Error**](https://developers.google.com/machine-learning/glossary#MSE).
## S
## sigmoid function
#fundamentals
A mathematical function that "squishes" an input value into a constrained range,
typically 0 to 1 or -1 to +1. That is, you can pass any number (two, a million,
negative billion, whatever) to a sigmoid and the output will still be in the
constrained range.
A plot of the sigmoid activation function looks as follows:

The sigmoid function has several uses in machine learning, including:
- Converting the raw output of a [**logistic regression**](https://developers.google.com/machine-learning/glossary/fundamentals#logistic_regression) or [**multinomial regression**](https://developers.google.com/machine-learning/glossary#multinomial-regression) model to a probability.
- Acting as an [**activation function**](https://developers.google.com/machine-learning/glossary/fundamentals#activation_function) in some neural networks.
#### Click the icon to see the math.
The sigmoid function over an input number *x* has the following formula:
$$ sigmoid(x) = \\frac{1}{1 + e\^{-\\text{x}}} $$
In machine learning, *x* is generally a
[**weighted sum**](https://developers.google.com/machine-learning/glossary/fundamentals#weighted_sum).
*** ** * ** ***
## softmax
#fundamentals
A function that determines probabilities for each possible class in a
[**multi-class classification model**](https://developers.google.com/machine-learning/glossary/fundamentals#multi-class). The probabilities add up
to exactly 1.0. For example, the following table shows how softmax distributes
various probabilities:
| Image is a... | Probability |
|---|---|
| dog | .85 |
| cat | .13 |
| horse | .02 |
Softmax is also called **full softmax**.
Contrast with [**candidate sampling**](https://developers.google.com/machine-learning/glossary#candidate_sampling).
#### Click the icon to see the math.
The softmax equation is as follows:
$$\\sigma_i = \\frac{e\^{\\text{z}_i}} {\\sum_{j=1}\^{j=K} {e\^{\\text{z}_j}}} $$ where:
- $\\sigma_i$ is the output vector. Each element of the output vector specifies the probability of this element. The sum of all the elements in the output vector is 1.0. The output vector contains the same number of elements as the input vector, $z$.
- $z$ is the input vector. Each element of the input vector contains a floating-point value.
- $K$ is the number of elements in the input vector (and the output vector).
For example, suppose the input vector is:
```
[1.2, 2.5, 1.8]
```
Therefore, softmax calculates the denominator as follows:
$$\\text{denominator} = e\^{1.2} + e\^{2.5} + e\^{1.8} = 21.552$$
The softmax probability of each element is therefore:
$$\\sigma_1 = \\frac{e\^{1.2}}{21.552} = 0.154 $$ $$\\sigma_2 = \\frac{e\^{2.5}}{21.552} = 0.565 $$ $$\\sigma_1 = \\frac{e\^{1.8}}{21.552} = 0.281 $$
So, the output vector is therefore:
$$\\sigma = \[0.154, 0.565, 0.281\]$$
The sum of the three elements in $\\sigma$ is 1.0. Phew!
*** ** * ** ***
See [Neural networks: Multi-class classification](https://developers.google.com/machine-learning/crash-course/neural-networks/multi-class)
in Machine Learning Crash Course for more information.
## sparse feature
#fundamentals
A [**feature**](https://developers.google.com/machine-learning/glossary/fundamentals#feature) whose values are predominately zero or empty.
For example, a feature containing a single 1 value and a million 0 values is
sparse. In contrast, a [**dense feature**](https://developers.google.com/machine-learning/glossary/fundamentals#dense_feature) has values that
are predominantly not zero or empty.
In machine learning, a surprising number of features are sparse features.
Categorical features are usually sparse features.
For example, of the 300 possible tree species in a forest, a single example
might identify just a *maple tree*. Or, of the millions
of possible videos in a video library, a single example might identify
just "Casablanca."
In a model, you typically represent sparse features with
[**one-hot encoding**](https://developers.google.com/machine-learning/glossary/fundamentals#one-hot_encoding). If the one-hot encoding is big,
you might put an [**embedding layer**](https://developers.google.com/machine-learning/glossary/fundamentals#embedding_layer) on top of the
one-hot encoding for greater efficiency.
## sparse representation
#fundamentals
Storing only the *position(s)* of nonzero elements in a sparse feature.
For example, suppose a categorical feature named `species` identifies the 36
tree species in a particular forest. Further assume that each
[**example**](https://developers.google.com/machine-learning/glossary/fundamentals#example) identifies only a single species.
You could use a one-hot vector to represent the tree species in each example.
A one-hot vector would contain a single `1` (to represent
the particular tree species in that example) and 35 `0`s (to represent the
35 tree species *not* in that example). So, the one-hot representation
of `maple` might look something like the following:

Alternatively, sparse representation would simply identify the position of the
particular species. If `maple` is at position 24, then the sparse representation
of `maple` would simply be:
```
24
```
Notice that the sparse representation is much more compact than the one-hot
representation.
> [!NOTE]
> **Note:** You shouldn't pass a sparse representation as a direct feature input to a model. Instead, you should convert the sparse representation into a one-hot representation before training on it.
#### Click the icon for a slightly more complex example.
Suppose each example in your model must represent the words---but not
the order of those words---in an English sentence.
English consists of about 170,000 words, so English is a categorical
feature with about 170,000 elements. Most English sentences use an
extremely tiny fraction of those 170,000 words, so the set of words in a
single example is almost certainly going to be sparse data.
Consider the following sentence:
```
My dog is a great dog
```
You could use a variant of one-hot vector to represent the words in this
sentence. In this variant, multiple cells in the vector can contain
a nonzero value. Furthermore, in this variant, a cell can contain an integer
other than one. Although the words "my", "is", "a", and "great" appear only
once in the sentence, the word "dog" appears twice. Using this variant of
one-hot vectors to represent the words in this sentence yields the following
170,000-element vector:

A sparse representation of the same sentence would simply be:
```
0: 1
26100: 2
45770: 1
58906: 1
91520: 1
```
*** ** * ** ***
#### Click the icon if you are confused.
The term "sparse representation" confuses a lot of people because sparse
representation is itself *not a sparse vector*. Rather, sparse
representation is actually a *dense representation of a sparse vector*.
The synonym **index representation** is a little clearer than
"sparse representation."
*** ** * ** ***
See [Working with categorical data](https://developers.google.com/machine-learning/crash-course/categorical-data)
in Machine Learning Crash Course for more information.
## sparse vector
#fundamentals
A vector whose values are mostly zeroes. See also [**sparse
feature**](https://developers.google.com/machine-learning/glossary/fundamentals#sparse_features) and [**sparsity**](https://developers.google.com/machine-learning/glossary#sparsity).
## squared loss
#fundamentals #Metric
Synonym for [**L~2~ loss**](https://developers.google.com/machine-learning/glossary/fundamentals#L2_loss).
## static
#fundamentals
Something done once rather than continuously.
The terms **static** and **offline** are synonyms.
The following are common uses of **static** and **offline** in machine
learning:
- **static model** (or **offline model**) is a model trained once and then used for a while.
- **static training** (or **offline training**) is the process of training a static model.
- **static inference** (or **offline inference**) is a process in which a model generates a batch of predictions at a time.
Contrast with [**dynamic**](https://developers.google.com/machine-learning/glossary/fundamentals#dynamic).
## static inference
#fundamentals
Synonym for [**offline inference**](https://developers.google.com/machine-learning/glossary/fundamentals#offline_inference).
## stationarity
#fundamentals
A feature whose values don't change across one or more dimensions, usually time.
For example, a feature whose values look about the same in 2021 and
2023 exhibits stationarity.
In the real world, very few features exhibit stationarity. Even features
synonymous with stability (like sea level) change over time.
Contrast with [**nonstationarity**](https://developers.google.com/machine-learning/glossary/fundamentals#nonstationarity).
## stochastic gradient descent (SGD)
#fundamentals
A [**gradient descent**](https://developers.google.com/machine-learning/glossary/fundamentals#gradient_descent) algorithm in which the
[**batch size**](https://developers.google.com/machine-learning/glossary/fundamentals#batch_size) is one. In other words, SGD trains on
a single example chosen uniformly at
random from a [**training set**](https://developers.google.com/machine-learning/glossary/fundamentals#training_set).
See [Linear regression: Hyperparameters](https://developers.google.com/machine-learning/crash-course/linear-regression/hyperparameters)
in Machine Learning Crash Course for more information.
## supervised machine learning
#fundamentals
Training a [**model**](https://developers.google.com/machine-learning/glossary/fundamentals#model) from [**features**](https://developers.google.com/machine-learning/glossary/fundamentals#feature) and their
corresponding [**labels**](https://developers.google.com/machine-learning/glossary/fundamentals#label). Supervised machine learning is analogous
to learning a subject by studying a set of questions and their
corresponding answers. After mastering the mapping between questions and
answers, a student can then provide answers to new (never-before-seen)
questions on the same topic.
Compare with
[**unsupervised machine learning**](https://developers.google.com/machine-learning/glossary/fundamentals#unsupervised_machine_learning).
See [Supervised Learning](https://developers.google.com/machine-learning/intro-to-ml/supervised)
in the Introduction to ML course for more information.
## synthetic feature
#fundamentals
A [**feature**](https://developers.google.com/machine-learning/glossary/fundamentals#feature) not present among the input features, but
assembled from one or more of them. Methods for creating synthetic features
include the following:
- [**Bucketing**](https://developers.google.com/machine-learning/glossary/fundamentals#bucketing) a continuous feature into range bins.
- Creating a [**feature cross**](https://developers.google.com/machine-learning/glossary/fundamentals#feature_cross).
- Multiplying (or dividing) one feature value by other feature value(s) or by itself. For example, if `a` and `b` are input features, then the following are examples of synthetic features:
- ab
- a^2^
- Applying a transcendental function to a feature value. For example, if `c` is an input feature, then the following are examples of synthetic features:
- sin(c)
- ln(c)
Features created by [**normalizing**](https://developers.google.com/machine-learning/glossary/fundamentals#normalization) or [**scaling**](https://developers.google.com/machine-learning/glossary#scaling)
alone are not considered synthetic features.
## T
## test loss
#fundamentals #Metric
A [**metric**](https://developers.google.com/machine-learning/glossary#metric) representing a model's [**loss**](https://developers.google.com/machine-learning/glossary/fundamentals#loss) against
the [**test set**](https://developers.google.com/machine-learning/glossary#test_set). When building a [**model**](https://developers.google.com/machine-learning/glossary/fundamentals#model), you
typically try to minimize test loss. That's because a low test loss is a
stronger quality signal than a low [**training loss**](https://developers.google.com/machine-learning/glossary/fundamentals#training-loss) or
low [**validation loss**](https://developers.google.com/machine-learning/glossary/fundamentals#validation-loss).
A large gap between test loss and training loss or validation loss sometimes
suggests that you need to increase the
[**regularization rate**](https://developers.google.com/machine-learning/glossary/fundamentals#regularization_rate).
## training
#fundamentals
The process of determining the ideal [**parameters**](https://developers.google.com/machine-learning/glossary/fundamentals#parameter) (weights and
biases) comprising a [**model**](https://developers.google.com/machine-learning/glossary/fundamentals#model). During training, a system reads in
[**examples**](https://developers.google.com/machine-learning/glossary/fundamentals#example) and gradually adjusts parameters. Training uses each
example anywhere from a few times to billions of times.
See [Supervised Learning](https://developers.google.com/machine-learning/intro-to-ml/supervised)
in the Introduction to ML course for more information.
## training loss
#fundamentals #Metric
A [**metric**](https://developers.google.com/machine-learning/glossary#metric) representing a model's [**loss**](https://developers.google.com/machine-learning/glossary/fundamentals#loss) during a
particular training iteration. For example, suppose the loss function
is [**Mean Squared Error**](https://developers.google.com/machine-learning/glossary#MSE). Perhaps the training loss (the Mean
Squared Error) for the 10th iteration is 2.2, and the training loss for
the 100th iteration is 1.9.
A [**loss curve**](https://developers.google.com/machine-learning/glossary/fundamentals#loss_curve) plots training loss versus the number of
iterations. A loss curve provides the following hints about training:
- A downward slope implies that the model is improving.
- An upward slope implies that the model is getting worse.
- A flat slope implies that the model has reached [**convergence**](https://developers.google.com/machine-learning/glossary/fundamentals#convergence).
For example, the following somewhat idealized [**loss curve**](https://developers.google.com/machine-learning/glossary/fundamentals#loss_curve)
shows:
- A steep downward slope during the initial iterations, which implies rapid model improvement.
- A gradually flattening (but still downward) slope until close to the end of training, which implies continued model improvement at a somewhat slower pace then during the initial iterations.
- A flat slope towards the end of training, which suggests convergence.
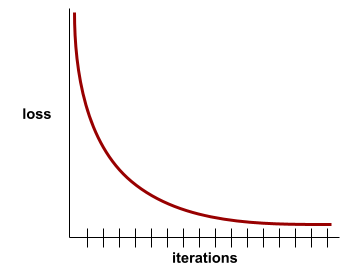
Although training loss is important, see also
[**generalization**](https://developers.google.com/machine-learning/glossary/fundamentals#generalization).
## training-serving skew
#fundamentals
The difference between a model's performance during
[**training**](https://developers.google.com/machine-learning/glossary/fundamentals#training) and that same model's performance during
[**serving**](https://developers.google.com/machine-learning/glossary#serving).
## training set
#fundamentals
The subset of the [**dataset**](https://developers.google.com/machine-learning/glossary/fundamentals#dataset) used to train a [**model**](https://developers.google.com/machine-learning/glossary/fundamentals#model).
Traditionally, examples in the dataset are divided into the following three
distinct subsets:
- a training set
- a [**validation set**](https://developers.google.com/machine-learning/glossary/fundamentals#validation_set)
- a [**test set**](https://developers.google.com/machine-learning/glossary#test_set)
Ideally, each example in the dataset should belong to only one of the
preceding subsets. For example, a single example shouldn't belong to
both the training set and the validation set.
See [Datasets: Dividing the original dataset](https://developers.google.com/machine-learning/crash-course/overfitting/dividing-datasets)
in Machine Learning Crash Course for more information.
## true negative (TN)
#fundamentals #Metric
An example in which the model *correctly* predicts the
[**negative class**](https://developers.google.com/machine-learning/glossary/fundamentals#negative_class). For example, the model infers that
a particular email message is *not spam* , and that email message really is
*not spam*.
## true positive (TP)
#fundamentals #Metric
An example in which the model *correctly* predicts the
[**positive class**](https://developers.google.com/machine-learning/glossary/fundamentals#positive_class). For example, the model infers that
a particular email message is spam, and that email message really is spam.
## true positive rate (TPR)
#fundamentals #Metric
Synonym for [**recall**](https://developers.google.com/machine-learning/glossary/fundamentals#recall). That is:
$$\\text{true positive rate} = \\frac {\\text{true positives}} {\\text{true positives} + \\text{false negatives}}$$
True positive rate is the y-axis in an [**ROC curve**](https://developers.google.com/machine-learning/glossary/fundamentals#ROC).
## U
## underfitting
#fundamentals
Producing a [**model**](https://developers.google.com/machine-learning/glossary/fundamentals#model) with poor predictive ability because the model
hasn't fully captured the complexity of the training data. Many problems
can cause underfitting, including:
- Training on the wrong set of [**features**](https://developers.google.com/machine-learning/glossary/fundamentals#feature).
- Training for too few [**epochs**](https://developers.google.com/machine-learning/glossary/fundamentals#epoch) or at too low a [**learning rate**](https://developers.google.com/machine-learning/glossary/fundamentals#learning_rate).
- Training with too high a [**regularization rate**](https://developers.google.com/machine-learning/glossary/fundamentals#regularization_rate).
- Providing too few [**hidden layers**](https://developers.google.com/machine-learning/glossary/fundamentals#hidden_layer) in a deep neural network.
See [Overfitting](https://developers.google.com/machine-learning/crash-course/overfitting/overfitting)
in Machine Learning Crash Course for more information.
## unlabeled example
#fundamentals
An example that contains [**features**](https://developers.google.com/machine-learning/glossary/fundamentals#feature) but no [**label**](https://developers.google.com/machine-learning/glossary/fundamentals#label).
For example, the following table shows three unlabeled examples from a house
valuation model, each with three features but no house value:
| Number of bedrooms | Number of bathrooms | House age |
|---|---|---|
| 3 | 2 | 15 |
| 2 | 1 | 72 |
| 4 | 2 | 34 |
In [**supervised machine learning**](https://developers.google.com/machine-learning/glossary/fundamentals#supervised_machine_learning),
models train on labeled examples and make predictions on
[**unlabeled examples**](https://developers.google.com/machine-learning/glossary/fundamentals#unlabeled_example).
In [**semi-supervised**](https://developers.google.com/machine-learning/glossary#semi-supervised_learning) and
[**unsupervised**](https://developers.google.com/machine-learning/glossary/fundamentals#unsupervised_machine_learning) learning,
unlabeled examples are used during training.
Contrast unlabeled example with [**labeled example**](https://developers.google.com/machine-learning/glossary/fundamentals#labeled_example).
## unsupervised machine learning
#clustering #fundamentals
Training a [**model**](https://developers.google.com/machine-learning/glossary/fundamentals#model) to find patterns in a dataset, typically an
unlabeled dataset.
The most common use of unsupervised machine learning is to
[**cluster**](https://developers.google.com/machine-learning/glossary#clustering) data
into groups of similar examples. For example, an unsupervised machine
learning algorithm can cluster songs based on various properties
of the music. The resulting clusters can become an input to other machine
learning algorithms (for example, to a music recommendation service).
Clustering can help when useful labels are scarce or absent.
For example, in domains such as anti-abuse and fraud, clusters can help
humans better understand the data.
Contrast with [**supervised machine learning**](https://developers.google.com/machine-learning/glossary/fundamentals#supervised_machine_learning).
#### Click the icon for additional notes.
Another example of unsupervised machine learning is
[principal component analysis (PCA)](https://wikipedia.org/wiki/Principal_component_analysis).
For example, applying PCA on a
dataset containing the contents of millions of shopping carts might reveal
that shopping carts containing lemons frequently also contain antacids.
*** ** * ** ***
See [What is Machine Learning?](https://developers.google.com/machine-learning/intro-to-ml/what-is-ml)
in the Introduction to ML course for more information.
## V
## validation
#fundamentals
The initial evaluation of a model's quality.
Validation checks the quality of a model's predictions against the
[**validation set**](https://developers.google.com/machine-learning/glossary/fundamentals#validation_set).
Because the validation set differs from the [**training set**](https://developers.google.com/machine-learning/glossary/fundamentals#training_set),
validation helps guard against [**overfitting**](https://developers.google.com/machine-learning/glossary/fundamentals#overfitting).
You might think of evaluating the model against the validation set as the
first round of testing and evaluating the model against the
[**test set**](https://developers.google.com/machine-learning/glossary#test_set) as the second round of testing.
## validation loss
#fundamentals #Metric
A [**metric**](https://developers.google.com/machine-learning/glossary#metric) representing a model's [**loss**](https://developers.google.com/machine-learning/glossary/fundamentals#loss) on
the [**validation set**](https://developers.google.com/machine-learning/glossary/fundamentals#validation_set) during a particular
[**iteration**](https://developers.google.com/machine-learning/glossary/fundamentals#iteration) of training.
See also [**generalization curve**](https://developers.google.com/machine-learning/glossary/fundamentals#generalization_curve).
## validation set
#fundamentals
The subset of the [**dataset**](https://developers.google.com/machine-learning/glossary/fundamentals#dataset) that performs initial
evaluation against a trained [**model**](https://developers.google.com/machine-learning/glossary/fundamentals#model). Typically, you evaluate
the trained model against the [**validation set**](https://developers.google.com/machine-learning/glossary/fundamentals#validation_set) several
times before evaluating the model against the [**test set**](https://developers.google.com/machine-learning/glossary#test_set).
Traditionally, you divide the examples in the dataset into the following three
distinct subsets:
- a [**training set**](https://developers.google.com/machine-learning/glossary/fundamentals#training_set)
- a validation set
- a [**test set**](https://developers.google.com/machine-learning/glossary#test_set)
Ideally, each example in the dataset should belong to only one of the
preceding subsets. For example, a single example shouldn't belong to
both the training set and the validation set.
See [Datasets: Dividing the original dataset](https://developers.google.com/machine-learning/crash-course/overfitting/dividing-datasets)
in Machine Learning Crash Course for more information.
## W
## weight
#fundamentals
A value that a model multiplies by another value.
[**Training**](https://developers.google.com/machine-learning/glossary/fundamentals#training) is the process of determining a model's ideal weights;
[**inference**](https://developers.google.com/machine-learning/glossary/fundamentals#inference) is the process of using those learned weights to
make predictions.
#### Click the icon to see an example of weights in a linear model.
Imagine a [**linear model**](https://developers.google.com/machine-learning/glossary/fundamentals#linear_model) with two features.
Suppose that training determines the following weights (and
[bias](https://developers.google.com/machine-learning/glossary/fundamentals#bias)):
- The bias, b, has a value of 2.2
- The weight, w~1~ associated with one feature is 1.5.
- The weight, w~2~ associated with the other feature is 0.4.
Now imagine an [example](https://developers.google.com/machine-learning/glossary/fundamentals#example) with the following feature
values:
- The value of one feature, x~1~, is 6.
- The value of the other feature, x~2~, is 10.
This linear model uses the following formula to generate a prediction,
y':
$$y' = b + w_1x_1 + w_2x_2$$
Therefore, the prediction is:
$$y' = 2.2 + (1.5)(6) + (0.4)(10) = 15.2$$
If a weight is 0, then the corresponding feature doesn't contribute to
the model. For example, if w~1~ is 0, then the value of x~1~
is irrelevant.
*** ** * ** ***
See [Linear regression](https://developers.google.com/machine-learning/crash-course/linear-regression)
in Machine Learning Crash Course for more information.
## weighted sum
#fundamentals
The sum of all the relevant input values multiplied by their corresponding
weights. For example, suppose the relevant inputs consist of the following:
|---|---|
| input value | input weight |
| 2 | -1.3 |
| -1 | 0.6 |
| 3 | 0.4 |
The weighted sum is therefore:
```
weighted sum = (2)(-1.3) + (-1)(0.6) + (3)(0.4) = -2.0
```
A weighted sum is the input argument to an
[**activation function**](https://developers.google.com/machine-learning/glossary/fundamentals#activation_function).
## Z
## Z-score normalization
#fundamentals
A [**scaling**](https://developers.google.com/machine-learning/glossary#scaling) technique that replaces a raw
[**feature**](https://developers.google.com/machine-learning/glossary/fundamentals#feature) value with a floating-point value representing
the number of standard deviations from that feature's mean.
For example, consider a feature whose mean is 800 and whose standard
deviation is 100. The following table shows how Z-score normalization
would map the raw value to its Z-score:
| Raw value | Z-score |
|---|---|
| 800 | 0 |
| 950 | +1.5 |
| 575 | -2.25 |
The machine learning model then trains on the Z-scores
for that feature instead of on the raw values.
See [Numerical data: Normalization](https://developers.google.com/machine-learning/crash-course/numerical-data/normalization)
in Machine Learning Crash Course for more information.