This page contains Metrics glossary terms. For all glossary terms,
[click here](https://developers.google.com/machine-learning/glossary).
## A
## accuracy
#fundamentals #Metric
The number of correct classification [**predictions**](https://developers.google.com/machine-learning/glossary#prediction) divided
by the total number of predictions. That is:
$$\\text{Accuracy} = \\frac{\\text{correct predictions}} {\\text{correct predictions + incorrect predictions }}$$
For example, a model that made 40 correct predictions and 10 incorrect
predictions would have an accuracy of:
$$\\text{Accuracy} = \\frac{\\text{40}} {\\text{40 + 10}} = \\text{80%}$$
[**Binary classification**](https://developers.google.com/machine-learning/glossary#binary_classification) provides specific names
for the different categories of *correct predictions* and
*incorrect predictions*. So, the accuracy formula for binary classification
is as follows:
$$\\text{Accuracy} = \\frac{\\text{TP} + \\text{TN}} {\\text{TP} + \\text{TN} + \\text{FP} + \\text{FN}}$$
where:
- TP is the number of [**true positives**](https://developers.google.com/machine-learning/glossary/metrics#TP) (correct predictions).
- TN is the number of [**true negatives**](https://developers.google.com/machine-learning/glossary/metrics#TN) (correct predictions).
- FP is the number of [**false positives**](https://developers.google.com/machine-learning/glossary/metrics#FP) (incorrect predictions).
- FN is the number of [**false negatives**](https://developers.google.com/machine-learning/glossary/metrics#FN) (incorrect predictions).
Compare and contrast accuracy with
[**precision**](https://developers.google.com/machine-learning/glossary/metrics#precision) and
[**recall**](https://developers.google.com/machine-learning/glossary/metrics#recall).
#### Click the icon for details about accuracy and class-imbalanced datasets.
Although a valuable metric for some situations, accuracy is highly
misleading for others. Notably, accuracy is usually a poor metric
for evaluating classification models that process
[**class-imbalanced datasets**](https://developers.google.com/machine-learning/glossary#class_imbalanced_data_set).
For example, suppose snow falls only 25 days per century in a certain
subtropical city. Since days without snow (the negative class) vastly
outnumber days with snow (the positive class), the snow dataset for
this city is class-imbalanced.
Imagine a [**binary classification**](https://developers.google.com/machine-learning/glossary#binary-classification)
model that is supposed to predict either snow or no snow each day but
simply predicts "no snow" every day.
This model is highly accurate but has no predictive power.
The following table summarizes the results for a century of predictions:
| Category | Number |
|---|---|
| TP | 0 |
| TN | 36499 |
| FP | 0 |
| FN | 25 |
The accuracy of this model is therefore:
```
accuracy = (TP + TN) / (TP + TN + FP + FN)
accuracy = (0 + 36499) / (0 + 36499 + 0 + 25) = 0.9993 = 99.93%
```
Although 99.93% accuracy seems like a very impressive percentage, the model
actually has no predictive power.
[**Precision**](https://developers.google.com/machine-learning/glossary/metrics#precision) and
[**recall**](https://developers.google.com/machine-learning/glossary/metrics#recall) are usually more useful metrics
than **accuracy** for evaluating models trained on class-imbalanced datasets.
*** ** * ** ***
See [Classification: Accuracy, recall, precision and related
metrics](https://developers.google.com/machine-learning/crash-course/classification/accuracy-precision-recall)
in Machine Learning Crash Course for more information.
## area under the PR curve
#Metric
See [**PR AUC (Area under the PR Curve)**](https://developers.google.com/machine-learning/glossary/metrics#PR_AUC).
## area under the ROC curve
#Metric
See [**AUC (Area under the ROC curve)**](https://developers.google.com/machine-learning/glossary/metrics#AUC).
## AUC (Area under the ROC curve)
#fundamentals #Metric
A number between 0.0 and 1.0 representing a
[**binary classification**](https://developers.google.com/machine-learning/glossary#binary-classification) model's
ability to separate [**positive classes**](https://developers.google.com/machine-learning/glossary/metrics#positive_class) from
[**negative classes**](https://developers.google.com/machine-learning/glossary/metrics#negative_class).
The closer the AUC is to 1.0, the better the model's ability to separate
classes from each other.
For example, the following illustration shows a
[**classification model**](https://developers.google.com/machine-learning/glossary#classification-model) that separates positive
classes (green ovals) from negative classes (purple rectangles) perfectly.
This unrealistically perfect model has an AUC of 1.0:

Conversely, the following illustration shows the results for a
[**classification model**](https://developers.google.com/machine-learning/glossary#classification-model) that generated random
results. This model has an AUC of 0.5:

Yes, the preceding model has an AUC of 0.5, not 0.0.
Most models are somewhere between the two extremes. For instance, the
following model separates positives from negatives somewhat, and therefore
has an AUC somewhere between 0.5 and 1.0:

AUC ignores any value you set for
[**classification threshold**](https://developers.google.com/machine-learning/glossary#classification-threshold). Instead, AUC
considers *all* possible classification thresholds.
#### Click the icon to learn about the relationship between AUC and ROC curves.
AUC represents the *area* under an
[**ROC curve**](https://developers.google.com/machine-learning/glossary/metrics#ROC).
For example,
the ROC curve for a model that perfectly separates positives from
negatives looks as follows:
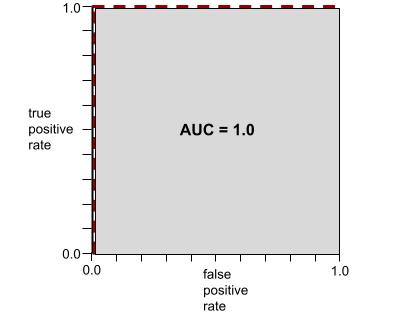
AUC is the area of the gray region in the preceding illustration.
In this unusual case, the area is simply the length of the gray region
(1.0) multiplied by the width of the gray region (1.0). So, the product
of 1.0 and 1.0 yields an AUC of exactly 1.0, which is the highest possible
AUC score.
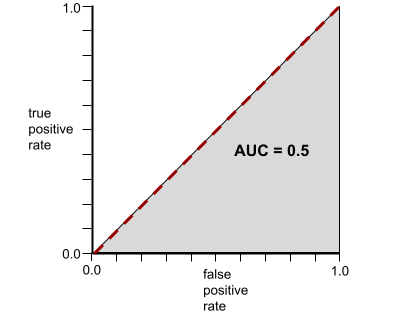
Conversely, the ROC curve for a
[**classification model**](https://developers.google.com/machine-learning/glossary#classification-model) that can't
separate classes at all is as follows. The area of this gray region is 0.5.
A more typical ROC curve looks approximately like the following:
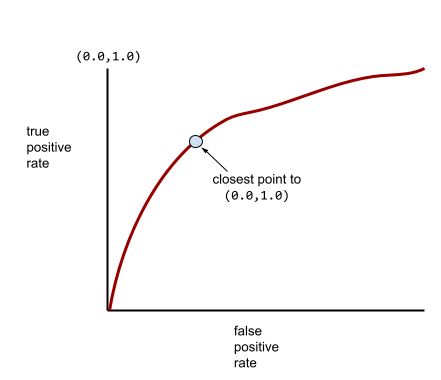
It would be painstaking to calculate the area under this curve manually,
which is why a program typically calculates most AUC values.
*** ** * ** ***
#### Click the icon for a more formal definition of AUC.
AUC is the probability that a
[**classification model**](https://developers.google.com/machine-learning/glossary#classification-model) will be more
confident that a randomly chosen positive example is actually positive than
that a randomly chosen negative example is positive.
*** ** * ** ***
See [Classification: ROC and
AUC](https://developers.google.com/machine-learning/crash-course/classification/roc-and-auc)
in Machine Learning Crash Course for more information.
## average precision at k
#Metric
A metric for summarizing a model's performance on a single prompt that
generates ranked results, such as a numbered list of book recommendations.
Average precision at *k* is, well, the average of the
[**precision at k**](https://developers.google.com/machine-learning/glossary/metrics#precision-at-k) values for each *relevant* result.
The formula for average precision at *k* is therefore:
\\\[{\\text{average precision at k}} = \\frac{1}{n}
\\sum_{i=1}\^n {\\text{precision at k for each relevant item} } \\\]
where:
- \\(n\\) is the number of relevant items in the list.
Contrast with [**recall at k**](https://developers.google.com/machine-learning/glossary/metrics#recall-at-k).
> [!NOTE]
> **Note:** Average precision at *k* evaluates the output for a *single* prompt. Use [**mean average precision at k**](https://developers.google.com/machine-learning/glossary/metrics#mean-average-precision-at-k) to evaluate the quality of a model's output across many different prompts.
> [!NOTE]
> **Note:** Some people abbreviate **average precision at k** to simply **average precision**.
#### Click the icon for an example
Suppose a [large language model](https://developers.google.com/machine-learning/glossary#large-language-model)
is given the following query:
```
List the 6 funniest movies of all time in order.
```
And the large language model returns the following list:
1. The General
2. Mean Girls
3. Platoon
4. Bridesmaids
5. Citizen Kane
6. This is Spinal Tap
Four of the movies in the returned list are very funny (that is, they are relevant) but two movies are dramas (not relevant). The following table details the results:
| Position | Movie | Relevant? | Precision at k |
|---|---|---|---|
| 1 | The General | Yes | 1.0 |
| 2 | Mean Girls | Yes | 1.0 |
| 3 | Platoon | No | not relevant |
| 4 | Bridesmaids | Yes | 0.75 |
| 5 | Citizen Kane | No | not relevant |
| 6 | This is Spinal Tap | Yes | 0.67 |
The number of relevant results is 4. Therefore, you can calculate
the average precision at 6 as follows:
$${\\text{average precision at 6}} = \\frac{1}{4} {\\text{(1.0 + 1.0 + 0.75 + 0.67)} } $$ $${\\text{average precision at 6}} = {\\text{\~0.85} } $$
*** ** * ** ***
## B
## baseline
#Metric
A [**model**](https://developers.google.com/machine-learning/glossary#model) used as a reference point for comparing how well another
model (typically, a more complex one) is performing. For example, a
[**logistic regression model**](https://developers.google.com/machine-learning/glossary#logistic_regression) might serve as a
good baseline for a [**deep model**](https://developers.google.com/machine-learning/glossary#deep_model).
For a particular problem, the baseline helps model developers quantify
the minimal expected performance that a new model must achieve for the new
model to be useful.
## Boolean Questions (BoolQ)
#Metric
A dataset for evaluating an LLM's proficiency in answering yes-or-no questions.
Each of the challenges in the dataset has three components:
- A query
- A passage implying the answer to the query.
- The correct answer, which is either *yes* or *no*.
For example:
- **Query**: Are there any nuclear power plants in Michigan?
- **Passage**: ...three nuclear power plants supply Michigan with about 30% of its electricity.
- **Correct answer**: Yes
Researchers gathered the questions from anonymized, aggregated Google Search
queries and then used Wikipedia pages to ground the information.
For more information, see
[BoolQ: Exploring the Surprising Difficulty of Natural Yes/No Questions](https://arxiv.org/pdf/1905.10044).
BoolQ is a component of the [**SuperGLUE**](https://developers.google.com/machine-learning/glossary/metrics#SuperGLUE) ensemble.
## BoolQ
#Metric
Abbreviation for [**Boolean Questions**](https://developers.google.com/machine-learning/glossary/metrics#Boolean-Questions).
## C
## CB
#Metric
Abbreviation for [**CommitmentBank**](https://developers.google.com/machine-learning/glossary/metrics#CommitmentBank).
## Character N-gram F-score (ChrF)
#Metric
A metric to evaluate [**machine translation**](https://developers.google.com/machine-learning/glossary#machine-translation) models.
Character N-gram F-score determines the degree to which
[**N-grams**](https://developers.google.com/machine-learning/glossary#N-gram) in [**reference text**](https://developers.google.com/machine-learning/glossary#reference_text) overlap the
N-grams in an ML model's [**generated text**](https://developers.google.com/machine-learning/glossary#generated-text).
Character N-gram F-score is similar to metrics in the [**ROUGE**](https://developers.google.com/machine-learning/glossary/metrics#ROUGE)
and [**BLEU**](https://developers.google.com/machine-learning/glossary#BLEU) families, except that:
- Character N-gram F-score operates on *character* N-grams.
- ROUGE and BLEU operate on *word* N-grams or [**tokens**](https://developers.google.com/machine-learning/glossary#token).
## Choice of Plausible Alternatives (COPA)
#Metric
A dataset for evaluating how well an LLM can identify the better of two
alternative answers to a premise. Each of the challenges in the dataset
consists of three components:
- A premise, which is typically a statement followed by a question
- Two possible answers to the question posed in the premise, one of which is correct and the other incorrect
- The correct answer
For example:
- **Premise:** The man broke his toe. What was the CAUSE of this?
- **Possible answers:**
1. He got a hole in his sock.
2. He dropped a hammer on his foot.
- **Correct answer:** 2
COPA is a component of the [**SuperGLUE**](https://developers.google.com/machine-learning/glossary/metrics#SuperGLUE) ensemble.
## CommitmentBank (CB)
#Metric
A dataset for evaluating an LLM's proficiency in determining whether
the author of a passage believes a target clause within that passage.
Each entry in the dataset contains:
- A passage
- A target clause within that passage
- A Boolean value indicating whether the passage's author believes the target clause
For example:
- **Passage:** What fun to hear Artemis laugh. She's such a serious child. I didn't know she had a sense of humor.
- **Target clause:** she had a sense of humor
- **Boolean**: True, which means the author believes the target clause
CommitmentBank is a component of the [**SuperGLUE**](https://developers.google.com/machine-learning/glossary/metrics#SuperGLUE) ensemble.
## COPA
#Metric
Abbreviation for
[**Choice of Plausible Alternatives**](https://developers.google.com/machine-learning/glossary/metrics#Choice-of-Plausible-Alternatives).
## cost
#Metric
Synonym for [**loss**](https://developers.google.com/machine-learning/glossary/metrics#loss).
## counterfactual fairness
#responsible #Metric
A [**fairness metric**](https://developers.google.com/machine-learning/glossary/metrics#fairness_metric) that checks whether a
[**classification model**](https://developers.google.com/machine-learning/glossary#classification-model) produces the same result for
one individual as it does for another individual who is identical to the first,
except with respect to one or more
[**sensitive attributes**](https://developers.google.com/machine-learning/glossary#sensitive_attribute). Evaluating a
[**classification model**](https://developers.google.com/machine-learning/glossary#classification-model) for counterfactual fairness is
one method for surfacing potential sources of bias in a model.
See either of the following for more information:
- [Fairness: Counterfactual
fairness](https://developers.google.com/machine-learning/crash-course/fairness/counterfactual-fairness) in Machine Learning Crash Course.
- [When Worlds Collide: Integrating Different Counterfactual Assumptions
in Fairness](https://papers.nips.cc/paper/2017/file/1271a7029c9df08643b631b02cf9e116-Paper.pdf)
## cross-entropy
#Metric
A generalization of [**Log Loss**](https://developers.google.com/machine-learning/glossary#Log_Loss) to
[**multi-class classification problems**](https://developers.google.com/machine-learning/glossary#multi-class). Cross-entropy
quantifies the difference between two probability distributions. See also
[**perplexity**](https://developers.google.com/machine-learning/glossary/metrics#perplexity).
## cumulative distribution function (CDF)
#Metric
A function that defines the frequency of samples less than or equal to a
target value. For example, consider a normal distribution of continuous values.
A CDF tells you that approximately 50% of samples should be less than or equal
to the mean and that approximately 84% of samples should be less than or equal
to one standard deviation above the mean.
## D
## demographic parity
#responsible #Metric
A [**fairness metric**](https://developers.google.com/machine-learning/glossary/metrics#fairness_metric) that is satisfied if
the results of a model's classification are not dependent on a
given [**sensitive attribute**](https://developers.google.com/machine-learning/glossary#sensitive_attribute).
For example, if both Lilliputians and Brobdingnagians apply to
Glubbdubdrib University, demographic parity is achieved if the percentage
of Lilliputians admitted is the same as the percentage of Brobdingnagians
admitted, irrespective of whether one group is on average more qualified
than the other.
Contrast with [**equalized odds**](https://developers.google.com/machine-learning/glossary/metrics#equalized_odds) and
[**equality of opportunity**](https://developers.google.com/machine-learning/glossary/metrics#equality_of_opportunity), which permit
classification results in aggregate to depend on sensitive attributes,
but don't permit classification results for certain specified
[**ground truth**](https://developers.google.com/machine-learning/glossary#ground_truth) labels to depend on sensitive attributes. See
["Attacking
discrimination with smarter machine learning"](http://research.google.com/bigpicture/attacking-discrimination-in-ml/) for a visualization
exploring the tradeoffs when optimizing for demographic parity.
See [Fairness: demographic
parity](https://developers.google.com/machine-learning/crash-course/fairness/demographic-parity)
in Machine Learning Crash Course for more information.
## E
## earth mover's distance (EMD)
#Metric
A measure of the relative similarity of two [**distributions**](https://developers.google.com/machine-learning/glossary#distribution).
The lower the earth mover's distance, the more similar the distributions.
## edit distance
#Metric
A measurement of how similar two text strings are to each other.
In machine learning, edit distance is useful for the following reasons:
- Edit distance is easy to compute.
- Edit distance can compare two strings known to be similar to each other.
- Edit distance can determine the degree to which different strings are similar to a given string.
Several definitions of edit distance exist, each using different string
operations. See [**Levenshtein distance**](https://developers.google.com/machine-learning/glossary#Levenshtein_distance) for an
example.
## empirical cumulative distribution function (eCDF or
EDF)
#Metric
A [**cumulative distribution function**](https://developers.google.com/machine-learning/glossary/metrics#cumulative_distribution_function)
based on *empirical measurements* from a real dataset. The value of the
function at any point along the x-axis is the fraction of observations in
the dataset that are less than or equal to the specified value.
## entropy
#df #Metric
In
[information theory](https://wikipedia.org/wiki/Information_theory),
a description of how unpredictable a probability
distribution is. Alternatively, entropy is also defined as how much
information each [**example**](https://developers.google.com/machine-learning/glossary#example) contains. A distribution has
the highest possible entropy when all values of a random variable are
equally likely.
The entropy of a set with two possible values "0" and "1" (for example,
the labels in a [**binary classification**](https://developers.google.com/machine-learning/glossary#binary_classification) problem)
has the following formula:
H = -p log p - q log q = -p log p - (1-p) \* log (1-p)
where:
- H is the entropy.
- p is the fraction of "1" examples.
- q is the fraction of "0" examples. Note that q = (1 - p)
- log is generally log~2~. In this case, the entropy unit is a bit.
For example, suppose the following:
- 100 examples contain the value "1"
- 300 examples contain the value "0"
Therefore, the entropy value is:
- p = 0.25
- q = 0.75
- H = (-0.25)log~2~(0.25) - (0.75)log~2~(0.75) = 0.81 bits per example
A set that is perfectly balanced (for example, 200 "0"s and 200 "1"s)
would have an entropy of 1.0 bit per example. As a set becomes more
[**imbalanced**](https://developers.google.com/machine-learning/glossary#class_imbalanced_data_set), its entropy moves towards 0.0.
In [**decision trees**](https://developers.google.com/machine-learning/glossary#decision-tree), entropy helps formulate
[**information gain**](https://developers.google.com/machine-learning/glossary/metrics#information-gain) to help the
[**splitter**](https://developers.google.com/machine-learning/glossary#splitter) select the [**conditions**](https://developers.google.com/machine-learning/glossary#condition)
during the growth of a classification decision tree.
Compare entropy with:
- [**gini impurity**](https://developers.google.com/machine-learning/glossary/metrics#gini-impurity)
- [**cross-entropy**](https://developers.google.com/machine-learning/glossary/metrics#cross-entropy) loss function
Entropy is often called *Shannon's entropy*.
See [Exact splitter for binary classification with numerical
features](https://developers.google.com/machine-learning/decision-forests/binary-classification)
in the Decision Forests course for more information.
## equality of opportunity
#responsible #Metric
A [**fairness metric**](https://developers.google.com/machine-learning/glossary/metrics#fairness_metric) to assess whether a model is
predicting the desirable outcome equally well for all values of a
[**sensitive attribute**](https://developers.google.com/machine-learning/glossary#sensitive_attribute). In other words, if the
desirable outcome for a model is the [**positive class**](https://developers.google.com/machine-learning/glossary/metrics#positive_class),
the goal would be to have the [**true positive rate**](https://developers.google.com/machine-learning/glossary/metrics#TP_rate) be the
same for all groups.
Equality of opportunity is related to [**equalized odds**](https://developers.google.com/machine-learning/glossary/metrics#equalized_odds),
which requires that *both* the true positive rates and
[**false positive rates**](https://developers.google.com/machine-learning/glossary/metrics#FP_rate) are the same for all groups.
Suppose Glubbdubdrib University admits both Lilliputians and Brobdingnagians
to a rigorous mathematics program. Lilliputians' secondary schools offer a
robust curriculum of math classes, and the vast majority of students are
qualified for the university program. Brobdingnagians' secondary schools don't
offer math classes at all, and as a result, far fewer of their students are
qualified. Equality of opportunity is satisfied for the preferred label of
"admitted" with respect to nationality (Lilliputian or Brobdingnagian) if
qualified students are equally likely to be admitted irrespective of whether
they're a Lilliputian or a Brobdingnagian.
For example, suppose 100 Lilliputians and 100 Brobdingnagians apply to
Glubbdubdrib University, and admissions decisions are made as follows:
**Table 1.** Lilliputian applicants (90% are qualified)
| | Qualified | Unqualified |
| Admitted | 45 | 3 |
| Rejected | 45 | 7 |
| Total | 90 | 10 |
|---|---|---|
| Percentage of qualified students admitted: 45/90 = 50% Percentage of unqualified students rejected: 7/10 = 70% Total percentage of Lilliputian students admitted: (45+3)/100 = 48% |||
**Table 2.** Brobdingnagian applicants (10% are qualified):
| | Qualified | Unqualified |
| Admitted | 5 | 9 |
| Rejected | 5 | 81 |
| Total | 10 | 90 |
|---|---|---|
| Percentage of qualified students admitted: 5/10 = 50% Percentage of unqualified students rejected: 81/90 = 90% Total percentage of Brobdingnagian students admitted: (5+9)/100 = 14% |||
The preceding examples satisfy equality of opportunity for acceptance of
qualified students because qualified Lilliputians and Brobdingnagians both
have a 50% chance of being admitted.
While equality of opportunity is satisfied, the following two fairness metrics
are not satisfied:
- [**demographic parity**](https://developers.google.com/machine-learning/glossary/metrics#demographic_parity): Lilliputians and Brobdingnagians are admitted to the university at different rates; 48% of Lilliputians students are admitted, but only 14% of Brobdingnagian students are admitted.
- [**equalized odds**](https://developers.google.com/machine-learning/glossary/metrics#equalized_odds): While qualified Lilliputian and Brobdingnagian students both have the same chance of being admitted, the additional constraint that unqualified Lilliputians and Brobdingnagians both have the same chance of being rejected is not satisfied. Unqualified Lilliputians have a 70% rejection rate, whereas unqualified Brobdingnagians have a 90% rejection rate.
See [Fairness: Equality of
opportunity](https://developers.google.com/machine-learning/crash-course/fairness/equality-of-opportunity)
in Machine Learning Crash Course for more information.
## equalized odds
#responsible #Metric
A fairness metric to assess whether a model is predicting outcomes equally
well for all values of a [**sensitive attribute**](https://developers.google.com/machine-learning/glossary#sensitive_attribute) with
respect to both the [**positive class**](https://developers.google.com/machine-learning/glossary/metrics#positive_class) and
[**negative class**](https://developers.google.com/machine-learning/glossary/metrics#negative_class)---not just one class or the other
exclusively. In other words, both the [**true positive rate**](https://developers.google.com/machine-learning/glossary/metrics#TP_rate)
and [**false negative rate**](https://developers.google.com/machine-learning/glossary/metrics#false-negative-rate) should be the same for
all groups.
Equalized odds is related to
[**equality of opportunity**](https://developers.google.com/machine-learning/glossary/metrics#equality_of_opportunity), which only focuses
on error rates for a single class (positive or negative).
For example, suppose Glubbdubdrib University admits both Lilliputians and
Brobdingnagians to a rigorous mathematics program. Lilliputians' secondary
schools offer a robust curriculum of math classes, and the vast majority of
students are qualified for the university program. Brobdingnagians' secondary
schools don't offer math classes at all, and as a result, far fewer of
their students are qualified. Equalized odds is satisfied provided that no
matter whether an applicant is a Lilliputian or a Brobdingnagian, if they
are qualified, they are equally as likely to get admitted to the program,
and if they are not qualified, they are equally as likely to get rejected.
Suppose 100 Lilliputians and 100 Brobdingnagians apply to Glubbdubdrib
University, and admissions decisions are made as follows:
**Table 3.** Lilliputian applicants (90% are qualified)
| | Qualified | Unqualified |
| Admitted | 45 | 2 |
| Rejected | 45 | 8 |
| Total | 90 | 10 |
|---|---|---|
| Percentage of qualified students admitted: 45/90 = 50% Percentage of unqualified students rejected: 8/10 = 80% Total percentage of Lilliputian students admitted: (45+2)/100 = 47% |||
**Table 4.** Brobdingnagian applicants (10% are qualified):
| | Qualified | Unqualified |
| Admitted | 5 | 18 |
| Rejected | 5 | 72 |
| Total | 10 | 90 |
|---|---|---|
| Percentage of qualified students admitted: 5/10 = 50% Percentage of unqualified students rejected: 72/90 = 80% Total percentage of Brobdingnagian students admitted: (5+18)/100 = 23% |||
Equalized odds is satisfied because qualified Lilliputian and Brobdingnagian
students both have a 50% chance of being admitted, and unqualified Lilliputian
and Brobdingnagian have an 80% chance of being rejected.
> [!NOTE]
> **Note:** While equalized odds is satisfied here, [**demographic parity**](https://developers.google.com/machine-learning/glossary/metrics#demographic_parity) is *not satisfied*. Lilliputian and Brobdingnagian students are admitted to Glubbdubdrib University at different rates; 47% of Lilliputian students are admitted, and 23% of Brobdingnagian students are admitted.
Equalized odds is formally defined in
["Equality of
Opportunity in Supervised Learning"](https://arxiv.org/pdf/1610.02413.pdf) as follows:
"predictor Ŷ satisfies equalized odds with respect
to protected attribute A and outcome Y if Ŷ and A are independent,
conditional on Y."
> [!NOTE]
> **Note:** Contrast equalized odds with the more relaxed [**equality of opportunity**](https://developers.google.com/machine-learning/glossary/metrics#equality_of_opportunity) metric.
## evals
#generativeAI #Metric
Primarily used as an abbreviation for [**LLM evaluations**](https://developers.google.com/machine-learning/glossary/metrics#LLM-evaluations).
More broadly, **evals** is an abbreviation for any form of
[**evaluation**](https://developers.google.com/machine-learning/glossary/metrics#evaluation).
## evaluation
#generativeAI #Metric
The process of measuring a model's quality or comparing different models
against each other.
To evaluate a [**supervised machine learning**](https://developers.google.com/machine-learning/glossary#supervised_machine_learning)
model, you typically judge it against a [**validation set**](https://developers.google.com/machine-learning/glossary#validation_set)
and a [**test set**](https://developers.google.com/machine-learning/glossary#test_set). [**Evaluating a LLM**](https://developers.google.com/machine-learning/glossary/metrics#LLM-evaluations)
typically involves broader quality and safety assessments.
## exact match
#Metric
An all-or-nothing metric in which the model's output either matches
[**ground truth**](https://developers.google.com/machine-learning/glossary#ground-truth) or the [**reference text**](https://developers.google.com/machine-learning/glossary#reference-text)
exactly or it doesn't. For example, if ground truth is *orange* , the only
model output that satisfies exact match is *orange*.
Exact match can also evaluate models whose output is a sequence
(a ranked list of items). In general, exact match requires the generated
ranked list to exactly match ground truth; that is, each item
in both lists must be in the same order. That said, if ground truth
consists of *multiple* correct sequences, then exact match only requires
model's output matches *one* of the correct sequences.
## Extreme Summarization (xsum)
#Metric
A dataset for evaluating an LLM's ability to summarize a single document.
Each entry in the dataset consists of:
- A document authored by the British Broadcasting Corporation (BBC).
- A one-sentence summary of that document.
For details, see
[Don't Give Me the Details, Just the Summary! Topic-Aware Convolutional Neural Networks for Extreme Summarization](https://arxiv.org/abs/1808.08745).
## F
## F~1~
#Metric
A "roll-up" [**binary classification**](https://developers.google.com/machine-learning/glossary#binary-classification) metric that
relies on both [**precision**](https://developers.google.com/machine-learning/glossary/metrics#precision) and [**recall**](https://developers.google.com/machine-learning/glossary/metrics#recall).
Here is the formula:
$$F{_1} = \\frac{\\text{2 \* precision \* recall}} {\\text{precision + recall}}$$
#### Click the icon to see examples.
Suppose precision and recall have the following values:
- precision = 0.6
- recall = 0.4
You calculate F~1~ as follows:
$$F{_1} = \\frac{\\text{2 \* 0.6 \* 0.4}} {\\text{0.6 + 0.4}} = 0.48$$
When precision and recall are fairly similar (as in the preceding example),
F~1~ is close to their mean. When precision and recall differ
significantly, F~1~ is closer to the lower value. For example:
- precision = 0.9
- recall = 0.1
$$F{_1} = \\frac{\\text{2 \* 0.9 \* 0.1}} {\\text{0.9 + 0.1}} = 0.18$$
*** ** * ** ***
## fairness metric
#responsible #Metric
A mathematical definition of "fairness" that is measurable.
Some commonly used fairness metrics include:
- [**equalized odds**](https://developers.google.com/machine-learning/glossary/metrics#equalized_odds)
- [**predictive parity**](https://developers.google.com/machine-learning/glossary/metrics#predictive_parity)
- [**counterfactual fairness**](https://developers.google.com/machine-learning/glossary/metrics#counterfactual_fairness)
- [**demographic parity**](https://developers.google.com/machine-learning/glossary/metrics#demographic_parity)
Many fairness metrics are mutually exclusive; see
[**incompatibility of fairness metrics**](https://developers.google.com/machine-learning/glossary/metrics#incompatibility_of_fairness_metrics).
## false negative (FN)
#fundamentals #Metric
An example in which the model mistakenly predicts the
[**negative class**](https://developers.google.com/machine-learning/glossary/metrics#negative_class). For example, the model
predicts that a particular email message is *not spam*
(the negative class), but that email message *actually is spam*.
## false negative rate
#Metric
The proportion of actual positive examples for which the model mistakenly
predicted the negative class. The following formula calculates the false
negative rate:
$$\\text{false negative rate} = \\frac{\\text{false negatives}}{\\text{false negatives} + \\text{true positives}}$$
See [Thresholds and the confusion
matrix](https://developers.google.com/machine-learning/crash-course/classification/thresholding)
in Machine Learning Crash Course for more information.
## false positive (FP)
#fundamentals #Metric
An example in which the model mistakenly predicts the
[**positive class**](https://developers.google.com/machine-learning/glossary/metrics#positive_class). For example, the model predicts
that a particular email message is *spam* (the positive class), but that
email message is *actually not spam*.
See [Thresholds and the confusion
matrix](https://developers.google.com/machine-learning/crash-course/classification/thresholding)
in Machine Learning Crash Course for more information.
## false positive rate (FPR)
#fundamentals #Metric
The proportion of actual negative examples for which the model mistakenly
predicted the positive class. The following formula calculates the false
positive rate:
$$\\text{false positive rate} = \\frac{\\text{false positives}}{\\text{false positives} + \\text{true negatives}}$$
The false positive rate is the x-axis in an [**ROC curve**](https://developers.google.com/machine-learning/glossary/metrics#ROC).
See [Classification: ROC and
AUC](https://developers.google.com/machine-learning/crash-course/classification/roc-and-auc)
in Machine Learning Crash Course for more information.
## feature importances
#df #Metric
Synonym for [**variable importances**](https://developers.google.com/machine-learning/glossary/metrics#variable-importances).
## foundation model
#generativeAI #Metric
A very large [**pre-trained model**](https://developers.google.com/machine-learning/glossary#pre-trained-model) trained on an enormous
and diverse [**training set**](https://developers.google.com/machine-learning/glossary#training-set). A foundation model can do both
of the following:
- Respond well to a wide range of requests.
- Serve as a [**base model**](https://developers.google.com/machine-learning/glossary#base-model) for additional [**fine-tuning**](https://developers.google.com/machine-learning/glossary#fine-tuning) or other customization.
In other words, a foundation model is already very capable in a general sense
but can be further customized to become even more useful for a specific task.
## fraction of successes
#generativeAI #Metric
A metric for evaluating an ML model's [**generated text**](https://developers.google.com/machine-learning/glossary#generated-text).
The fraction of successes is the number of "successful" generated text
outputs divided by the total number of generated text outputs. For example,
if a [**large language model**](https://developers.google.com/machine-learning/glossary#large-language-model) generated 10 blocks
of code, five of which were successful, then the fraction of successes
would be 50%.
Although fraction of successes is broadly useful throughout statistics,
within ML, this metric is primarily useful for measuring verifiable tasks
like code generation or math problems.
## G
## gini impurity
#df #Metric
A metric similar to [**entropy**](https://developers.google.com/machine-learning/glossary/metrics#entropy). [**Splitters**](https://developers.google.com/machine-learning/glossary#splitter)
use values derived from either gini impurity or entropy to compose
[**conditions**](https://developers.google.com/machine-learning/glossary#condition) for classification
[**decision trees**](https://developers.google.com/machine-learning/glossary#decision-tree).
[**Information gain**](https://developers.google.com/machine-learning/glossary/metrics#information-gain) is derived from entropy.
No universally accepted equivalent term for the metric derived
from gini impurity exists; however, this unnamed metric is just as important as
information gain.
Gini impurity is also called **gini index** , or simply **gini**.
#### Click the icon for mathematical details about gini impurity.
Gini impurity is the probability of misclassifying a new piece of data
taken from the same distribution. The gini impurity of a set with two
possible values "0" and "1" (for example, the labels in a
**[binary classification](https://developers.google.com/machine-learning/glossary#binary_classification)** problem)
is calculated from the following formula:
I = 1 - (p^2^ + q^2^) = 1 - (p^2^ + (1-p)^2^)
where:
- I is the gini impurity.
- p is the fraction of "1" examples.
- q is the fraction of "0" examples. Note that q = 1-p
For example, consider the following dataset:
- 100 labels (0.25 of the dataset) contain the value "1"
- 300 labels (0.75 of the dataset) contain the value "0"
Therefore, the gini impurity is:
- p = 0.25
- q = 0.75
- I = 1 - (0.25^2^ + 0.75^2^) = **0.375**
Consequently, a random label from the same dataset would have a 37.5% chance
of being misclassified, and a 62.5% chance of being properly classified.
A perfectly balanced label (for example, 200 "0"s and 200 "1"s) would have a
gini impurity of 0.5. A highly
[**imbalanced**](https://developers.google.com/machine-learning/glossary#class_imbalanced_data_set) label would have a
gini impurity close to 0.0.
*** ** * ** ***
## H
## hinge loss
#Metric
A family of [**loss**](https://developers.google.com/machine-learning/glossary/metrics#loss) functions for
[**classification**](https://developers.google.com/machine-learning/glossary#classification_model) designed to find the
[**decision boundary**](https://developers.google.com/machine-learning/glossary#decision_boundary) as distant as possible
from each training example,
thus maximizing the margin between examples and the boundary.
[**KSVMs**](https://developers.google.com/machine-learning/glossary#KSVMs) use hinge loss (or a related function, such as
squared hinge loss). For binary classification, the hinge loss function
is defined as follows:
$$\\text{loss} = \\text{max}(0, 1 - (y \* y'))$$
where *y* is the true label, either -1 or +1, and *y'* is the raw output
of the [**classification model**](https://developers.google.com/machine-learning/glossary#classification-model):
$$y' = b + w_1x_1 + w_2x_2 + ... w_nx_n$$
Consequently, a plot of hinge loss versus (y \* y') looks as follows:

## I
## incompatibility of fairness metrics
#responsible #Metric
The idea that some notions of fairness are mutually incompatible and
cannot be satisfied simultaneously. As a result, there is no single
universal [**metric**](https://developers.google.com/machine-learning/glossary/metrics#fairness_metric) for quantifying fairness
that can be applied to all ML problems.
While this may seem discouraging, incompatibility of fairness metrics
doesn't imply that fairness efforts are fruitless. Instead, it suggests
that fairness must be defined contextually for a given ML problem, with
the goal of preventing harms specific to its use cases.
See ["On the
(im)possibility of fairness"](https://arxiv.org/pdf/1609.07236.pdf) for a more detailed discussion of the
incompatibility of fairness metrics.
## individual fairness
#responsible #Metric
A fairness metric that checks whether similar individuals are classified
similarly. For example, Brobdingnagian Academy might want to satisfy
individual fairness by ensuring that two students with identical grades
and standardized test scores are equally likely to gain admission.
Note that individual fairness relies entirely on how you define "similarity"
(in this case, grades and test scores), and you can run the risk of
introducing new fairness problems if your similarity metric misses important
information (such as the rigor of a student's curriculum).
See ["Fairness Through
Awareness"](https://arxiv.org/pdf/1104.3913.pdf) for a more detailed discussion of individual fairness.
## information gain
#df #Metric
In [**decision forests**](https://developers.google.com/machine-learning/glossary#decision-forest), the difference between
a node's [**entropy**](https://developers.google.com/machine-learning/glossary/metrics#entropy) and the weighted (by number of examples)
sum of the entropy of its children nodes. A node's entropy is the entropy
of the examples in that node.
For example, consider the following entropy values:
- entropy of parent node = 0.6
- entropy of one child node with 16 relevant examples = 0.2
- entropy of another child node with 24 relevant examples = 0.1
So 40% of the examples are in one child node and 60% are in the
other child node. Therefore:
- weighted entropy sum of child nodes = (0.4 \* 0.2) + (0.6 \* 0.1) = 0.14
So, the information gain is:
- information gain = entropy of parent node - weighted entropy sum of child nodes
- information gain = 0.6 - 0.14 = 0.46
Most [**splitters**](https://developers.google.com/machine-learning/glossary#splitter) seek to create [**conditions**](https://developers.google.com/machine-learning/glossary#condition)
that maximize information gain.
## inter-rater agreement
#Metric
A measurement of how often human raters agree when doing a task.
If raters disagree, the task instructions may need to be improved.
Also sometimes called **inter-annotator agreement** or
**inter-rater reliability** . See also
[Cohen's
kappa](https://wikipedia.org/wiki/Cohen%27s_kappa),
which is one of the most popular inter-rater agreement measurements.
See [Categorical data: Common
issues](https://developers.google.com/machine-learning/crash-course/categorical-data/issues)
in Machine Learning Crash Course for more information.
## L
## L~1~ loss
#fundamentals #Metric
A [**loss function**](https://developers.google.com/machine-learning/glossary/metrics#loss-function) that calculates the absolute value
of the difference between actual [**label**](https://developers.google.com/machine-learning/glossary#label) values and
the values that a [**model**](https://developers.google.com/machine-learning/glossary#model) predicts. For example, here's the
calculation of L~1~ loss for a [**batch**](https://developers.google.com/machine-learning/glossary#batch) of five
[**examples**](https://developers.google.com/machine-learning/glossary#example):
| Actual value of example | Model's predicted value | Absolute value of delta |
|---|---|---|
| 7 | 6 | 1 |
| 5 | 4 | 1 |
| 8 | 11 | 3 |
| 4 | 6 | 2 |
| 9 | 8 | 1 |
L~1~ loss is less sensitive to [**outliers**](https://developers.google.com/machine-learning/glossary#outliers)
than [**L~2~ loss**](https://developers.google.com/machine-learning/glossary/metrics#squared_loss).
The [**Mean Absolute Error**](https://developers.google.com/machine-learning/glossary/metrics#MAE) is the average
L~1~ loss per example.
#### Click the icon to see the formal math.
$$ L_1 loss = \\sum_{i=0}\^n \| y_i - \\hat{y}_i \|$$
where:
- $n$ is the number of examples.
- $y$ is the actual value of the label.
- $\\hat{y}$ is the value that the model predicts for $y$.
*** ** * ** ***
See
[Linear regression: Loss](https://developers.google.com/machine-learning/crash-course/linear-regression/loss)
in Machine Learning Crash Course for more information.
## L~2~ loss
#fundamentals #Metric
A [**loss function**](https://developers.google.com/machine-learning/glossary/metrics#loss-function) that calculates the square
of the difference between actual [**label**](https://developers.google.com/machine-learning/glossary#label) values and
the values that a [**model**](https://developers.google.com/machine-learning/glossary#model) predicts. For example, here's the
calculation of L~2~ loss for a [**batch**](https://developers.google.com/machine-learning/glossary#batch) of five
[**examples**](https://developers.google.com/machine-learning/glossary#example):
| Actual value of example | Model's predicted value | Square of delta |
|---|---|---|
| 7 | 6 | 1 |
| 5 | 4 | 1 |
| 8 | 11 | 9 |
| 4 | 6 | 4 |
| 9 | 8 | 1 |
Due to squaring, L~2~ loss amplifies the influence of
[**outliers**](https://developers.google.com/machine-learning/glossary#outliers).
That is, L~2~ loss reacts more strongly to bad predictions than
[**L~1~ loss**](https://developers.google.com/machine-learning/glossary/metrics#L1_loss). For example, the L~1~ loss
for the preceding batch would be 8 rather than 16. Notice that a single
outlier accounts for 9 of the 16.
[**Regression models**](https://developers.google.com/machine-learning/glossary#regression_model) typically use L~2~ loss
as the loss function.
The [**Mean Squared Error**](https://developers.google.com/machine-learning/glossary/metrics#MSE) is the average
L~2~ loss per example.
**Squared loss** is another name for L~2~ loss.
#### Click the icon to see the formal math.
$$ L_2 loss = \\sum_{i=0}\^n {(y_i - \\hat{y}_i)}\^2$$
where:
- $n$ is the number of examples.
- $y$ is the actual value of the label.
- $\\hat{y}$ is the value that the model predicts for $y$.
*** ** * ** ***
See [Logistic regression: Loss and
regularization](https://developers.google.com/machine-learning/crash-course/logistic-regression/loss-regularization)
in Machine Learning Crash Course for more information.
## LLM evaluations (evals)
#generativeAI #Metric
A set of metrics and benchmarks for assessing the performance of
[**large language models**](https://developers.google.com/machine-learning/glossary#large-language-model) (LLMs). At a high level,
LLM evaluations:
- Help researchers identify areas where LLMs need improvement.
- Are useful in comparing different LLMs and identifying the best LLM for a particular task.
- Help ensure that LLMs are safe and ethical to use.
See [Large language
models (LLMs)](https://developers.google.com/machine-learning/crash-course/linear-regression)
in Machine Learning Crash Course for more information.
## loss
#fundamentals #Metric
During the [**training**](https://developers.google.com/machine-learning/glossary#training) of a
[**supervised model**](https://developers.google.com/machine-learning/glossary#supervised_machine_learning), a measure of how far a
model's [**prediction**](https://developers.google.com/machine-learning/glossary#prediction) is from its [**label**](https://developers.google.com/machine-learning/glossary#label).
A [**loss function**](https://developers.google.com/machine-learning/glossary/metrics#loss-function) calculates the loss.
See [Linear regression: Loss](https://developers.google.com/machine-learning/crash-course/linear-regression/loss)
in Machine Learning Crash Course for more information.
## loss function
#fundamentals #Metric
During [**training**](https://developers.google.com/machine-learning/glossary#training) or testing, a
mathematical function that calculates the
loss on a [**batch**](https://developers.google.com/machine-learning/glossary#batch) of examples. A loss function returns a lower loss
for models that makes good predictions than for models that make
bad predictions.
The goal of training is typically to minimize the loss that a loss function
returns.
Many different kinds of loss functions exist. Pick the appropriate loss
function for the kind of model you are building. For example:
- [**L~2~ loss**](https://developers.google.com/machine-learning/glossary/metrics#L2_loss) (or [**Mean Squared Error**](https://developers.google.com/machine-learning/glossary/metrics#MSE)) is the loss function for [**linear regression**](https://developers.google.com/machine-learning/glossary#linear_regression).
- [**Log Loss**](https://developers.google.com/machine-learning/glossary#Log_Loss) is the loss function for [**logistic regression**](https://developers.google.com/machine-learning/glossary#logistic_regression).
## M
## MBPP
#Metric
Abbreviation for
[**Mostly Basic Python Problems**](https://developers.google.com/machine-learning/glossary/metrics#Mostly-Basic-Python-Problems).
## Mean Absolute Error (MAE)
#Metric
The average loss per example when [**L~1~ loss**](https://developers.google.com/machine-learning/glossary/metrics#L1_loss) is
used. Calculate Mean Absolute Error as follows:
1. Calculate the L~1~ loss for a batch.
2. Divide the L~1~ loss by the number of examples in the batch.
#### Click the icon to see the formal math.
$$\\text{Mean Absolute Error} = \\frac{1}{n}\\sum_{i=0}\^n \| y_i - \\hat{y}_i \|$$
where:
- $n$ is the number of examples.
- $y$ is the actual value of the label.
- $\\hat{y}$ is the value that the model predicts for $y$.
*** ** * ** ***
For example, consider the calculation of L~1~ loss on the
following batch of five examples:
| Actual value of example | Model's predicted value | Loss (difference between actual and predicted) |
|---|---|---|
| 7 | 6 | 1 |
| 5 | 4 | 1 |
| 8 | 11 | 3 |
| 4 | 6 | 2 |
| 9 | 8 | 1 |
So, L~1~ loss is 8 and the number of examples is 5.
Therefore, the Mean Absolute Error is:
```
Mean Absolute Error = L1 loss / Number of Examples
Mean Absolute Error = 8/5 = 1.6
```
Contrast Mean Absolute Error with [**Mean Squared Error**](https://developers.google.com/machine-learning/glossary/metrics#MSE) and
[**Root Mean Squared Error**](https://developers.google.com/machine-learning/glossary/metrics#RMSE).
## mean average precision at k (mAP@k)
#generativeAI #Metric
The statistical mean of all
[**average precision at k**](https://developers.google.com/machine-learning/glossary/metrics#average-precision-at-k) scores across
a validation dataset. One use of mean average precision at k is to judge
the quality of recommendations generated by a
[**recommendation system**](https://developers.google.com/machine-learning/glossary#recommendation-system).
Although the phrase "mean average" sounds redundant, the name of
the metric is appropriate. After all, this metric finds the mean
of multiple *average precision at k* values.
#### Click the icon to see an example.
Suppose you build a recommendation system that generates a personalized
list of recommended novels for each user. Based on feedback from selected
users, you calculate the following five average precision at k scores (one
score per user):
- 0.73
- 0.77
- 0.67
- 0.82
- 0.76
The mean Average Precision at K is therefore:
$$\\text{mean } = \\frac{\\text{0.73 + 0.77 + 0.67 + 0.82 + 0.76}} {\\text{5}} = \\text{0.75}$$
*** ** * ** ***
## Mean Squared Error (MSE)
#Metric
The average loss per example when [**L~2~ loss**](https://developers.google.com/machine-learning/glossary/metrics#L2_loss) is
used. Calculate Mean Squared Error as follows:
1. Calculate the L~2~ loss for a batch.
2. Divide the L~2~ loss by the number of examples in the batch.
#### Click the icon to see the formal math.
$$\\text{Mean Squared Error} = \\frac{1}{n}\\sum_{i=0}\^n {(y_i - \\hat{y}_i)}\^2$$ where:
- $n$ is the number of examples.
- $y$ is the actual value of the label.
- $\\hat{y}$ is the model's prediction for $y$.
*** ** * ** ***
For example, consider the loss on the following batch of five examples:
| Actual value | Model's prediction | Loss | Squared loss |
|---|---|---|---|
| 7 | 6 | 1 | 1 |
| 5 | 4 | 1 | 1 |
| 8 | 11 | 3 | 9 |
| 4 | 6 | 2 | 4 |
| 9 | 8 | 1 | 1 |
Therefore, the Mean Squared Error is:
```
Mean Squared Error = L2 loss / Number of Examples
Mean Squared Error = 16/5 = 3.2
```
Mean Squared Error is a popular training [**optimizer**](https://developers.google.com/machine-learning/glossary#optimizer),
particularly for [**linear regression**](https://developers.google.com/machine-learning/glossary#linear_regression).
Contrast Mean Squared Error with
[**Mean Absolute Error**](https://developers.google.com/machine-learning/glossary/metrics#MAE) and
[**Root Mean Squared Error**](https://developers.google.com/machine-learning/glossary/metrics#RMSE).
[**TensorFlow Playground**](https://developers.google.com/machine-learning/glossary#TensorFlow_Playground) uses Mean Squared Error
to calculate loss values.
#### Click the icon to see more details about outliers.
[**Outliers**](https://developers.google.com/machine-learning/glossary#outliers) strongly influence Mean Squared Error.
For example, a loss of 1 is a squared loss of 1, but a loss of 3 is a
squared loss of 9. In the preceding table, the example with a loss of 3
accounts for \~56% of the Mean Squared Error, while each of the examples
with a loss of 1 accounts for only 6% of the Mean Squared Error.
Outliers don't influence Mean Absolute Error as strongly as
Mean Squared Error. For example, a loss of 3 accounts for only \~38% of the
Mean Absolute Error.
[**Clipping**](https://developers.google.com/machine-learning/glossary#clipping) is one way to prevent extreme
outliers from damaging your model's predictive ability.
*** ** * ** ***
## metric
#TensorFlow #Metric
A statistic that you care about.
An [**objective**](https://developers.google.com/machine-learning/glossary/metrics#objective) is a metric that a machine learning system
tries to optimize.
## Metrics API (tf.metrics)
#Metric
A TensorFlow API for evaluating models. For example, `tf.metrics.accuracy`
determines how often a model's predictions match labels.
## minimax loss
#Metric
A loss function for
[**generative adversarial networks**](https://developers.google.com/machine-learning/glossary#generative_adversarial_network),
based on the [**cross-entropy**](https://developers.google.com/machine-learning/glossary/metrics#cross-entropy) between the distribution
of generated data and real data.
Minimax loss is used in the
[first paper](https://arxiv.org/pdf/1406.2661.pdf) to describe
generative adversarial networks.
See [Loss Functions](https://developers.google.com/machine-learning/gan/loss) in the
Generative Adversarial Networks course for more information.
## model capacity
#Metric
The complexity of problems that a model can learn. The more complex the
problems that a model can learn, the higher the model's capacity. A model's
capacity typically increases with the number of model parameters. For a formal
definition of [**classification model**](https://developers.google.com/machine-learning/glossary#classification-model) capacity, see
[VC dimension](https://wikipedia.org/wiki/VC_dimension).
## Mostly Basic Python Problems (MBPP)
#Metric
A dataset for evaluating an LLM's proficiency in generating Python code.
[Mostly Basic Python Problems](https://huggingface.co/datasets/Muennighoff/mbpp)
provides about 1,000 crowd-sourced programming problems.
Each problem in the dataset contains:
- A task description
- Solution code
- Three automated test cases
## N
## negative class
#fundamentals #Metric
In [**binary classification**](https://developers.google.com/machine-learning/glossary#binary_classification), one class is
termed *positive* and the other is termed *negative*. The positive class is
the thing or event that the model is testing for and the negative class is the
other possibility. For example:
- The negative class in a medical test might be "not tumor."
- The negative class in an email [**classification model**](https://developers.google.com/machine-learning/glossary#classification-model) might be "not spam."
Contrast with [**positive class**](https://developers.google.com/machine-learning/glossary/metrics#positive_class).
## O
## objective
#Metric
A [**metric**](https://developers.google.com/machine-learning/glossary/metrics#metric) that your algorithm is trying to optimize.
## objective function
#Metric
The mathematical formula or [**metric**](https://developers.google.com/machine-learning/glossary/metrics#metric) that a model aims to optimize.
For example, the objective function for
[**linear regression**](https://developers.google.com/machine-learning/glossary#linear_regression) is usually
[**Mean Squared Loss**](https://developers.google.com/machine-learning/glossary/metrics#MSE). Therefore, when training a
linear regression model, training aims to minimize Mean Squared Loss.
In some cases, the goal is to *maximize* the objective function.
For example, if the objective function is accuracy, the goal is
to maximize accuracy.
See also [**loss**](https://developers.google.com/machine-learning/glossary/metrics#loss).
## P
## pass at k (pass@k)
#Metric
A metric to determine the quality of code (for example, Python)
that a [**large language model**](https://developers.google.com/machine-learning/glossary#large-language-model) generates.
More specifically, pass at *k* tells you the likelihood that at least
one generated block of code out of *k* generated blocks of code will
pass all of its unit tests.
Large language models often struggle to generate good code for
complex programming problems. Software engineers adapt to this problem by
prompting the large language model to generate *multiple* (*k* ) solutions
for the same problem. Then, software engineers test each of the solutions
against unit tests. The calculation of pass at *k* depends on the outcome
of the unit tests:
- If *one or more* of those solutions pass the unit test, then the LLM **Passes** that code generation challenge.
- If *none* of the solutions pass the unit test, then the LLM **Fails** that code generation challenge.
The formula for pass at *k* is as follows:
\\\[\\text{pass at k} = \\frac{\\text{total number of passes}}
{\\text{total number of challenges}}\\\]
In general, higher values of *k* produce higher pass at k scores; however,
higher values of *k* require more large language model and unit testing
resources.
#### Click the icon for an example.
Suppose a software engineer asks a large language model to
generate *k*=10 solutions for *n*=50 challenging coding problems.
Here are the results:
- 30 Passes
- 20 Fails
The pass at 10 score is therefore:
$$\\text{pass at 10} = \\frac{\\text{30}} {\\text{50}} = 0.6$$
*** ** * ** ***
## performance
#Metric
Overloaded term with the following meanings:
- The standard meaning within software engineering. Namely: How fast (or efficiently) does this piece of software run?
- The meaning within machine learning. Here, performance answers the following question: How correct is this [**model**](https://developers.google.com/machine-learning/glossary#model)? That is, how good are the model's predictions?
## permutation variable importances
#df #Metric
A type of [**variable importance**](https://developers.google.com/machine-learning/glossary/metrics#variable-importances) that evaluates
the increase in the prediction error of a model *after* permuting the
feature's values. Permutation variable importance is a model-independent
metric.
## perplexity
#Metric
One measure of how well a [**model**](https://developers.google.com/machine-learning/glossary#model) is accomplishing its task.
For example, suppose your task is to read the first few letters of a word
a user is typing on a phone keyboard, and to offer a list of possible
completion words. Perplexity, P, for this task is approximately the number
of guesses you need to offer in order for your list to contain the actual
word the user is trying to type.
Perplexity is related to [**cross-entropy**](https://developers.google.com/machine-learning/glossary/metrics#cross-entropy) as follows:
$$P= 2\^{-\\text{cross entropy}}$$
## positive class
#fundamentals #Metric
The class you are testing for.
For example, the positive class in a cancer model might be "tumor."
The positive class in an email [**classification model**](https://developers.google.com/machine-learning/glossary#classification-model)
might be "spam."
Contrast with [**negative class**](https://developers.google.com/machine-learning/glossary/metrics#negative_class).
#### Click the icon for additional notes.
The term **positive class** can be confusing because the "positive" outcome
of many tests is often an undesirable result. For example, the positive class in
many medical tests corresponds to tumors or diseases. In general, you want a
doctor to tell you, "Congratulations! Your test results were negative."
Regardless, the positive class is the event that the test is seeking to find.
Admittedly, you're simultaneously testing for both the positive and negative
classes.
*** ** * ** ***
## PR AUC (area under the PR curve)
#Metric
Area under the interpolated
[**precision-recall curve**](https://developers.google.com/machine-learning/glossary/metrics#precision-recall_curve), obtained by plotting
(recall, precision) points for different values of the
[**classification threshold**](https://developers.google.com/machine-learning/glossary#classification_threshold).
## precision
#fundamentals #Metric
A metric for [**classification models**](https://developers.google.com/machine-learning/glossary#classification_model) that answers
the following question:
> When the model predicted the [**positive class**](https://developers.google.com/machine-learning/glossary/metrics#positive_class),
> what percentage of the predictions were correct?
Here is the formula:
$$\\text{Precision} = \\frac{\\text{true positives}} {\\text{true positives} + \\text{false positives}}$$
where:
- true positive means the model *correctly* predicted the positive class.
- false positive means the model *mistakenly* predicted the positive class.
For example, suppose a model made 200 positive predictions.
Of these 200 positive predictions:
- 150 were true positives.
- 50 were false positives.
In this case:
$$\\text{Precision} = \\frac{\\text{150}} {\\text{150} + \\text{50}} = 0.75$$
Contrast with [**accuracy**](https://developers.google.com/machine-learning/glossary/metrics#accuracy) and [**recall**](https://developers.google.com/machine-learning/glossary/metrics#recall).
See [Classification: Accuracy, recall, precision and related
metrics](https://developers.google.com/machine-learning/crash-course/classification/accuracy-precision-recall)
in Machine Learning Crash Course for more information.
## precision at k (precision@k)
#Metric
A metric for evaluating a ranked (ordered) list of items.
Precision at *k* identifies the fraction of the first *k* items in that list
that are "relevant." That is:
\\\[\\text{precision at k} =
\\frac{\\text{relevant items in first k items of the list}}
{\\text{k}}\\\]
The value of *k* must be less than or equal to the length of the returned list.
Note that the length of the returned list is not part of the calculation.
Relevance is often subjective; even expert
[**human evaluators**](https://developers.google.com/machine-learning/glossary#human-evaluation) often disagree on which items are
relevant.
Compare with:
- [**average precision at k**](https://developers.google.com/machine-learning/glossary/metrics#average-precision-at-k)
- [**mean average precision at k**](https://developers.google.com/machine-learning/glossary/metrics#mean-average-precision-at-k)
#### Click the icon to see an example.
Suppose a [large language model](https://developers.google.com/machine-learning/glossary#large-language-model)
is given the following query:
```
List the 6 funniest movies of all time in order.
```
And the large language model returns the list shown in the
first two columns of the following table:
| Position | Movie | Relevant? |
|---|---|---|
| 1 | The General | Yes |
| 2 | Mean Girls | Yes |
| 3 | Platoon | No |
| 4 | Bridesmaids | Yes |
| 5 | Citizen Kane | No |
| 6 | This is Spinal Tap | Yes |
Two of the first three movies are relevant, so precision at 3 is:
$$\\text{precision at 3} = \\frac{\\text{2}} {\\text{3}} = 0.67$$
Three of the first five movies are very funny, so precision at 5 is:
$$\\text{precision at 5} = \\frac{\\text{3}} {\\text{5}} = 0.6$$
*** ** * ** ***
## precision-recall curve
#Metric
A curve of [**precision**](https://developers.google.com/machine-learning/glossary/metrics#precision) versus [**recall**](https://developers.google.com/machine-learning/glossary/metrics#recall) at different
[**classification thresholds**](https://developers.google.com/machine-learning/glossary#classification_threshold).
## prediction bias
#Metric
A value indicating how far apart the average of
[**predictions**](https://developers.google.com/machine-learning/glossary#prediction) is from the average of [**labels**](https://developers.google.com/machine-learning/glossary#label)
in the dataset.
Not to be confused with the [**bias term**](https://developers.google.com/machine-learning/glossary#bias) in machine learning models
or with [**bias in ethics and fairness**](https://developers.google.com/machine-learning/glossary#bias_ethics).
## predictive parity
#responsible #Metric
A [**fairness metric**](https://developers.google.com/machine-learning/glossary/metrics#fairness_metric) that checks whether, for a given
[**classification model**](https://developers.google.com/machine-learning/glossary#classification-model), the
[**precision**](https://developers.google.com/machine-learning/glossary/metrics#precision) rates are equivalent for subgroups
under consideration.
For example, a model that predicts college acceptance would satisfy
predictive parity for nationality if its precision rate is the same
for Lilliputians and Brobdingnagians.
Predictive parity is sometime also called *predictive rate parity*.
See ["Fairness Definitions
Explained"](http://fairware.cs.umass.edu/papers/Verma.pdf) (section 3.2.1)
for a more detailed discussion of predictive parity.
## predictive rate parity
#responsible #Metric
Another name for [**predictive parity**](https://developers.google.com/machine-learning/glossary/metrics#predictive_parity).
## probability density function
#Metric
A function that identifies the frequency of data samples having *exactly* a
particular value. When a dataset's values are continuous floating-point
numbers, exact matches rarely occur. However, *integrating* a probability
density function from value `x` to value `y` yields the expected frequency of
data samples between `x` and `y`.
For example, consider a normal distribution having a mean of 200 and a
standard deviation of 30. To determine the expected frequency of data samples
falling within the range 211.4 to 218.7, you can integrate the probability
density function for a normal distribution from 211.4 to 218.7.
## R
## Reading Comprehension with Commonsense Reasoning Dataset (ReCoRD)
#Metric
A dataset to evaluate an LLM's ability to perform commonsense reasoning.
Each example in the dataset contains three components:
- A paragraph or two from a news article
- A query in which one of the entities explicitly or implicitly identified in the passage is [**masked**](https://developers.google.com/machine-learning/glossary#masked-language-model).
- The answer (the name of the entity that belongs in the mask)
See [ReCoRD](https://sheng-z.github.io/ReCoRD-explorer/examples/000.html)
for an extensive list of examples.
ReCoRD is a component of the [**SuperGLUE**](https://developers.google.com/machine-learning/glossary/metrics#SuperGLUE) ensemble.
## RealToxicityPrompts
#Metric
A dataset that contains a set of sentence beginnings that might contain
toxic content. Use this dataset to evaluate an LLM's ability to generate
non-toxic text to complete the sentence. Typically, you use the
[Perspective API](https://perspectiveapi.com/) to determine how well
the LLM performed at this task.
See
[RealToxicityPrompts: Evaluating Neural Toxic Degeneration in Language Models](https://arxiv.org/abs/2009.11462)
for details.
## recall
#fundamentals #Metric
A metric for [**classification models**](https://developers.google.com/machine-learning/glossary#classification_model) that answers
the following question:
> When [**ground truth**](https://developers.google.com/machine-learning/glossary#ground_truth) was the
> [**positive class**](https://developers.google.com/machine-learning/glossary/metrics#positive_class), what percentage of predictions did
> the model correctly identify as the positive class?
Here is the formula:
\\\[\\text{Recall} =
\\frac{\\text{true positives}} {\\text{true positives} + \\text{false negatives}}
\\\]
where:
- true positive means the model *correctly* predicted the positive class.
- false negative means that the model *mistakenly* predicted the [**negative class**](https://developers.google.com/machine-learning/glossary/metrics#negative_class).
For instance, suppose your model made 200 predictions on examples for which
ground truth was the positive class. Of these 200 predictions:
- 180 were true positives.
- 20 were false negatives.
In this case:
\\\[\\text{Recall} =
\\frac{\\text{180}} {\\text{180} + \\text{20}} = 0.9
\\\]
#### Click the icon for notes about class-imbalanced datasets.
Recall is particularly useful for determining the predictive power of
classification models in which the positive class is rare. For example, consider
a [**class-imbalanced dataset**](https://developers.google.com/machine-learning/glossary#class_imbalanced_data_set)
in which the positive class for a certain disease occurs in only 10 patients
out of a million. Suppose your model makes five million predictions that yield
the following outcomes:
- 30 True Positives
- 20 False Negatives
- 4,999,000 True Negatives
- 950 False Positives
The recall of this model is therefore:
```
recall = TP / (TP + FN)
recall = 30 / (30 + 20) = 0.6 = 60%
```
By contrast, the [**accuracy**](https://developers.google.com/machine-learning/glossary/metrics#accuracy) of this model is:
```
accuracy = (TP + TN) / (TP + TN + FP + FN)
accuracy = (30 + 4,999,000) / (30 + 4,999,000 + 950 + 20) = 99.98%
```
That high value of accuracy looks impressive but is essentially meaningless.
Recall is a much more useful metric for class-imbalanced datasets than accuracy.
*** ** * ** ***
See [Classification: Accuracy, recall, precision and related
metrics](https://developers.google.com/machine-learning/crash-course/classification/accuracy-precision-recall)
for more information.
## recall at k (recall@k)
#Metric
A metric for evaluating systems that output a ranked (ordered) list of items.
Recall at *k* identifies the fraction of relevant items in the first *k* items
in that list out of the total number of relevant items returned.
\\\[\\text{recall at k} =
\\frac{\\text{relevant items in first k items of the list}}
{\\text{total number of relevant items in the list}}\\\]
Contrast with [**precision at k**](https://developers.google.com/machine-learning/glossary/metrics#precision-at-k).
#### Click the icon to see an example.
Suppose a [**large language model**](https://developers.google.com/machine-learning/glossary#large-language-model)
is given the following query:
```
List the 10 funniest movies of all time in order.
```
And the large language model returns the list shown in the first
two columns:
| Position | Movie | Relevant? |
|---|---|---|
| 1 | The General | Yes |
| 2 | Mean Girls | Yes |
| 3 | Platoon | No |
| 4 | Bridesmaids | Yes |
| 5 | This is Spinal Tap | Yes |
| 6 | Airplane! | Yes |
| 7 | Groundhog Day | Yes |
| 8 | Monty Python and the Holy Grail | Yes |
| 9 | Oppenheimer | No |
| 10 | Clueless | Yes |
Eight of the movies in the preceding list are very funny, so they are
"relevant items in the list." Therefore, 8 will be the denominator in
all the calculations of recall at *k*. What about the numerator? Well,
3 of the first 4 items are relevant, so recall at 4 is:
$$\\text{recall at 4} = \\frac{\\text{3}} {\\text{8}} = 0.375$$
7 of the first 8 movies are very funny, so recall at 8 is:
$$\\text{recall at 8} = \\frac{\\text{7}} {\\text{8}} = 0.875$$
*** ** * ** ***
## Recognizing Textual Entailment (RTE)
#Metric
A dataset for evaluating an LLM's ability to determine whether a hypothesis
can be entailed (logically drawn) from a text passage.
Each example in an RTE evaluation consists of three parts:
- A passage, typically from news or Wikipedia articles
- A hypothesis
- The correct answer, which is either:
- True, meaning the hypothesis *can* be entailed from the passage
- False, meaning the hypothesis *can't* be entailed from the passage
For example:
- **Passage:** The Euro is the currency of the European Union.
- **Hypothesis:** France uses the Euro as currency.
- **Entailment:** True, because France is part of the European Union.
RTE is a component of the [**SuperGLUE**](https://developers.google.com/machine-learning/glossary/metrics#SuperGLUE) ensemble.
## ReCoRD
#Metric
Abbreviation for
[**Reading Comprehension with Commonsense Reasoning Dataset**](https://developers.google.com/machine-learning/glossary/metrics#Reading-Comprehension-with-Commonsense-Reasoning-Dataset).
## ROC (receiver operating characteristic) Curve
#fundamentals #Metric
A graph of [**true positive rate**](https://developers.google.com/machine-learning/glossary/metrics#TP_rate) versus
[**false positive rate**](https://developers.google.com/machine-learning/glossary/metrics#FP_rate) for different
[**classification thresholds**](https://developers.google.com/machine-learning/glossary#classification_threshold) in binary
classification.
The shape of an ROC curve suggests a binary classification model's ability
to separate positive classes from negative classes. Suppose, for example,
that a binary classification model perfectly separates all the negative
classes from all the positive classes:
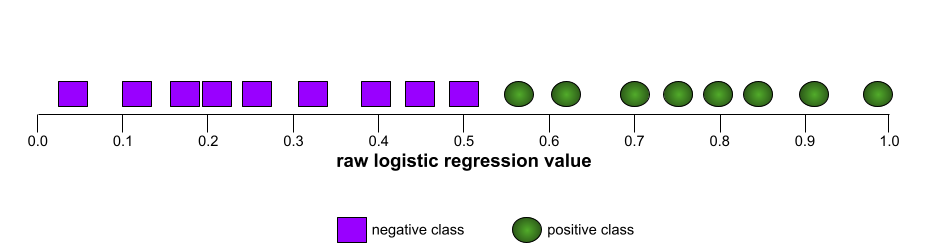
The ROC curve for the preceding model looks as follows:
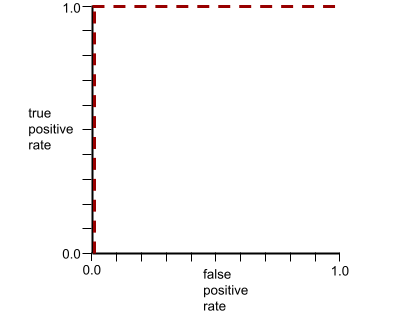
In contrast, the following illustration graphs the raw logistic regression
values for a terrible model that can't separate negative classes from
positive classes at all:
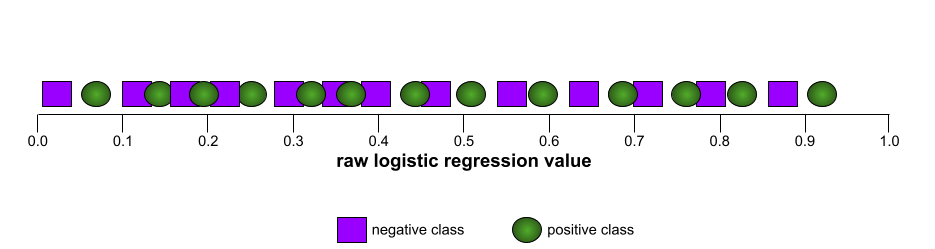
The ROC curve for this model looks as follows:
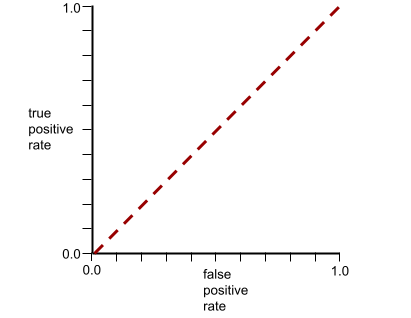
Meanwhile, back in the real world, most binary classification models separate
positive and negative classes to some degree, but usually not perfectly. So,
a typical ROC curve falls somewhere between the two extremes:

The point on an ROC curve closest to (0.0,1.0) theoretically identifies the
ideal classification threshold. However, several other real-world issues
influence the selection of the ideal classification threshold. For example,
perhaps false negatives cause far more pain than false positives.
A numerical metric called [**AUC**](https://developers.google.com/machine-learning/glossary/metrics#AUC) summarizes the ROC curve into
a single floating-point value.
## Root Mean Squared Error (RMSE)
#fundamentals #Metric
The square root of the [**Mean Squared Error**](https://developers.google.com/machine-learning/glossary/metrics#MSE).
## ROUGE (Recall-Oriented Understudy for Gisting Evaluation)
#Metric
A family of metrics that evaluate automatic summarization and
[**machine translation**](https://developers.google.com/machine-learning/glossary#machine-translation) models.
ROUGE metrics determine the degree to which a
[**reference text**](https://developers.google.com/machine-learning/glossary#reference_text) overlaps an
ML model's [**generated text**](https://developers.google.com/machine-learning/glossary#generated-text). Each member of the ROUGE
family measures overlap in a different way. Higher ROUGE scores indicate
more similarity between the reference text and generated text than lower
ROUGE scores.
Each ROUGE family member typically generates the following metrics:
- Precision
- Recall
- F~1~
> [!NOTE]
> **Note:** ROUGE uses *precision* and *recall* somewhat differently than traditional [**precision**](https://developers.google.com/machine-learning/glossary/metrics#precision) and [**recall**](https://developers.google.com/machine-learning/glossary/metrics#recall).
For details and examples, see:
- [**ROUGE-L**](https://developers.google.com/machine-learning/glossary/metrics#ROUGE-L)
- [**ROUGE-N**](https://developers.google.com/machine-learning/glossary/metrics#ROUGE-N)
- [**ROUGE-S**](https://developers.google.com/machine-learning/glossary/metrics#ROUGE-S)
> [!NOTE]
> **Note:** [**BLEU**](https://developers.google.com/machine-learning/glossary#BLEU) and [**BLEURT**](https://developers.google.com/machine-learning/glossary#BLEURT) optimize for [**precision**](https://developers.google.com/machine-learning/glossary/metrics#precision) while ROUGE optimizes for [**recall**](https://developers.google.com/machine-learning/glossary/metrics#recall). Consequently, BLEU and BLEURT are better metrics for evaluating [**machine translation**](https://developers.google.com/machine-learning/glossary#machine-translation) (since the focus is precision) while ROUGE is a better metric for summarization (since the focus is recall).
## ROUGE-L
#Metric
A member of the [**ROUGE**](https://developers.google.com/machine-learning/glossary/metrics#ROUGE) family focused on the length
of the [longest common subsequence](https://wikipedia.org/wiki/Longest_common_subsequence)
in the [**reference text**](https://developers.google.com/machine-learning/glossary#reference-text) and
[**generated text**](https://developers.google.com/machine-learning/glossary#generated-text).
The following formulas calculate recall and precision for ROUGE-L:
$$\\text{ROUGE-L recall} = \\frac{\\text{longest common sequence}} {\\text{number of words in the reference text} }$$ $$\\text{ROUGE-L precision} = \\frac{\\text{longest common sequence}} {\\text{number of words in the generated text} }$$
You can then use [**F~1~**](https://developers.google.com/machine-learning/glossary/metrics#F1) to roll up ROUGE-L
recall and ROUGE-L precision into a single metric:
$$\\text{ROUGE-L F} {_1} = \\frac{\\text{2} \* \\text{ROUGE-L recall} \* \\text{ROUGE-L precision}} {\\text{ROUGE-L recall} + \\text{ROUGE-L precision} }$$
#### Click the icon for an example calculation of ROUGE-L.
Consider the following reference text and generated text.
| Category | Who produced? | Text |
|---|---|---|
| Reference text | Human translator | I want to understand a wide variety of things. |
| Generated text | ML model | I want to learn plenty of things. |
Therefore:
- The longest common subsequence is 5 (*I want to of things*)
- The number of words in the reference text is 9.
- The number of words in the generated text is 7.
Consequently: $$\\text{ROUGE-L recall} = \\frac{\\text{5}} {\\text{9} } = 0.56$$ $$\\text{ROUGE-L precision} = \\frac{\\text{5}} {\\text{7} } = 0.71$$ $$\\text{ROUGE-L F} {_1} = \\frac{\\text{2} \* \\text{0.56} \* \\text{0.71}} {\\text{0.56} + \\text{0.71} } = 0.63$$
*** ** * ** ***
ROUGE-L ignores any newlines in the reference text and generated text, so
the longest common subsequence could cross multiple sentences.
When the reference text and generated text involve multiple sentences,
a variation of ROUGE-L called **ROUGE-Lsum** is generally a better metric.
ROUGE-Lsum determines the longest common subsequence for each *sentence*
in a passage and then calculates the mean of those longest common subsequences.
#### Click the icon for an example calculation of ROUGE-Lsum.
Consider the following reference text and generated text.
| Category | Who produced? | Text |
|---|---|---|
| Reference text | Human translator | The surface of Mars is dry. Nearly all the water is deep underground. |
| Generated text | ML model | Mars has a dry surface. However, the vast majority of water is underground. |
Therefore:
| | First sentence | Second sentence |
|---|---|---|
| Longest common sequence | 2 (Mars dry) | 3 (water is underground) |
| Sentence length of reference text | 6 | 7 |
| Sentence length of generated text | 5 | 8 |
Consequently: $$\\text{recall of first sentence} = \\frac{\\text{2}} {\\text{6}} = 0.33 $$ $$\\text{recall of second sentence} = \\frac{\\text{3}} {\\text{7}} = 0.43 $$ $$\\text{ROUGE-Lsum recall} = \\frac{\\text{0.33} + \\text{0.43}} {\\text{2}} = 0.38 $$ $$\\text{precision of first sentence} = \\frac{\\text{2}} {\\text{5}} = 0.4 $$ $$\\text{precision of second sentence} = \\frac{\\text{3}} {\\text{8}} = 0.38 $$ $$\\text{ROUGE-Lsum precision} = \\frac{\\text{0.4} + \\text{0.38}} {\\text{2}} = 0.39 $$ $$\\text{ROUGE-Lsum F}{_1} = \\frac{\\text{2} \* \\text{0.38} \* \\text{0.39}} {\\text{0.38} + \\text{0.39}} = 0.38 $$
*** ** * ** ***
## ROUGE-N
#Metric
A set of metrics within the [**ROUGE**](https://developers.google.com/machine-learning/glossary/metrics#ROUGE) family that compares the
shared N-grams of a certain size in the [**reference text**](https://developers.google.com/machine-learning/glossary#reference-text)
and [**generated text**](https://developers.google.com/machine-learning/glossary#generated-text). For example:
- **ROUGE-1** measures the number of shared tokens in the reference text and generated text.
- **ROUGE-2** measures the number of shared [**bigrams**](https://developers.google.com/machine-learning/glossary#bigram) (2-grams) in the reference text and generated text.
- **ROUGE-3** measures the number of shared [**trigrams**](https://developers.google.com/machine-learning/glossary#trigram) (3-grams) in the reference text and generated text.
You can use the following formulas to calculate ROUGE-N recall and
ROUGE-N precision for any member of the ROUGE-N family:
$$\\text{ROUGE-N recall} = \\frac{\\text{number of matching N-grams}} {\\text{number of N-grams in the reference text} }$$ $$\\text{ROUGE-N precision} = \\frac{\\text{number of matching N-grams}} {\\text{number of N-grams in the generated text} }$$
You can then use [**F~1~**](https://developers.google.com/machine-learning/glossary/metrics#F1) to roll up ROUGE-N
recall and ROUGE-N precision into a single metric:
$$\\text{ROUGE-N F}{_1} = \\frac{\\text{2} \* \\text{ROUGE-N recall} \* \\text{ROUGE-N precision}} {\\text{ROUGE-N recall} + \\text{ROUGE-N precision} }$$
#### Click the icon for an example.
Suppose you decide to use ROUGE-2 to measure the effectiveness of an ML model's translation compared to a human translator's.
| Category | Who produced? | Text | Bigrams |
|---|---|---|---|
| Reference text | Human translator | I want to understand a wide variety of things. | I want, want to, to understand, understand a, a wide, wide variety, variety of, of things |
| Generated text | ML model | I want to learn plenty of things. | I want, want to, to learn, learn plenty, plenty of, of things |
Therefore:
- The number of matching 2-grams is 3 (*I want*, *want to*, and *of things*).
- The number of 2-grams in the reference text is 8.
- The number of 2-grams in the generated text is 6.
Consequently: $$\\text{ROUGE-2 recall} = \\frac{\\text{3}} {\\text{8} } = 0.375$$ $$\\text{ROUGE-2 precision} = \\frac{\\text{3}} {\\text{6} } = 0.5$$ $$\\text{ROUGE-2 F}{_1} = \\frac{\\text{2} \* \\text{0.375} \* \\text{0.5}} {\\text{0.375} + \\text{0.5} } = 0.43$$
*** ** * ** ***
## ROUGE-S
#Metric
A forgiving form of [**ROUGE-N**](https://developers.google.com/machine-learning/glossary/metrics#ROUGE-N) that enables
[**skip-gram**](https://developers.google.com/machine-learning/glossary#skip-gram) matching. That is, ROUGE-N only counts
[**N-grams**](https://developers.google.com/machine-learning/glossary#N-gram) that match *exactly*, but ROUGE-S also counts N-grams
separated by one or more words. For example, consider the following:
- [**reference text**](https://developers.google.com/machine-learning/glossary#reference-text): *White clouds*
- [**generated text**](https://developers.google.com/machine-learning/glossary#generated-text): *White billowing clouds*
When calculating ROUGE-N, the 2-gram, *White clouds* doesn't match
*White billowing clouds* . However, when calculating ROUGE-S, *White clouds*
does match *White billowing clouds*.
## R-squared
#Metric
A [**regression**](https://developers.google.com/machine-learning/glossary#regression_model) metric indicating how much variation in a
[**label**](https://developers.google.com/machine-learning/glossary#label) is due to an individual feature or to a feature set.
R-squared is a value between 0 and 1, which you can interpret as follows:
- An R-squared of 0 means that none of a label's variation is due to the feature set.
- An R-squared of 1 means that all of a label's variation is due to the feature set.
- An R-squared between 0 and 1 indicates the extent to which the label's variation can be predicted from a particular feature or the feature set. For example, an R-squared of 0.10 means that 10 percent of the variance in the label is due to the feature set, an R-squared of 0.20 means that 20 percent is due to the feature set, and so on.
R-squared is the square of the
[Pearson correlation
coefficient](https://wikipedia.org/wiki/Correlation_coefficient)
between the values that a model predicted and [**ground truth**](https://developers.google.com/machine-learning/glossary#ground_truth).
## RTE
#Metric
Abbreviation for
[**Recognizing Textual Entailment**](https://developers.google.com/machine-learning/glossary/metrics#Recognizing-Textual-Entailment).
## S
## scoring
#Metric
The part of a [**recommendation system**](https://developers.google.com/machine-learning/glossary#recommendation_system) that
provides a value or ranking for each item produced by the
[**candidate generation**](https://developers.google.com/machine-learning/glossary#candidate_generation) phase.
## similarity measure
#clustering #Metric
In [**clustering**](https://developers.google.com/machine-learning/glossary#clustering) algorithms, the metric used to determine
how alike (how similar) any two examples are.
## sparsity
#Metric
The number of elements set to zero (or null) in a vector or matrix divided
by the total number of entries in that vector or matrix. For example,
consider a 100-element matrix in which 98 cells contain zero. The calculation of
sparsity is as follows:
$$ {\\text{sparsity}} = \\frac{\\text{98}} {\\text{100}} = {\\text{0.98}} $$
**Feature sparsity** refers to the sparsity of a feature vector;
**model sparsity** refers to the sparsity of the model weights.
## SQuAD
#Metric
Acronym for **Stanford Question Answering Dataset** , introduced in the paper
[SQuAD: 100,000+ Questions for Machine Comprehension of Text](https://arxiv.org/abs/1606.05250).
The questions in this dataset come from people posing questions about
Wikipedia articles. Some of the questions in SQuAD have answers, but
other questions intentionally don't have answers. Therefore, you can use SQuAD
to evaluate an [**LLM's**](https://developers.google.com/machine-learning/glossary#LLM) ability to do both of the following:
- Answer questions that *can* be answered.
- Identify questions that *cannot* be answered.
[**Exact match**](https://developers.google.com/machine-learning/glossary/metrics#exact-match) in combination with
[**F~1~**](https://developers.google.com/machine-learning/glossary/metrics#F1) are the most common metrics for
evaluating LLMs against SQuAD.
## squared hinge loss
#Metric
The square of the [**hinge loss**](https://developers.google.com/machine-learning/glossary/metrics#hinge-loss). Squared hinge loss penalizes
outliers more harshly than regular hinge loss.
## squared loss
#fundamentals #Metric
Synonym for [**L~2~ loss**](https://developers.google.com/machine-learning/glossary/metrics#L2_loss).
## SuperGLUE
#Metric
An ensemble of datasets for rating an LLM's overall ability to understand
and generate text. The ensemble consists of the following datasets:
- [**Boolean Questions (BoolQ)**](https://developers.google.com/machine-learning/glossary/metrics#Boolean-Questions)
- [**CommitmentBank (CB)**](https://developers.google.com/machine-learning/glossary/metrics#CommitmentBank)
- [**Choice of Plausible Alternatives (COPA)**](https://developers.google.com/machine-learning/glossary/metrics#Choice-of-Plausible-Alternatives)
- [**Multi-sentence Reading Comprehension (MultiRC)**](https://developers.google.com/machine-learning/glossary#Multi-sentence-Reading-Comprehension)
- [**Reading Comprehension with Commonsense Reasoning Dataset (ReCoRD)**](https://developers.google.com/machine-learning/glossary/metrics#Reading-Comprehension-with-Commonsense-Reasoning-Dataset)
- [**Recognizing Textual Entailment (RTE)**](https://developers.google.com/machine-learning/glossary/metrics#Recognizing-Textual-Entailment)
- [**Words in Context (WiC)**](https://developers.google.com/machine-learning/glossary/metrics#Words-in-Context)
- [**Winograd Schema Challenge (WSC)**](https://developers.google.com/machine-learning/glossary/metrics#Winograd-Schema-Challenge)
For details, see
[SuperGLUE: A Stickier Benchmark for General-Purpose Language Understanding Systems](https://arxiv.org/pdf/1905.00537).
## T
## test loss
#fundamentals #Metric
A [**metric**](https://developers.google.com/machine-learning/glossary/metrics#metric) representing a model's [**loss**](https://developers.google.com/machine-learning/glossary/metrics#loss) against
the [**test set**](https://developers.google.com/machine-learning/glossary#test_set). When building a [**model**](https://developers.google.com/machine-learning/glossary#model), you
typically try to minimize test loss. That's because a low test loss is a
stronger quality signal than a low [**training loss**](https://developers.google.com/machine-learning/glossary/metrics#training-loss) or
low [**validation loss**](https://developers.google.com/machine-learning/glossary/metrics#validation-loss).
A large gap between test loss and training loss or validation loss sometimes
suggests that you need to increase the
[**regularization rate**](https://developers.google.com/machine-learning/glossary#regularization_rate).
## top-k accuracy
#Metric
The percentage of times that a "target label" appears within the first *k*
positions of generated lists. The lists could be personalized recommendations
or a list of items ordered by [**softmax**](https://developers.google.com/machine-learning/glossary#softmax).
Top-k accuracy is also known as **accuracy at k**.
> [!NOTE]
> **Note:** The target label could be any class (not necessarily the [**ground truth**](https://developers.google.com/machine-learning/glossary#ground-truth) class), so top-k accuracy is not always equivalent to traditional [**accuracy**](https://developers.google.com/machine-learning/glossary/metrics#accuracy).
#### Click the icon for an example.
Consider a machine learning system that uses softmax to identify
tree probabilities based on a picture of tree leaves. The following table shows
output lists generated from five input tree pictures. Each row contains a target
label and the five most likely trees. For example, when the target label was
*maple*, the machine learning model identified *elm* as the most
likely tree, *oak* as the second most likely tree, and so on.
| Target label | 1 | 2 | 3 | 4 | 5 |
|---|---|---|---|---|---|
| maple | elm | oak | **maple** | beech | poplar |
| dogwood | oak | **dogwood** | poplar | hickory | maple |
| oak | **oak** | basswood | locust | alder | linden |
| linden | maple | paw-paw | oak | basswood | poplar |
| oak | locust | linden | **oak** | maple | paw-paw |
The target label appears in the first position only once, so the
top-1 accuracy is:
$$\\text{top-1 accuracy} = \\frac{\\text{1}} {\\text{5}} = 0.2$$
The target label appears in one of the top three positions four times,
so the top-3 accuracy is:
$$\\text{top-1 accuracy} = \\frac{\\text{4}} {\\text{5}} = 0.8$$
*** ** * ** ***
## toxicity
#Metric
The degree to which content is abusive, threatening, or offensive. Many machine
learning models can identify, measure, and classify toxicity. Most of these
models identify toxicity along multiple parameters, such as the level of
abusive language and the level of threatening language.
## training loss
#fundamentals #Metric
A [**metric**](https://developers.google.com/machine-learning/glossary/metrics#metric) representing a model's [**loss**](https://developers.google.com/machine-learning/glossary/metrics#loss) during a
particular training iteration. For example, suppose the loss function
is [**Mean Squared Error**](https://developers.google.com/machine-learning/glossary/metrics#MSE). Perhaps the training loss (the Mean
Squared Error) for the 10th iteration is 2.2, and the training loss for
the 100th iteration is 1.9.
A [**loss curve**](https://developers.google.com/machine-learning/glossary#loss_curve) plots training loss versus the number of
iterations. A loss curve provides the following hints about training:
- A downward slope implies that the model is improving.
- An upward slope implies that the model is getting worse.
- A flat slope implies that the model has reached [**convergence**](https://developers.google.com/machine-learning/glossary#convergence).
For example, the following somewhat idealized [**loss curve**](https://developers.google.com/machine-learning/glossary#loss_curve)
shows:
- A steep downward slope during the initial iterations, which implies rapid model improvement.
- A gradually flattening (but still downward) slope until close to the end of training, which implies continued model improvement at a somewhat slower pace then during the initial iterations.
- A flat slope towards the end of training, which suggests convergence.
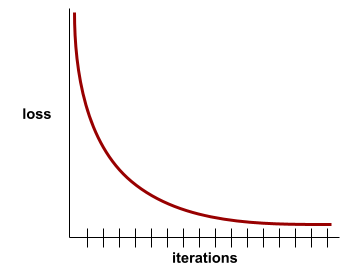
Although training loss is important, see also
[**generalization**](https://developers.google.com/machine-learning/glossary#generalization).
## Trivia Question Answering
#Metric
Datasets to evaluate an LLM's ability to answer trivia questions.
Each dataset contains question-answer pairs authored by trivia enthusiasts.
Different datasets are grounded by different sources, including:
- Web search (TriviaQA)
- Wikipedia (TriviaQA_wiki)
For more information see
[TriviaQA: A Large Scale Distantly Supervised Challenge Dataset for Reading Comprehension](https://arxiv.org/pdf/1705.03551.pdf).
## true negative (TN)
#fundamentals #Metric
An example in which the model *correctly* predicts the
[**negative class**](https://developers.google.com/machine-learning/glossary/metrics#negative_class). For example, the model infers that
a particular email message is *not spam* , and that email message really is
*not spam*.
## true positive (TP)
#fundamentals #Metric
An example in which the model *correctly* predicts the
[**positive class**](https://developers.google.com/machine-learning/glossary/metrics#positive_class). For example, the model infers that
a particular email message is spam, and that email message really is spam.
## true positive rate (TPR)
#fundamentals #Metric
Synonym for [**recall**](https://developers.google.com/machine-learning/glossary/metrics#recall). That is:
$$\\text{true positive rate} = \\frac {\\text{true positives}} {\\text{true positives} + \\text{false negatives}}$$
True positive rate is the y-axis in an [**ROC curve**](https://developers.google.com/machine-learning/glossary/metrics#ROC).
## Typologically Diverse Question Answering (TyDi QA)
#Metric
A large dataset for evaluating an LLM's proficiency in answering questions.
The dataset contains question and answer pairs in many languages.
For details, see
[TyDi QA: A Benchmark for Information-Seeking Question Answering in Typologically Diverse Languages](https://arxiv.org/abs/2003.05002).
## U
## unsupported-claim rate (UCR)
#Metric
The percentage of claims in a [**response**](https://developers.google.com/machine-learning/glossary#response) that aren't
[**grounded**](https://developers.google.com/machine-learning/glossary#grounding). For example, if an LLM's response makes
10 claims but only 1 is grounded, the UCR is 90%.
A high UCR implies that an LLM is [**hallucinating**](https://developers.google.com/machine-learning/glossary#hallucination)
too frequently.
See also [**citation precision**](https://developers.google.com/machine-learning/glossary#citation-precision) and
[**citation recall**](https://developers.google.com/machine-learning/glossary#citation-recall).
## V
## validation loss
#fundamentals #Metric
A [**metric**](https://developers.google.com/machine-learning/glossary/metrics#metric) representing a model's [**loss**](https://developers.google.com/machine-learning/glossary/metrics#loss) on
the [**validation set**](https://developers.google.com/machine-learning/glossary#validation_set) during a particular
[**iteration**](https://developers.google.com/machine-learning/glossary#iteration) of training.
See also [**generalization curve**](https://developers.google.com/machine-learning/glossary#generalization_curve).
## variable importances
#df #Metric
A set of scores that indicates the relative importance of each
[**feature**](https://developers.google.com/machine-learning/glossary#feature) to the model.
For example, consider a [**decision tree**](https://developers.google.com/machine-learning/glossary#decision-tree) that
estimates house prices. Suppose this decision tree uses three
features: size, age, and style. If a set of variable importances
for the three features are calculated to be
{size=5.8, age=2.5, style=4.7}, then size is more important to the
decision tree than age or style.
Different variable importance metrics exist, which can inform
ML experts about different aspects of models.
## W
## Wasserstein loss
#Metric
One of the loss functions commonly used in
[**generative adversarial networks**](https://developers.google.com/machine-learning/glossary#generative_adversarial_network),
based on the [**earth mover's distance**](https://developers.google.com/machine-learning/glossary/metrics#earth-movers-distance) between
the distribution of generated data and real data.
## WiC
#Metric
Abbreviation for [**Words in Context**](https://developers.google.com/machine-learning/glossary/metrics#Words-in-Context).
## WikiLingua (wiki_lingua)
#Metric
A dataset for evaluating an LLM's ability to summarize short articles.
[WikiHow](https://www.wikihow.com), an encyclopedia of articles explaining
how to do various tasks, is the human-authored source for both the articles
and the summaries. Each entry in the dataset consists of:
- An article, which is created by appending each step of the prose (paragraph) version of the numbered list, minus the opening sentence of each step.
- A summary of that article, consisting of the opening sentence of each step in the numbered list.
For details, see
[WikiLingua: A New Benchmark Dataset for Cross-Lingual Abstractive Summarization](https://aclanthology.org/2020.findings-emnlp.360/).
## Winograd Schema Challenge (WSC)
#Metric
A format (or dataset conforming to that format) for evaluating an LLM's ability
to determine the noun phrase that a
[pronoun](https://developers.google.com/tech-writing/one/just-enough-grammar#pronouns)
refers to.
Each entry in a Winograd Schema Challenge consists of:
- A short passage, which contains a target pronoun
- A target pronoun
- Candidate noun phrases, followed by the correct answer (a Boolean). If the target pronoun refers to this candidate, the answer is True. If the target pronoun does not refer to this candidate, the answer is False.
For example:
- **Passage**: Mark told Pete many lies about himself, which Pete included in his book. He should have been more truthful.
- **Target pronoun**: He
- **Candidate noun phrases** :
- Mark: True, because the target pronoun refers to Mark
- Pete: False, because the target pronoun doesn't refer to Peter
The Winograd Schema Challenge is a component of the
[**SuperGLUE**](https://developers.google.com/machine-learning/glossary/metrics#SuperGLUE) ensemble.
## Words in Context (WiC)
#Metric
A dataset for evaluating how well an LLM uses context to understand words that
have multiple meanings. Each entry in the dataset contains:
- Two sentences, each containing the target word
- The target word
- The correct answer (a Boolean), where:
- True means the target word has the same meaning in the two sentences
- False means the target word has a different meaning in the two sentences
For example:
- **Two sentences:**
- There's a lot of trash on the bed of the river.
- I keep a glass of water next to my bed when I sleep.
- **The target word:** bed
- **Correct answer**: False, because the target word has a different meaning in the two sentences.
For details, see
[WiC: the Word-in-Context Dataset for Evaluating Context-Sensitive Meaning Representations](https://arxiv.org/abs/1808.09121).
Words in Context is a component of the [**SuperGLUE**](https://developers.google.com/machine-learning/glossary/metrics#SuperGLUE) ensemble.
## WSC
#Metric
Abbreviation for [**Winograd Schema Challenge**](https://developers.google.com/machine-learning/glossary/metrics#Winograd-Schema-Challenge).
## X
## XL-Sum (xlsum)
#Metric
A dataset for evaluating an LLM's proficiency in summarizing text.
XL-Sum provides entries in many languages. Each entry in the dataset contains:
- An article, taken from the British Broadcasting Company (BBC).
- A summary of the article, written by the article's author. Note that that summary can contain words or phrases not present in the article.
For details, see
[XL-Sum: Large-Scale Multilingual Abstractive Summarization for 44 Languages](https://arxiv.org/abs/2106.13822).