
AI-generated Key Takeaways
-
To display tropical storm forecasts on Google Maps, you must provide a CAP alert with a unique storm ID and a separate feed with storm geometry data.
-
The storm geometry feed should contain URLs to ZIP files with shapefiles representing the storm's forecast track, cone of uncertainty, and center points.
-
These shapefiles must include a storm ID, latitude, and longitude data, and follow specific naming conventions for Google to process them correctly.
-
You need to inform Google about the structure of your ZIP file, including which files contain specific storm features and the column names for essential data points like storm ID, latitude, and longitude.
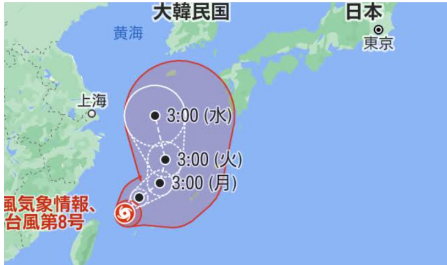
Public Alerts can display a tropical storm forecast geometry on Google Maps like the one shown in figure 1 if you follow these requirements:
Provide a valid CAP alert in your feed that contains the cyclone information.
In a new, non-CAP feed, provide additional data that specifies the storm geometry associated with the storm information in the CAP alert.
Additional requirements for a cyclone CAP alert
For alerts on tropical storm, typhoon, and cyclone event types, you must specify
a unique storm ID in the CAP alert. We recommend that you use the <info> and
<parameter> elements to assign an enumeration value of StormId in the
<valueName> element, as shown in the following code snippet.
<parameter>
    <valueName>StormId</valueName>
    <value>UniqueStormId</value>
</parameter>
Public Alerts uses this information to connect the storm to the right visualization in the storm geometry feed.
Example
<parameter>
    <valueName>StormId</valueName>
    <value>UIG4354812</value>
</parameter>
Additional requirements for storm geometry information feeds
If your feed includes storm geometry data, prepare a second feed file that contains information about the different tropical storms. Include the URLs for the data files that contain the forecast geometry. NOAA produces a forecast geometry feed that contains data in XML format like in the following code example:
<item>
  <title>
    Advisory #024 Forecast [shp] - Tropical Storm Walaka (CP1/CP012018)
  </title>
  <description>
    Forecast Track, Cone of Uncertainty, Watches/Warnings. Shapefile last
     updated 05 Oct 2018 14:52:04 GMT.
  </description>
<link>http://www.prh.noaa.gov/cphc/tc_graphics/2018/gis/cp012018_5day_024.zip
  </link>
</item>
In the preceding example, the <link> element includes a ZIP file that contains
files which represent the forecast geometry of the mentioned tropical storm.
Include the following files in your feed's ZIP file:
- A file that contains the storm center forecast points.
- A file that contains the center forecast track line.
- A file that contains the forecast cone polygon.
To differentiate the ZIP files while they process, each file must have a different filename suffix.
For example, the NHC forecast file al012021_5day_001.zip contains the
following files:
al012021-001_5day_lin.shpal012021-001_5day_pgn.shpal012021-001_5day_pts.shpal012021-001_ww_wwlin.shp
The attribute table for al012021-001_ww_wwlin.shp contains a column named
STORMNUM (see figure 2). Data in that column is used as the StormID value in
the feed.
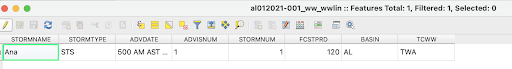
StormID values in the
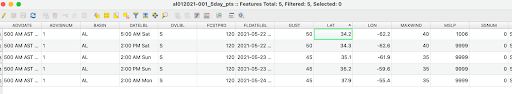
STORMNUM column.The attribute table for al012021-001_5day_pts.shp uses columns named LAT and
LON to denote the latitude and longitude information, respectively (see figure
3).
Tropical storm geometry checklist
Before you submit your feed to Google to support tropical storm cone geometry, complete the following checklist:
☐ Produce a valid CAP alert with a unique StormId value.
☐ Produce a feed for forecast geometry, and share its URL with Google.
☐ Send an explanation of the structure of the ZIP file that contains
your forecast geometry:
☐ Which file specifies the storm center
forecast points?
☐ Which file specifies the center forecast
track line?
☐ Which file specifies the forecast cone
polygon?
☐ Which column names denote the storm ID,
latitude, and longitude?