Analytics
コレクションでコンテンツを整理
必要に応じて、コンテンツの保存と分類を行います。
管理コンソールのアナリティクス ページには、サイトのトラフィックの詳細が表示されます。インタラクティブなグラフを使用すると、過去 90 日間の特定の週のトラフィックを確認できます。また、データを CSV 形式でダウンロードすることもできます。
reCAPTCHA v2

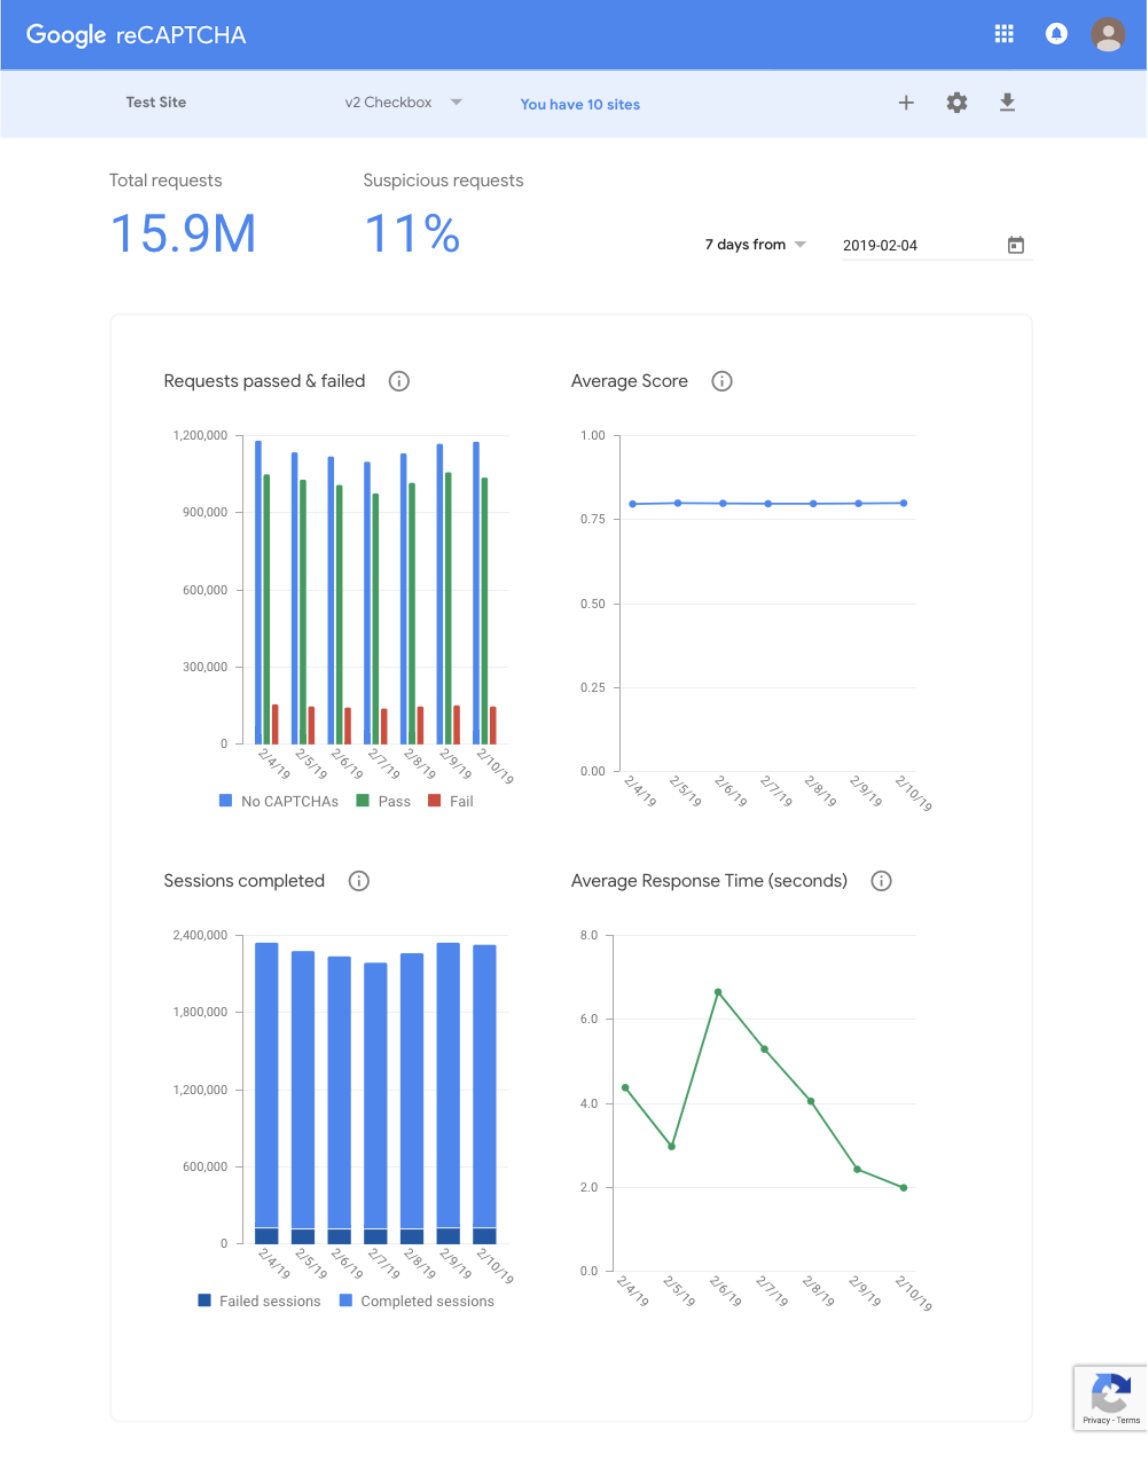
reCAPTCHA v2 のサイトタイプには 4 つのグラフがあります。サイトに十分なトラフィックが得られるまで、一部のグラフが表示されないことがあります。
クエリ結果をグラフ化 |
サイトの種類 |
説明 |
成功と失敗 |
Checkbox、Android、Invisible |
このグラフには、サイト上でユーザーまたは bot が個々のキャプチャ チャレンジに合格または失敗した 1 日あたりの回数が表示されます。不合格の数字は、必ずしもユーザーがチャレンジを最終的に解決しなかったことを意味するわけではありません。また、reCAPTCHA が正当なリクエストであることを確認できたため、CAPTCHA が表示されなかった回数も表示されます。 |
平均スコア |
Checkbox、Android、Invisible |
このグラフはサイトの平均スコアを示しており、トレンドを把握するのに役立ちます。
スコアの範囲は 0.0 ~ 1.0 で、0.0 は不正なトラフィック、1.0 は良好なトラフィックであることを示します。reCAPTCHA v3 に登録すると、トラフィックに関する詳しい分析情報を取得できます。 |
Sessions Completed(完了したセッション) |
チェックボックス、Android |
このグラフには、ユーザーまたは bot が reCAPTCHA を操作し、reCAPTCHA による確認を完了した回数が表示されます。 |
平均応答時間 |
チェックボックス、Android |
このグラフは、人間と bot が reCAPTCHA セッションを完了するまでにかかる時間(失敗した試行や再読み込みを含む)の平均時間を示しています。 |
reCAPTCHA v3

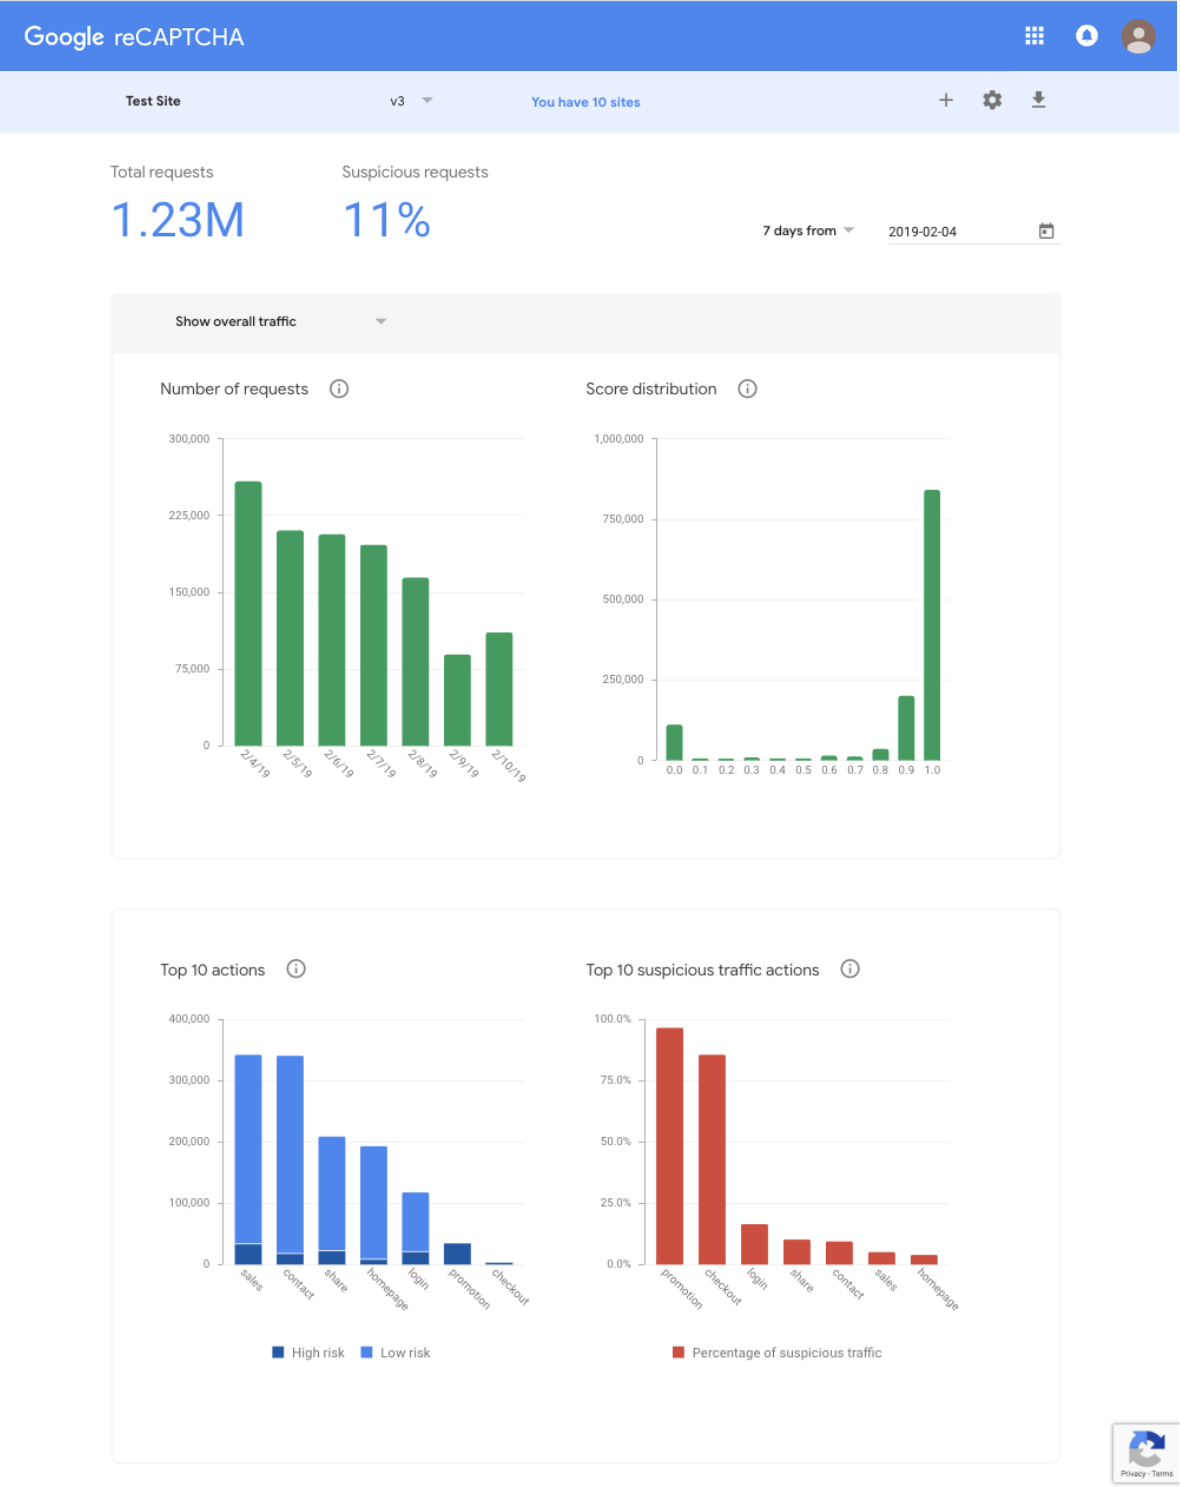
reCAPTCHA v3 のサイトタイプには 4 つのグラフがあります。十分なライブ トラフィックで実行するまでは、スコアが正確でない可能性があります。
クエリ結果をグラフ化 |
説明 |
リクエスト数 |
このグラフには、指定したアクション名で reCAPTCHA がサイトから受信したリクエストの数が表示されます。 |
スコア分布 |
このグラフには、指定したアクション名に対するサイトのスコアの分布が表示されます。
スコアの範囲は 0.0 ~ 1.0 で、0.0 は不正なトラフィック、1.0 は良好なトラフィックであることを示します。 |
上位 10 件のアクション |
このグラフには、サイトの上位 10 件のアクション(全体的なトラフィック別)が表示されます。サイトの適応型リスク分析を改善し、トラフィックの詳細な内訳を表示するには、reCAPTCHA 検証を実行する各場所にアクション名を指定します。 |
不審なトラフィック アクション トップ 10 |
このグラフには、サイトの上位 10 件のアクション(不審なトラフィックの割合の降順)が表示されます。サイトの適応型リスク分析を改善し、トラフィックの詳細な内訳を表示するには、reCAPTCHA 検証を実行する各場所にアクション名を指定します。 |
特に記載のない限り、このページのコンテンツはクリエイティブ・コモンズの表示 4.0 ライセンスにより使用許諾されます。コードサンプルは Apache 2.0 ライセンスにより使用許諾されます。詳しくは、Google Developers サイトのポリシーをご覧ください。Java は Oracle および関連会社の登録商標です。
最終更新日 2025-07-25 UTC。
[null,null,["最終更新日 2025-07-25 UTC。"],[[["\u003cp\u003eThe Admin Console analytics page offers insights into website traffic using interactive charts and downloadable CSV data for the past 90 days.\u003c/p\u003e\n"],["\u003cp\u003ereCAPTCHA v2 analytics include charts for pass/fail rates, average score, sessions completed, and average response time, varying by site type.\u003c/p\u003e\n"],["\u003cp\u003ereCAPTCHA v3 analytics provide data on request numbers, score distribution, and top actions based on overall and suspicious traffic, requiring specific action names for detailed analysis.\u003c/p\u003e\n"],["\u003cp\u003eCharts might not display accurate data or be available until sufficient traffic has been processed by reCAPTCHA.\u003c/p\u003e\n"]]],["The Admin Console's analytics page provides traffic insights, allowing users to view data through interactive charts for the past 90 days or download it in CSV format. For reCAPTCHA v2, charts display passed/failed CAPTCHA challenges, average scores, completed sessions, and average response times. For reCAPTCHA v3, charts detail request numbers, score distribution, top 10 actions, and top 10 suspicious traffic actions. Specifying action names improves adaptive risk analysis.\n"],null,["# Analytics\n\nThe Admin Console analytics page provides a detailed view into traffic on your\nsite. You can use the interactive charts to look at your traffic in any given\nweek over the past 90 days. Alternatively, you can download the data in a CSV\nformat.\n\nreCAPTCHA v2\n------------\n\nThere are 4 charts available for the reCAPTCHA v2 site type. Some of the charts\nmight not be shown before there is sufficient traffic to your site.\n\n| Chart | Site type | Description |\n|-----------------------|------------------------------|---------------------------------------------------------------------------------------------------------------------------------------------------------------------------------------------------------------------------------------------------------------------------------------------------------------------------------------|\n| Passed and Failed | Checkbox, Android, Invisible | This chart shows how many times a user or bot passed or failed an individual CAPTCHA challenge on your site each day. The failed number does not necessarily mean the user did not eventually solve the challenge. It also shows how many times no CAPTCHA was shown because reCAPTCHA was confident that the request was legitimate. |\n| Average Score | Checkbox, Android, Invisible | This chart shows the average score on your site, which is designed to help you spot trends. Scores range from 0.0 to 1.0, with 0.0 indicating abusive traffic and 1.0 indicating good traffic. Sign up for [reCAPTCHA v3](/recaptcha/docs/v3) to gain more insights about your traffic. |\n| Sessions Completed | Checkbox, Android | This chart shows how many times a user or bot interacted with reCAPTCHA and completed reCAPTCHA verification. |\n| Average Response Time | Checkbox, Android | This chart shows the average time it took humans and bots to complete a reCAPTCHA session, including failed attempts and reloads. |\n\nreCAPTCHA v3\n------------\n\nThere are 4 charts available for the reCAPTCHA v3 site type. Note that the\nscores may not be accurate before running with sufficient live traffic.\n\n| Chart | Description |\n|-----------------------------------|-------------------------------------------------------------------------------------------------------------------------------------------------------------------------------------------------------------------------------------------------------------------------------------------------------|\n| Number of Requests | This chart shows the number of requests that reCAPTCHA received from your site for the specified action name. |\n| Score Distribution | This chart shows the distribution of scores for your site for the specified action name. Scores range from 0.0 to 1.0, with 0.0 indicating abusive traffic and 1.0 indicating good traffic. |\n| Top 10 Actions | This chart shows the top 10 actions (by overall traffic) for your site. To improve the adaptive risk analysis for your site and to view a more detailed breakdown of your traffic, specify an action name in each place that you execute reCAPTCHA verification. |\n| Top 10 Suspicious Traffic Actions | This chart shows the top 10 actions (in descending order of percentage of suspicious traffic) for your site. To improve the adaptive risk analysis for your site and to view a more detailed breakdown of your traffic, specify an action name in each place that you execute reCAPTCHA verification. |"]]