Analytics
컬렉션을 사용해 정리하기
내 환경설정을 기준으로 콘텐츠를 저장하고 분류하세요.
관리 콘솔 분석 페이지에서는 사이트의 트래픽을 자세히 확인할 수 있습니다. 대화형 차트를 사용하여 특정 주의 지난 90일 동안의 트래픽을 확인할 수 있습니다. 또는 데이터를 CSV 형식으로 다운로드할 수 있습니다.
reCAPTCHA v2

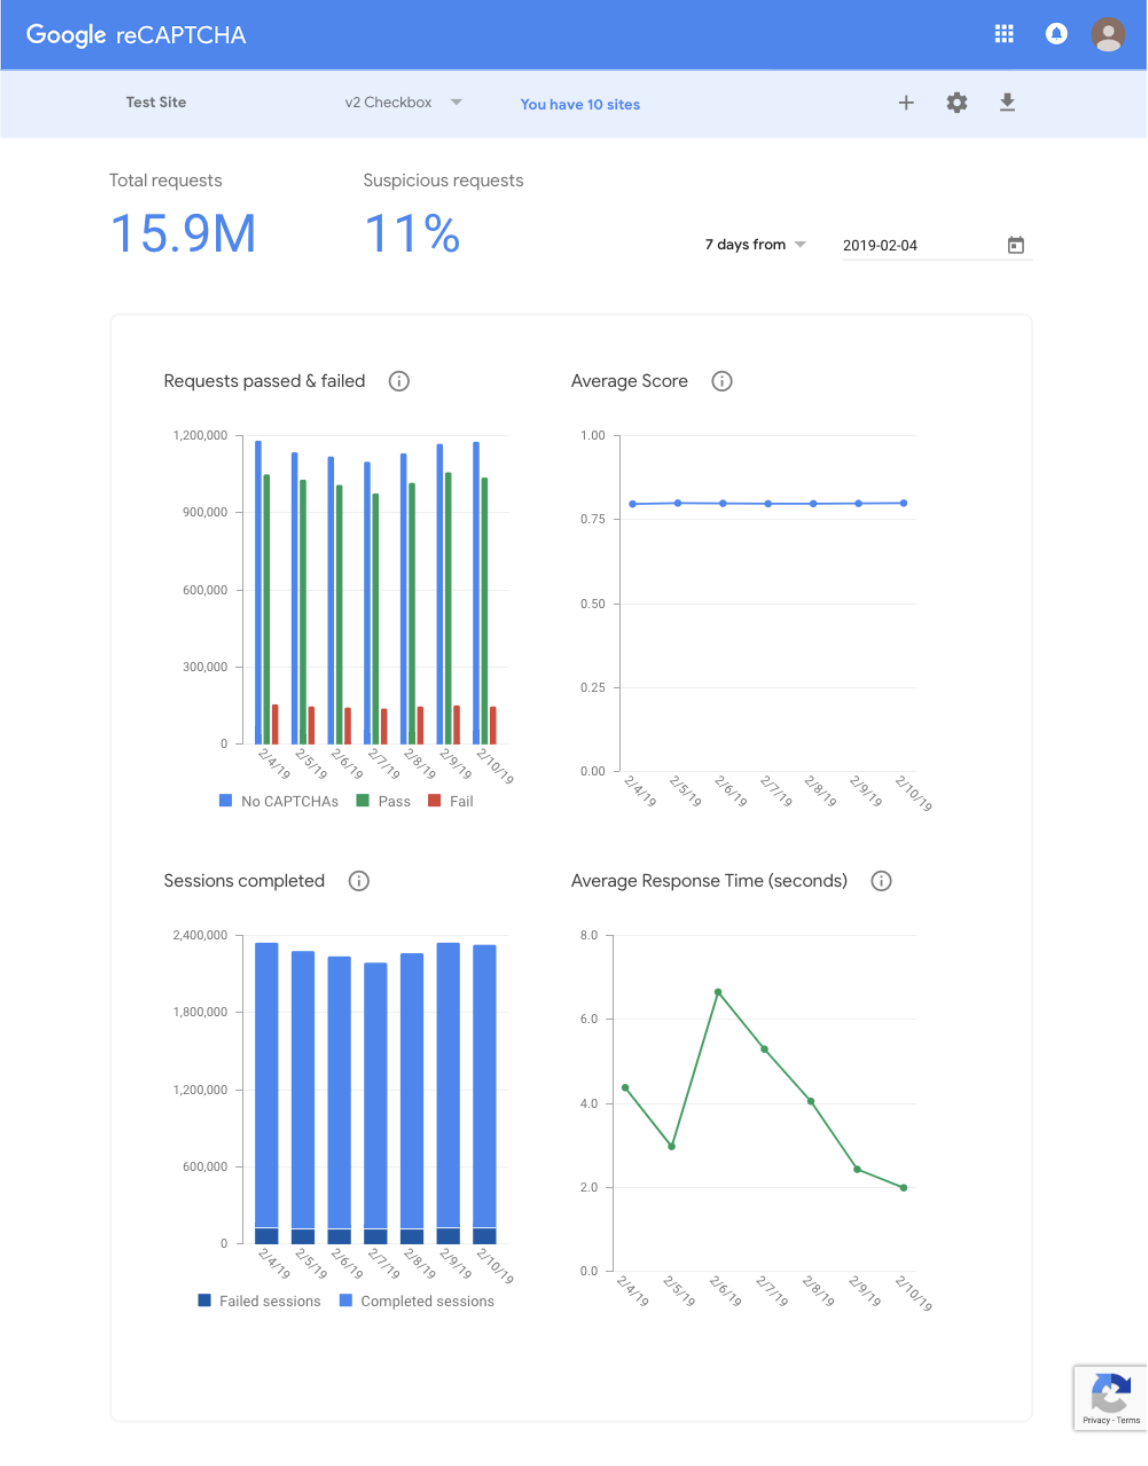
reCAPTCHA v2 사이트 유형에 사용할 수 있는 차트는 4가지입니다. 사이트에 충분한 트래픽이 발생하기 전에는 일부 차트가 표시되지 않을 수 있습니다.
차트로 |
사이트 유형 |
설명 |
통과 및 실패 |
체크박스, Android, 숨김 |
이 차트에는 사용자 또는 봇이 매일 사이트에서 개별 보안문자를 통과하거나 통과하지 못한 횟수가 나와 있습니다. 실패한 숫자가 표시된다고 해서 반드시 사용자가 문제를 해결하지 못했다는 의미는 아닙니다. 또한 reCAPTCHA에서 요청이 타당하다고 확신했기 때문에 보안문자가 표시되지 않은 횟수도 보여줍니다. |
평균 점수 |
체크박스, Android, 숨김 |
이 차트는 사이트의 평균 점수를 보여주며, 이는 추세를 파악하는 데 도움이 됩니다.
점수 범위는 0.0~1.0이며, 0.0은 악성 트래픽을, 1.0은 양호한 트래픽을 나타냅니다. reCAPTCHA v3에 가입하여 트래픽에 대한 자세한 정보를 확인하세요. |
완료된 세션 |
체크박스, Android |
이 차트에는 사용자 또는 로봇이 reCAPTCHA와 상호작용하고 reCAPTCHA 인증을 완료한 횟수가 나와 있습니다. |
평균 응답 시간 |
체크박스, Android |
이 차트에는 실패한 시도 및 새로고침을 포함하여 사용자와 봇이 reCAPTCHA 세션을 완료하는 데 걸린 평균 시간이 표시됩니다. |
reCAPTCHA v3

reCAPTCHA v3 사이트 유형에 사용할 수 있는 차트는 4가지입니다. 충분한 실시간 트래픽이 발생하면 점수가 정확하지 않을 수 있습니다.
차트로 |
설명 |
요청 수 |
이 차트에는 사이트에서 지정된 작업 이름에 대해 reCAPTCHA가 수신한 요청 수가 표시됩니다. |
점수 분포 |
이 차트는 사이트의 지정된 액션 이름에 대한 점수 분포를 보여줍니다.
점수 범위는 0.0~1.0이며, 0.0은 악성 트래픽을, 1.0은 양호한 트래픽을 나타냅니다. |
상위 액션 10개 |
이 차트에는 사이트의 전체 트래픽 기준 상위 10개 액션이 표시됩니다. 사이트에 대한 적응형 위험 분석을 개선하고 트래픽을 더 자세히 분석하려면 reCAPTCHA 인증을 실행하는 각 위치에서 작업 이름을 지정하세요. |
의심스러운 트래픽 액션 상위 10개 |
이 차트에는 사이트의 상위 10개 작업이 의심스러운 트래픽 비율을 기준으로 내림차순으로 나와 있습니다. 사이트에 대한 적응형 위험 분석을 개선하고 트래픽을 더 자세히 분석하려면 reCAPTCHA 인증을 실행하는 각 위치에서 작업 이름을 지정하세요. |
달리 명시되지 않는 한 이 페이지의 콘텐츠에는 Creative Commons Attribution 4.0 라이선스에 따라 라이선스가 부여되며, 코드 샘플에는 Apache 2.0 라이선스에 따라 라이선스가 부여됩니다. 자세한 내용은 Google Developers 사이트 정책을 참조하세요. 자바는 Oracle 및/또는 Oracle 계열사의 등록 상표입니다.
최종 업데이트: 2025-07-25(UTC)
[null,null,["최종 업데이트: 2025-07-25(UTC)"],[[["\u003cp\u003eThe Admin Console analytics page offers insights into website traffic using interactive charts and downloadable CSV data for the past 90 days.\u003c/p\u003e\n"],["\u003cp\u003ereCAPTCHA v2 analytics include charts for pass/fail rates, average score, sessions completed, and average response time, varying by site type.\u003c/p\u003e\n"],["\u003cp\u003ereCAPTCHA v3 analytics provide data on request numbers, score distribution, and top actions based on overall and suspicious traffic, requiring specific action names for detailed analysis.\u003c/p\u003e\n"],["\u003cp\u003eCharts might not display accurate data or be available until sufficient traffic has been processed by reCAPTCHA.\u003c/p\u003e\n"]]],["The Admin Console's analytics page provides traffic insights, allowing users to view data through interactive charts for the past 90 days or download it in CSV format. For reCAPTCHA v2, charts display passed/failed CAPTCHA challenges, average scores, completed sessions, and average response times. For reCAPTCHA v3, charts detail request numbers, score distribution, top 10 actions, and top 10 suspicious traffic actions. Specifying action names improves adaptive risk analysis.\n"],null,["# Analytics\n\nThe Admin Console analytics page provides a detailed view into traffic on your\nsite. You can use the interactive charts to look at your traffic in any given\nweek over the past 90 days. Alternatively, you can download the data in a CSV\nformat.\n\nreCAPTCHA v2\n------------\n\nThere are 4 charts available for the reCAPTCHA v2 site type. Some of the charts\nmight not be shown before there is sufficient traffic to your site.\n\n| Chart | Site type | Description |\n|-----------------------|------------------------------|---------------------------------------------------------------------------------------------------------------------------------------------------------------------------------------------------------------------------------------------------------------------------------------------------------------------------------------|\n| Passed and Failed | Checkbox, Android, Invisible | This chart shows how many times a user or bot passed or failed an individual CAPTCHA challenge on your site each day. The failed number does not necessarily mean the user did not eventually solve the challenge. It also shows how many times no CAPTCHA was shown because reCAPTCHA was confident that the request was legitimate. |\n| Average Score | Checkbox, Android, Invisible | This chart shows the average score on your site, which is designed to help you spot trends. Scores range from 0.0 to 1.0, with 0.0 indicating abusive traffic and 1.0 indicating good traffic. Sign up for [reCAPTCHA v3](/recaptcha/docs/v3) to gain more insights about your traffic. |\n| Sessions Completed | Checkbox, Android | This chart shows how many times a user or bot interacted with reCAPTCHA and completed reCAPTCHA verification. |\n| Average Response Time | Checkbox, Android | This chart shows the average time it took humans and bots to complete a reCAPTCHA session, including failed attempts and reloads. |\n\nreCAPTCHA v3\n------------\n\nThere are 4 charts available for the reCAPTCHA v3 site type. Note that the\nscores may not be accurate before running with sufficient live traffic.\n\n| Chart | Description |\n|-----------------------------------|-------------------------------------------------------------------------------------------------------------------------------------------------------------------------------------------------------------------------------------------------------------------------------------------------------|\n| Number of Requests | This chart shows the number of requests that reCAPTCHA received from your site for the specified action name. |\n| Score Distribution | This chart shows the distribution of scores for your site for the specified action name. Scores range from 0.0 to 1.0, with 0.0 indicating abusive traffic and 1.0 indicating good traffic. |\n| Top 10 Actions | This chart shows the top 10 actions (by overall traffic) for your site. To improve the adaptive risk analysis for your site and to view a more detailed breakdown of your traffic, specify an action name in each place that you execute reCAPTCHA verification. |\n| Top 10 Suspicious Traffic Actions | This chart shows the top 10 actions (in descending order of percentage of suspicious traffic) for your site. To improve the adaptive risk analysis for your site and to view a more detailed breakdown of your traffic, specify an action name in each place that you execute reCAPTCHA verification. |"]]