Analytics
透過集合功能整理內容
你可以依據偏好儲存及分類內容。
管理控制台的「數據分析」頁面會顯示網站流量的詳細檢視畫面,您可以使用互動式圖表查看過去 90 天內任一週的流量。您也可以下載 CSV 格式的資料。
reCAPTCHA v2

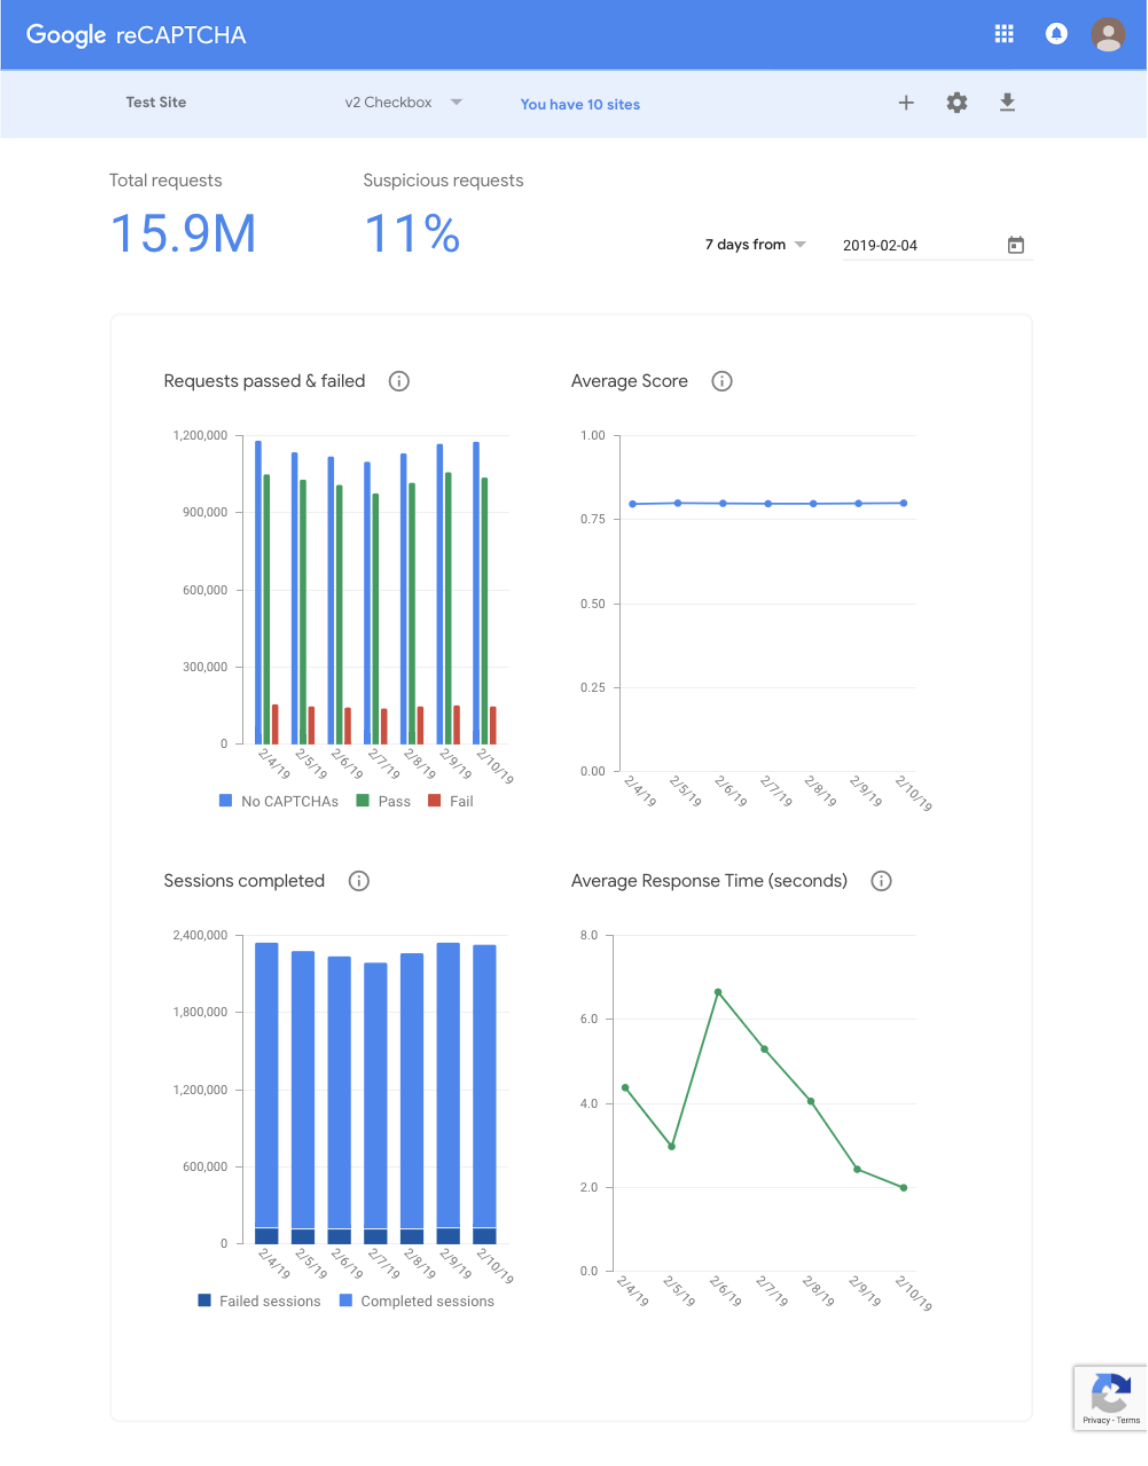
reCAPTCHA v2 網站類型會有 4 個圖表,在網站流量足夠前,部分圖表可能不會顯示。
圖表 |
網站類型 |
說明 |
通過和失敗 |
核取方塊、Android、隱形 |
這張圖表顯示網站中,使用者/機器人每天通過或失敗的個人人機驗證 (Captcha) 驗證次數。失敗的數目不一定代表使用者最終沒有解決問題。這個圖表也會顯示 reCAPTCHA 確認要求合法後,沒有人機驗證 (CAPTCHA) 看到的次數。 |
平均分數 |
核取方塊、Android、隱形 |
這個圖表會顯示你網站上的平均分數,協助你瞭解趨勢。
分數範圍從 0.0 到 1.0,0.0 表示濫用流量,1.0 表示流量正常。註冊 reCAPTCHA v3,即可取得更多流量深入分析結果。 |
已完成的工作階段 |
核取方塊、Android |
這個圖表顯示使用者/機器人與 reCAPTCHA 互動並完成 reCAPTCHA 驗證的次數。 |
平均回應時間 |
核取方塊、Android |
這張圖表顯示人類和機器人完成 reCAPTCHA 工作階段所需的平均時間,包括嘗試失敗和重新載入的時間。 |
reCAPTCHA v3

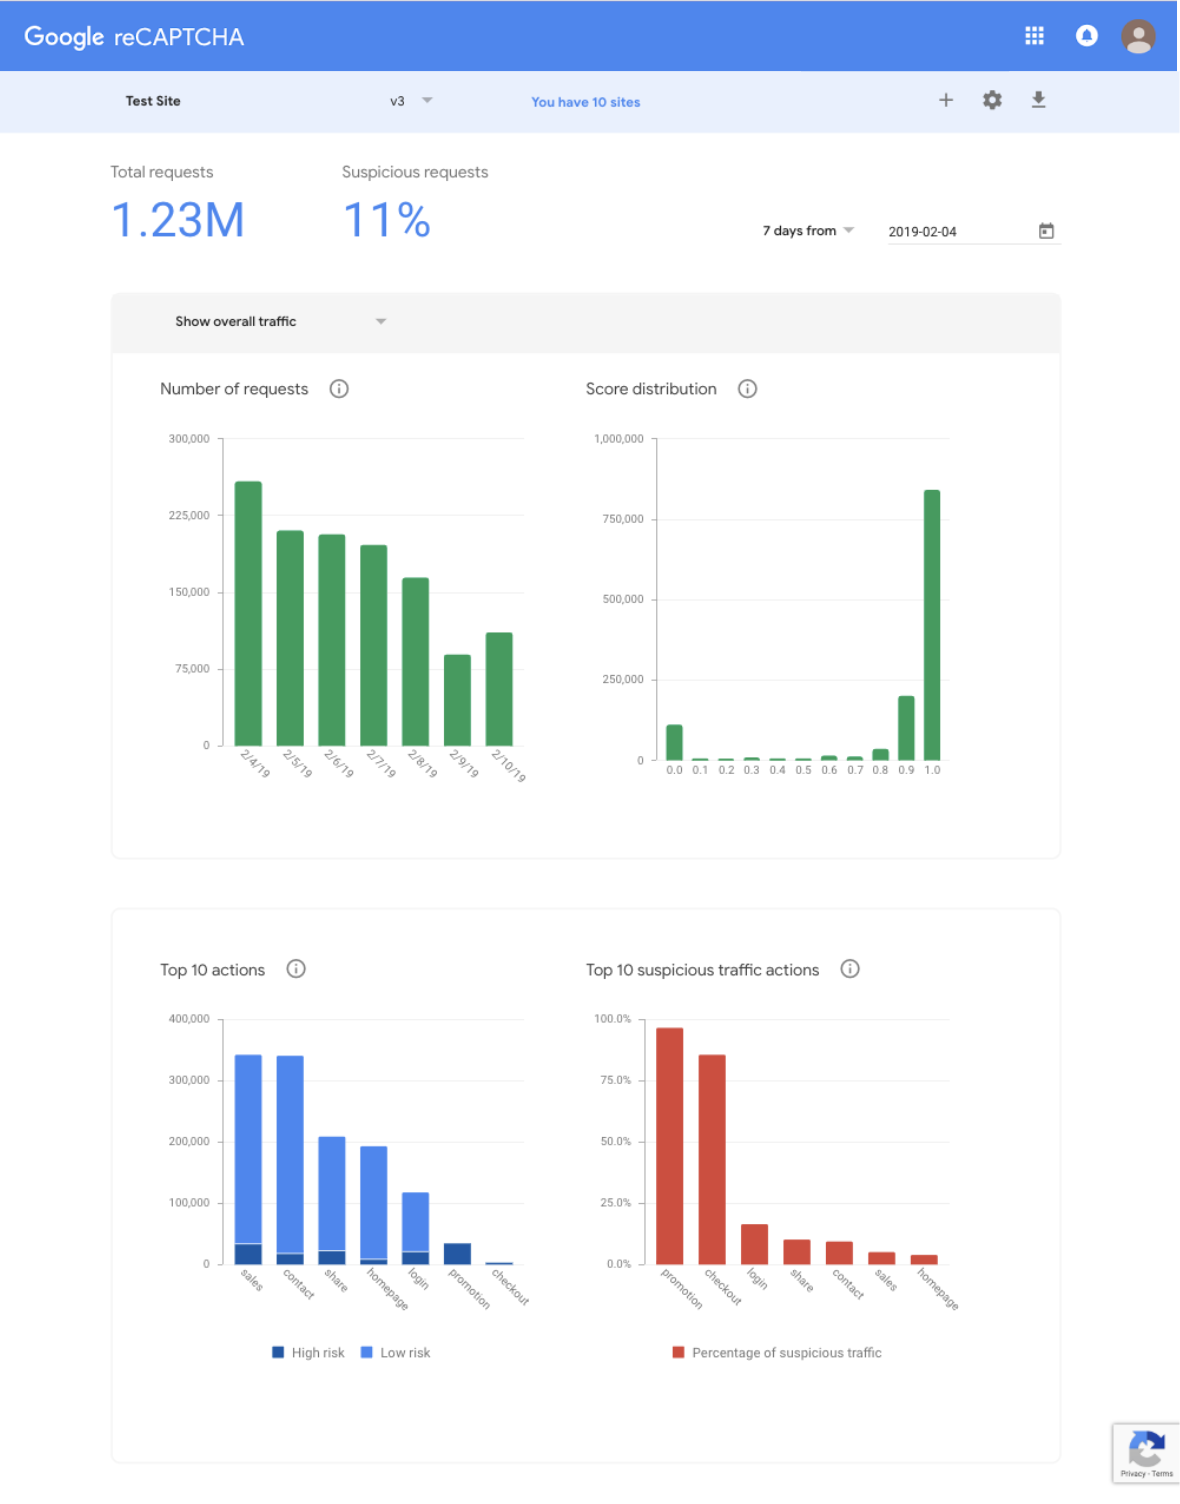
reCAPTCHA v3 網站類型會有 4 個圖表,請注意,在獲得足夠的即時流量之前,分數可能不準確。
圖表 |
說明 |
要求數量 |
這份圖表顯示 reCAPTCHA 從你的網站收到的指定動作名稱要求數量。 |
分數分佈圖 |
這個圖表會顯示網站上指定動作名稱的分數分佈情形。
分數範圍從 0.0 到 1.0,0.0 表示濫用流量,1.0 表示流量正常。 |
最常見的 10 項動作 |
此圖表會顯示你網站上最常發生的 10 項動作 (依整體流量計算)。如要改善網站的適應風險分析作業,並進一步查看更詳細的流量資料,請在要執行 reCAPTCHA 驗證的每個位置指定動作名稱。 |
前 10 大可疑的流量動作 |
這份圖表顯示你網站上最常發生的 10 項動作 (依可疑流量百分比遞減排序)。如要改善網站的適應風險分析作業,並查看更詳細的流量細目,請在要執行 reCAPTCHA 驗證的每個位置指定動作名稱。 |
除非另有註明,否則本頁面中的內容是採用創用 CC 姓名標示 4.0 授權,程式碼範例則為阿帕契 2.0 授權。詳情請參閱《Google Developers 網站政策》。Java 是 Oracle 和/或其關聯企業的註冊商標。
上次更新時間:2025-07-25 (世界標準時間)。
[null,null,["上次更新時間:2025-07-25 (世界標準時間)。"],[[["\u003cp\u003eThe Admin Console analytics page offers insights into website traffic using interactive charts and downloadable CSV data for the past 90 days.\u003c/p\u003e\n"],["\u003cp\u003ereCAPTCHA v2 analytics include charts for pass/fail rates, average score, sessions completed, and average response time, varying by site type.\u003c/p\u003e\n"],["\u003cp\u003ereCAPTCHA v3 analytics provide data on request numbers, score distribution, and top actions based on overall and suspicious traffic, requiring specific action names for detailed analysis.\u003c/p\u003e\n"],["\u003cp\u003eCharts might not display accurate data or be available until sufficient traffic has been processed by reCAPTCHA.\u003c/p\u003e\n"]]],["The Admin Console's analytics page provides traffic insights, allowing users to view data through interactive charts for the past 90 days or download it in CSV format. For reCAPTCHA v2, charts display passed/failed CAPTCHA challenges, average scores, completed sessions, and average response times. For reCAPTCHA v3, charts detail request numbers, score distribution, top 10 actions, and top 10 suspicious traffic actions. Specifying action names improves adaptive risk analysis.\n"],null,["# Analytics\n\nThe Admin Console analytics page provides a detailed view into traffic on your\nsite. You can use the interactive charts to look at your traffic in any given\nweek over the past 90 days. Alternatively, you can download the data in a CSV\nformat.\n\nreCAPTCHA v2\n------------\n\nThere are 4 charts available for the reCAPTCHA v2 site type. Some of the charts\nmight not be shown before there is sufficient traffic to your site.\n\n| Chart | Site type | Description |\n|-----------------------|------------------------------|---------------------------------------------------------------------------------------------------------------------------------------------------------------------------------------------------------------------------------------------------------------------------------------------------------------------------------------|\n| Passed and Failed | Checkbox, Android, Invisible | This chart shows how many times a user or bot passed or failed an individual CAPTCHA challenge on your site each day. The failed number does not necessarily mean the user did not eventually solve the challenge. It also shows how many times no CAPTCHA was shown because reCAPTCHA was confident that the request was legitimate. |\n| Average Score | Checkbox, Android, Invisible | This chart shows the average score on your site, which is designed to help you spot trends. Scores range from 0.0 to 1.0, with 0.0 indicating abusive traffic and 1.0 indicating good traffic. Sign up for [reCAPTCHA v3](/recaptcha/docs/v3) to gain more insights about your traffic. |\n| Sessions Completed | Checkbox, Android | This chart shows how many times a user or bot interacted with reCAPTCHA and completed reCAPTCHA verification. |\n| Average Response Time | Checkbox, Android | This chart shows the average time it took humans and bots to complete a reCAPTCHA session, including failed attempts and reloads. |\n\nreCAPTCHA v3\n------------\n\nThere are 4 charts available for the reCAPTCHA v3 site type. Note that the\nscores may not be accurate before running with sufficient live traffic.\n\n| Chart | Description |\n|-----------------------------------|-------------------------------------------------------------------------------------------------------------------------------------------------------------------------------------------------------------------------------------------------------------------------------------------------------|\n| Number of Requests | This chart shows the number of requests that reCAPTCHA received from your site for the specified action name. |\n| Score Distribution | This chart shows the distribution of scores for your site for the specified action name. Scores range from 0.0 to 1.0, with 0.0 indicating abusive traffic and 1.0 indicating good traffic. |\n| Top 10 Actions | This chart shows the top 10 actions (by overall traffic) for your site. To improve the adaptive risk analysis for your site and to view a more detailed breakdown of your traffic, specify an action name in each place that you execute reCAPTCHA verification. |\n| Top 10 Suspicious Traffic Actions | This chart shows the top 10 actions (in descending order of percentage of suspicious traffic) for your site. To improve the adaptive risk analysis for your site and to view a more detailed breakdown of your traffic, specify an action name in each place that you execute reCAPTCHA verification. |"]]