Ajouter des graphiques à vos diapositives

Cette page explique comment utiliser des graphiques Google Sheets existants pour les ajouter à des présentations Google Slides.

L'ajout de graphiques à une présentation peut contribuer à créer plus d'impact et à rendre les données pertinentes pour votre public. Les graphiques sont des outils particulièrement puissants pour montrer des modèles ou des tendances dans un ensemble de données. Ils peuvent vous aider à communiquer clairement sur des données quantitatives.

La vidéo ci-dessus explique comment générer des diapositives à partir des données d'une feuille de calcul. Il comprend un exemple complet (Python) qui ajoute un graphique à une diapositive et importe également les données des cellules de la feuille de calcul dans un tableau.

À propos de l'ajout de graphiques

Chaque fois que vous présentez des informations quantitatives, les graphiques de données peuvent améliorer votre présentation. L'API Slides vous permet d'inclure n'importe quel graphique que vous pouvez créer dans Google Sheets: graphiques à barres, graphiques en courbes, graphiques à secteurs, etc.

concept consistant à ajouter un graphique Google Sheets à une présentation de l'API Slides

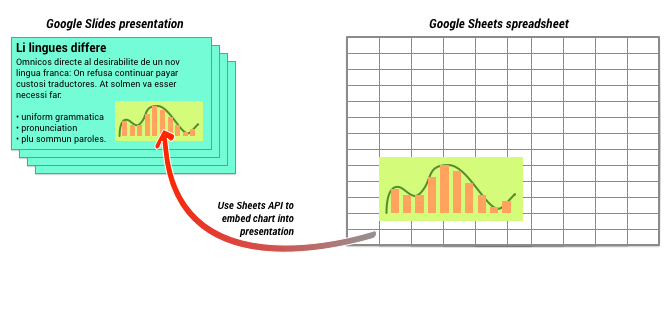
Comme le montre le schéma ci-dessus, vous devez d'abord créer le graphique dans Google Sheets. Une fois le graphique créé, vous pouvez l’intégrer à votre présentation.

Le processus général de gestion des graphiques dans votre présentation est le suivant:

  1. Créez un graphique dans Google Sheets.
  2. Utilisez l'API Sheets pour lire l'ID de graphique du EmbeddedChart obtenu.
  3. Utilisez CreateSheetsChartRequest une fois pour l'ajouter à une diapositive.
  4. Si nécessaire, utilisez RefreshSheetsChartRequest pour le synchroniser avec les données sources.

Graphiques statiques et graphiques associés

Lorsque vous utilisez l'API pour ajouter un graphique à votre présentation, vous spécifiez l'un des paramètres LinkingMode. Cela détermine si le graphique est ajouté en tant qu'image statique ou en tant qu'objet pouvant être actualisé à l'avenir.

Utilisez le mode LINKED dans les cas suivants:

  • Vous souhaitez actualiser le graphique à l'avenir, en reflétant les modifications apportées aux données sous-jacentes.
  • Vous souhaitez que les collaborateurs disposent d'un lien vers la feuille de calcul contenant le graphique source.

Utilisez le mode NOT_LINKED_IMAGE (statique) dans les cas suivants:

  • Vous voulez que le graphique ne change jamais à l’avenir.
  • Vous ne souhaitez pas que les collaborateurs voient un lien vers la feuille de calcul source.

Champs d'application permettant d'accéder à Google Sheets

Lorsque vous ajoutez un graphique à votre diapositive, l'API Slides doit y accéder dans Google Sheets. Cela signifie que votre requête doit utiliser l'un des champs d'application suivants:

  • https://www.googleapis.com/auth/spreadsheets.readonly (rôle à privilégier)
  • https://www.googleapis.com/auth/spreadsheets
  • https://www.googleapis.com/auth/drive.readonly
  • https://www.googleapis.com/auth/drive

Le champ d'application de spreadsheets.readonly est généralement le meilleur à utiliser, car il est le plus restrictif. Toutefois, si votre application utilise déjà l'un des autres champs d'application répertoriés ci-dessus, utilisez-le.

Ajouter un graphique

Pour ajouter un graphique, vous devez connaître l'ID de la feuille de calcul et celui du graphique dans Google Sheets. Ensuite, appelez la méthode batchUpdate en utilisant CreateSheetsChartRequest une fois pour ajouter le graphique.

L'exemple suivant prend un graphique et l'ajoute à une diapositive en tant que LINKED afin qu'il puisse être actualisé ultérieurement.

Apps Script ;

slides/api/Snippets.gs
/**
 * Embed a Sheets chart (indicated by the spreadsheetId and sheetChartId) onto
 *   a page in the presentation. Setting the linking mode as 'LINKED' allows the
 *   chart to be refreshed if the Sheets version is updated.
 * @param {string} presentationId
 * @param {string} pageId
 * @param {string} shapeId
 * @param {string} sheetChartId
 * @returns {*}
 */
function createSheetsChart(presentationId, pageId, shapeId, sheetChartId) {
  const emu4M = {
    magnitude: 4000000,
    unit: 'EMU'
  };
  const presentationChartId = 'MyEmbeddedChart';
  const requests = [{
    createSheetsChart: {
      objectId: presentationChartId,
      spreadsheetId: shapeId,
      chartId: sheetChartId,
      linkingMode: 'LINKED',
      elementProperties: {
        pageObjectId: pageId,
        size: {
          height: emu4M,
          width: emu4M
        },
        transform: {
          scaleX: 1,
          scaleY: 1,
          translateX: 100000,
          translateY: 100000,
          unit: 'EMU'
        }
      }
    }
  }];

  // Execute the request.
  try {
    const batchUpdateResponse = Slides.Presentations.batchUpdate({
      requests: requests
    }, presentationId);
    console.log('Added a linked Sheets chart with ID: %s', presentationChartId);

    return batchUpdateResponse;
  } catch (err) {
    // TODO (Developer) - Handle exception
    console.log('Failed with error: %s', err.error);
  }
};

Go

slides/extraits/presentations.go
// Embed a Sheets chart (indicated by the spreadsheetId and sheetChartId) onto
// a page in the presentation. Setting the linking mode as "LINKED" allows the
// chart to be refreshed if the Sheets version is updated.
emu4M := slides.Dimension{Magnitude: 4000000, Unit: "EMU"}
presentationChartId := "MyEmbeddedChart"
requests := []*slides.Request{{
	CreateSheetsChart: &slides.CreateSheetsChartRequest{
		ObjectId:      presentationChartId,
		SpreadsheetId: spreadsheetId,
		ChartId:       sheetChartId,
		LinkingMode:   "LINKED",
		ElementProperties: &slides.PageElementProperties{
			PageObjectId: pageId,
			Size: &slides.Size{
				Height: &emu4M,
				Width:  &emu4M,
			},
			Transform: &slides.AffineTransform{
				ScaleX:     1.0,
				ScaleY:     1.0,
				TranslateX: 100000.0,
				TranslateY: 100000.0,
				Unit:       "EMU",
			},
		},
	},
}}

// Execute the requests.
body := &slides.BatchUpdatePresentationRequest{Requests: requests}
response, _ := slidesService.Presentations.BatchUpdate(presentationId, body).Do()
fmt.Printf("Added a linked Sheets chart with ID %s", presentationChartId)

Java

slides/snippets/src/main/java/CreateSheetsChart.java
import com.google.api.client.googleapis.json.GoogleJsonError;
import com.google.api.client.googleapis.json.GoogleJsonResponseException;
import com.google.api.client.http.HttpRequestInitializer;
import com.google.api.client.http.javanet.NetHttpTransport;
import com.google.api.client.json.gson.GsonFactory;
import com.google.api.services.slides.v1.Slides;
import com.google.api.services.slides.v1.SlidesScopes;
import com.google.api.services.slides.v1.model.AffineTransform;
import com.google.api.services.slides.v1.model.BatchUpdatePresentationRequest;
import com.google.api.services.slides.v1.model.BatchUpdatePresentationResponse;
import com.google.api.services.slides.v1.model.CreateSheetsChartRequest;
import com.google.api.services.slides.v1.model.Dimension;
import com.google.api.services.slides.v1.model.PageElementProperties;
import com.google.api.services.slides.v1.model.Request;
import com.google.api.services.slides.v1.model.Size;
import com.google.auth.http.HttpCredentialsAdapter;
import com.google.auth.oauth2.GoogleCredentials;

import java.io.IOException;
import java.util.ArrayList;
import java.util.Collections;
import java.util.List;

/* Class to demonstrate the use of Slides Create Chart API */
public class CreateSheetsChart {
  /**
   * Adds chart from spreadsheet to slides as linked.
   *
   * @param presentationId - id of the presentation.
   * @param pageId         - id of the page.
   * @param spreadsheetId  - id of the spreadsheet.
   * @param sheetChartId   - id of the chart in sheets.
   * @return presentation chart id
   * @throws IOException - if credentials file not found.
   */
  public static BatchUpdatePresentationResponse createSheetsChart(
      String presentationId, String pageId, String spreadsheetId, Integer sheetChartId)
      throws IOException {
        /* Load pre-authorized user credentials from the environment.
           TODO(developer) - See https://developers.google.com/identity for
            guides on implementing OAuth2 for your application. */
    GoogleCredentials credentials = GoogleCredentials.getApplicationDefault()
        .createScoped(Collections.singleton(SlidesScopes.PRESENTATIONS));
    HttpRequestInitializer requestInitializer = new HttpCredentialsAdapter(
        credentials);

    // Create the slides API client
    Slides service = new Slides.Builder(new NetHttpTransport(),
        GsonFactory.getDefaultInstance(),
        requestInitializer)
        .setApplicationName("Slides samples")
        .build();

    // Embed a Sheets chart (indicated by the spreadsheetId and sheetChartId) onto
    // a page in the presentation. Setting the linking mode as "LINKED" allows the
    // chart to be refreshed if the Sheets version is updated.
    List<Request> requests = new ArrayList<>();
    Dimension emu4M = new Dimension().setMagnitude(4000000.0).setUnit("EMU");
    String presentationChartId = "MyEmbeddedChart";
    requests.add(new Request()
        .setCreateSheetsChart(new CreateSheetsChartRequest()
            .setObjectId(presentationChartId)
            .setSpreadsheetId(spreadsheetId)
            .setChartId(sheetChartId)
            .setLinkingMode("LINKED")
            .setElementProperties(new PageElementProperties()
                .setPageObjectId(pageId)
                .setSize(new Size()
                    .setHeight(emu4M)
                    .setWidth(emu4M))
                .setTransform(new AffineTransform()
                    .setScaleX(1.0)
                    .setScaleY(1.0)
                    .setTranslateX(100000.0)
                    .setTranslateY(100000.0)
                    .setUnit("EMU")))));

    BatchUpdatePresentationResponse response = null;
    try {
      // Execute the request.
      BatchUpdatePresentationRequest body =
          new BatchUpdatePresentationRequest().setRequests(requests);
      response = service.presentations().batchUpdate(presentationId, body).execute();
      System.out.println("Added a linked Sheets chart with ID " + presentationChartId);
    } catch (GoogleJsonResponseException e) {
      // TODO(developer) - handle error appropriately
      GoogleJsonError error = e.getDetails();
      if (error.getCode() == 404) {
        System.out.printf("Presentation not found with id '%s'.\n", presentationId);
      } else {
        throw e;
      }
    }
    return response;
  }
}

JavaScript

slides/snippets/slides_create_sheets_chart.js
function createSheetsChart(presentationId, pageId, shapeId, sheetChartId, callback) {
  // Embed a Sheets chart (indicated by the spreadsheetId and sheetChartId) onto
  // a page in the presentation. Setting the linking mode as "LINKED" allows the
  // chart to be refreshed if the Sheets version is updated.
  const emu4M = {
    magnitude: 4000000,
    unit: 'EMU',
  };
  const presentationChartId = 'MyEmbeddedChart';
  const requests = [{
    createSheetsChart: {
      objectId: presentationChartId,
      spreadsheetId: shapeId,
      chartId: sheetChartId,
      linkingMode: 'LINKED',
      elementProperties: {
        pageObjectId: pageId,
        size: {
          height: emu4M,
          width: emu4M,
        },
        transform: {
          scaleX: 1,
          scaleY: 1,
          translateX: 100000,
          translateY: 100000,
          unit: 'EMU',
        },
      },
    },
  }];
  // Execute the request.
  try {
    gapi.client.slides.presentations.batchUpdate({
      presentationId: presentationId,
      requests: requests,
    }).then((batchUpdateResponse) => {
      console.log(`Added a linked Sheets chart with ID: ${presentationChartId}`);
      if (callback) callback(batchUpdateResponse.result);
    });
  } catch (err) {
    document.getElementById('content').innerText = err.message;
    return;
  }
}

Node.js

slides/snippets/slides_create_sheets_chart.js
/**
 * Embeds a Sheets chart onto a page in a presentation.
 * @param {string} presentationId The presentation ID.
 * @param {string} pageId The page ID.
 * @param {string} spreadsheetId The spreadsheet ID.
 * @param {string} sheetChartId The sheet's chart ID.
 */
async function createSheetsChart(
    presentationId,
    pageId,
    spreadsheetId,
    sheetChartId,
) {
  const {GoogleAuth} = require('google-auth-library');
  const {google} = require('googleapis');

  const auth = new GoogleAuth({
    scopes: 'https://www.googleapis.com/auth/presentations',
  });

  const service = google.slides({version: 'v1', auth});

  // Embed a Sheets chart (indicated by the spreadsheetId and sheetChartId) onto
  // a page in the presentation. Setting the linking mode as "LINKED" allows the
  // chart to be refreshed if the Sheets version is updated.
  const emu4M = {
    magnitude: 4000000,
    unit: 'EMU',
  };
  const presentationChartId = 'MyEmbeddedChart';
  const requests = [
    {
      createSheetsChart: {
        objectId: presentationChartId,
        spreadsheetId: spreadsheetId,
        chartId: sheetChartId,
        linkingMode: 'LINKED',
        elementProperties: {
          pageObjectId: pageId,
          size: {
            height: emu4M,
            width: emu4M,
          },
          transform: {
            scaleX: 1,
            scaleY: 1,
            translateX: 100000,
            translateY: 100000,
            unit: 'EMU',
          },
        },
      },
    },
  ];

  // Execute the request.
  try {
    const batchUpdateResponse = await service.presentations.batchUpdate({
      presentationId,
      resource: {
        requests,
      },
    });
    console.log(`Added a linked Sheets chart with ID: ${presentationChartId}`);
    return batchUpdateResponse.data;
  } catch (err) {
    // TODO (developer) - Handle exception
    throw err;
  }
}

PHP

slides/snippets/src/SlidesCreateSheetsChart.php
use Google\Client;
use Google\Service\Drive;
use Google\Service\Slides;
use Google\Service\Slides\Request;


function createSheetsChart($presentationId, $pageId, $spreadsheetId, $sheetChartId)
{
    /* Load pre-authorized user credentials from the environment.
       TODO(developer) - See https://developers.google.com/identity for
        guides on implementing OAuth2 for your application. */
    $client = new Google\Client();
    $client->useApplicationDefaultCredentials();
    $client->addScope(Google\Service\Drive::DRIVE);
    $slidesService = new Google_Service_Slides($client);
    // Embed a Sheets chart (indicated by the spreadsheet_id and sheet_chart_id) onto
    // a page in the presentation. Setting the linking mode as "LINKED" allows the
    // chart to be refreshed if the Sheets version is updated.
    try {
        //creating new presentaion chart
        $presentationChartId = 'MyEmbeddedChart';
        $emu4M = array('magnitude' => 4000000, 'unit' => 'EMU');
        $requests = array();
        $requests[] = new Google_Service_Slides_Request(
            array(
                'createSheetsChart' => array(
                    'spreadsheetId' => $spreadsheetId,
                    'chartId' => $sheetChartId,
                    'linkingMode' => 'LINKED',
                    'elementProperties' => array(
                        'pageObjectId' => $pageId,
                        'size' => array(
                            'height' => $emu4M,
                            'width' => $emu4M
                        ),
                        'transform' => array(
                            'scaleX' => 1,
                            'scaleY' => 1,
                            'translateX' => 100000,
                            'translateY' => 100000,
                            'unit' => 'EMU'
                        )
                    )
                )
            ));

        // Execute the request.
        $batchUpdateRequest = new Google_Service_Slides_BatchUpdatePresentationRequest(array(
            'requests' => $requests
        ));
        $response = $slidesService->presentations->batchUpdate($presentationId, $batchUpdateRequest);
        printf("Added a linked Sheets chart with ID: %s\n", $response->getPresentationId());
        return $response;
    } catch (Exception $e) {
        echo 'Message: ' . $e->getMessage();
    }
}

Python

slides/snippets/slides_create_sheets_chart.py
import google.auth
from googleapiclient.discovery import build
from googleapiclient.errors import HttpError


def create_sheets_chart(
    presentation_id, page_id, spreadsheet_id, sheet_chart_id
):
  """
  create_sheets_chart the user has access to.
  Load pre-authorized user credentials from the environment.
  TODO(developer) - See https://developers.google.com/identity
  for guides on implementing OAuth2 for the application.
  """
  creds, _ = google.auth.default()
  # pylint: disable=maybe-no-member
  try:
    slides_service = build("slides", "v1", credentials=creds)
    # Embed a Sheets chart (indicated by the spreadsheet_id and
    # sheet_chart_id) onto a page in the presentation.
    # Setting the linking mode as "LINKED" allows the
    # chart to be refreshed if the Sheets version is updated.

    emu4m = {"magnitude": 4000000, "unit": "EMU"}

    presentation_chart_id = "MyEmbeddedChart"
    requests = [
        {
            "createSheetsChart": {
                "objectId": presentation_chart_id,
                "spreadsheetId": spreadsheet_id,
                "chartId": sheet_chart_id,
                "linkingMode": "LINKED",
                "elementProperties": {
                    "pageObjectId": page_id,
                    "size": {"height": emu4m, "width": emu4m},
                    "transform": {
                        "scaleX": 1,
                        "scaleY": 1,
                        "translateX": 100000,
                        "translateY": 100000,
                        "unit": "EMU",
                    },
                },
            }
        }
    ]

    # Execute the request.
    body = {"requests": requests}
    response = (
        slides_service.presentations()
        .batchUpdate(presentationId=presentation_id, body=body)
        .execute()
    )
    print(f"Added a linked Sheets chart with ID: {presentation_chart_id}")
    return response
  except HttpError as error:
    print(f"An error occurred: {error}")
    return error


if __name__ == "__main__":
  # Put the presentation_id, Page_id of slides
  # spreadsheet_id and sheet_chart_id to be submitted.
  create_sheets_chart(
      "10QnVUx1X2qHsL17WUidGpPh_SQhXYx40CgIxaKk8jU4",
      "FIRSTSLIDE",
      "17eqFZl_WK4WVixX8PjvjfLD77DraoFwMDXeiHB3dvuM",
      "1107320627",
  )

Ruby

slides/snippets/lib/file_snippets.rb
# Embed a Sheets chart (indicated by the spreadsheet_id and sheet_chart_id) onto
# a page in the presentation. Setting the linking mode as "LINKED" allows the
# chart to be refreshed if the Sheets version is updated.
emu4M = {
  magnitude: 4000000,
  unit:      'EMU'
}
presentation_chart_id = 'my_embedded_chart'
requests = [{
  create_sheets_chart: {
    object_id_prop:     presentation_chart_id,
    spreadsheet_id:     spreadsheet_id,
    chart_id:           sheet_chart_id,
    linking_mode:       'LINKED',
    element_properties: {
      page_object_id: page_id,
      size:           {
        height: emu4M,
        width:  emu4M
      },
      transform:      {
        scale_x:     1,
        scale_y:     1,
        translate_x: 100000,
        translate_y: 100000,
        unit:        'EMU'
      }
    }
  }
}]

# Execute the request.
req = Google::Apis::SlidesV1::BatchUpdatePresentationRequest.new(requests: requests)
response = slides_service.batch_update_presentation(presentation_id, req)

puts "Added a linked Sheets chart with ID: #{presentation_chart_id}"

Actualiser un graphique

Si vous avez intégré un graphique LINKED dans votre présentation, vous pouvez l'actualiser à tout moment à l'aide de RefreshSheetsChartRequest. Cette opération met à jour le graphique pour qu'il soit synchronisé avec le graphique Sheets sous-jacent et les données sur lesquelles il est basé.

L'exemple suivant actualise un graphique existant:

Apps Script ;

slides/api/Snippets.gs
/**
 * Refresh the sheets charts
 * @param {string} presentationId
 * @param {string} presentationChartId
 * @returns {*}
 */
function refreshSheetsChart(presentationId, presentationChartId) {
  const requests = [{
    refreshSheetsChart: {
      objectId: presentationChartId
    }
  }];

  // Execute the request.
  try {
    const batchUpdateResponse = Slides.Presentations.batchUpdate({
      requests: requests
    }, presentationId);
    console.log('Refreshed a linked Sheets chart with ID: %s', presentationChartId);

    return batchUpdateResponse;
  } catch (err) {
    // TODO (Developer) - Handle exception
    console.log('Failed with error: %s', err.error);
  }
};

Go

slides/extraits/presentations.go
requests := []*slides.Request{{
	RefreshSheetsChart: &slides.RefreshSheetsChartRequest{
		ObjectId: presentationChartId,
	},
}}

// Execute the requests.
body := &slides.BatchUpdatePresentationRequest{Requests: requests}
response, _ := slidesService.Presentations.BatchUpdate(presentationId, body).Do()
fmt.Printf("Refreshed a linked Sheets chart with ID %s", presentationChartId)

Java

slides/snippets/src/main/java/RefreshSheetsChart.java
import com.google.api.client.googleapis.json.GoogleJsonError;
import com.google.api.client.googleapis.json.GoogleJsonResponseException;
import com.google.api.client.http.HttpRequestInitializer;
import com.google.api.client.http.javanet.NetHttpTransport;
import com.google.api.client.json.gson.GsonFactory;
import com.google.api.services.slides.v1.Slides;
import com.google.api.services.slides.v1.SlidesScopes;
import com.google.api.services.slides.v1.model.BatchUpdatePresentationRequest;
import com.google.api.services.slides.v1.model.BatchUpdatePresentationResponse;
import com.google.api.services.slides.v1.model.RefreshSheetsChartRequest;
import com.google.api.services.slides.v1.model.Request;
import com.google.auth.http.HttpCredentialsAdapter;
import com.google.auth.oauth2.GoogleCredentials;

import java.io.IOException;
import java.util.ArrayList;
import java.util.Collections;
import java.util.List;

/* Class to demonstrate the use of Slides Refresh Chart API */
public class RefreshSheetsChart {
  /**
   * Refresh the sheets charts.
   *
   * @param presentationId      - id of the presentation.
   * @param presentationChartId - id of the presentation chart.
   * @return presentation chart id
   * @throws IOException - if credentials file not found.
   */
  public static BatchUpdatePresentationResponse refreshSheetsChart(
      String presentationId, String presentationChartId) throws IOException {
        /* Load pre-authorized user credentials from the environment.
           TODO(developer) - See https://developers.google.com/identity for
            guides on implementing OAuth2 for your application. */
    GoogleCredentials credentials = GoogleCredentials.getApplicationDefault()
        .createScoped(Collections.singleton(SlidesScopes.PRESENTATIONS));
    HttpRequestInitializer requestInitializer = new HttpCredentialsAdapter(
        credentials);

    // Create the slides API client
    Slides service = new Slides.Builder(new NetHttpTransport(),
        GsonFactory.getDefaultInstance(),
        requestInitializer)
        .setApplicationName("Slides samples")
        .build();

    List<Request> requests = new ArrayList<>();

    // Refresh an existing linked Sheets chart embedded a presentation.
    requests.add(new Request()
        .setRefreshSheetsChart(new RefreshSheetsChartRequest()
            .setObjectId(presentationChartId)));

    BatchUpdatePresentationResponse response = null;
    try {
      // Execute the request.
      BatchUpdatePresentationRequest body =
          new BatchUpdatePresentationRequest().setRequests(requests);
      response = service.presentations().batchUpdate(presentationId, body).execute();
      System.out.println("Refreshed a linked Sheets chart with ID " + presentationChartId);
    } catch (GoogleJsonResponseException e) {
      // TODO(developer) - handle error appropriately
      GoogleJsonError error = e.getDetails();
      if (error.getCode() == 400) {
        System.out.printf("Presentation chart not found with id '%s'.\n", presentationChartId);
      } else if (error.getCode() == 404) {
        System.out.printf("Presentation not found with id '%s'.\n", presentationId);
      } else {
        throw e;
      }
    }
    return response;
  }
}

JavaScript

slides/snippets/slides_refresh_sheets_chart.js
function refreshSheetsChart(presentationId, presentationChartId, callback) {
  const requests = [{
    refreshSheetsChart: {
      objectId: presentationChartId,
    },
  }];
  // Execute the request.
  try {
    gapi.client.slides.presentations.batchUpdate({
      presentationId: presentationId,
      requests: requests,
    }).then((batchUpdateResponse) => {
      console.log(`Refreshed a linked Sheets chart with ID: ${presentationChartId}`);
      if (callback) callback(batchUpdateResponse.result);
    });
  } catch (err) {
    document.getElementById('content').innerText = err.message;
    return;
  }
}

Node.js

slides/snippets/slides_refresh_sheets_chart.js
/**
 * Refreshes an embedded sheet chart.
 * @param {string} presentationId The presentation ID.
 * @param {string} presentationChartId The presentation's chart ID.
 */
async function refreshSheetsChart(presentationId, presentationChartId) {
  const {GoogleAuth} = require('google-auth-library');
  const {google} = require('googleapis');

  const auth = new GoogleAuth({
    scopes: 'https://www.googleapis.com/auth/presentations',
  });

  const service = google.slides({version: 'v1', auth});

  const requests = [
    {
      refreshSheetsChart: {
        objectId: presentationChartId,
      },
    },
  ];

  // Execute the request.
  try {
    const batchUpdateResponse = await service.presentations.batchUpdate({
      presentationId,
      resource: {
        requests,
      },
    });
    console.log(
        `Refreshed a linked Sheets chart with ID: ${presentationChartId}`,
    );
    return batchUpdateResponse.data;
  } catch (err) {
    // TODO (developer) - Handle exception
    throw err;
  }
}

PHP

slides/snippets/src/SlidesRefreshSheetsChart.php
use Google\Client;
use Google\Service\Drive;
use Google\Service\Slides;
use Google\Service\Slides\BatchUpdatePresentationRequest;

function refreshSheetsChart($presentationId, $presentationChartId)
{
    /* Load pre-authorized user credentials from the environment.
       TODO(developer) - See https://developers.google.com/identity for
        guides on implementing OAuth2 for your application. */
    $client = new Google\Client();
    $client->useApplicationDefaultCredentials();
    $client->addScope(Google\Service\Drive::DRIVE);
    $slidesService = new Google_Service_Slides($client);
    try {

        $requests = array();
        $requests[] = new Google_Service_Slides_Request(array(
            'refreshSheetsChart' => array(
                'objectId' => $presentationChartId
            )
        ));

        // Execute the request.
        $batchUpdateRequest = new Google_Service_Slides_BatchUpdatePresentationRequest(array(
            'requests' => $requests
        ));
        $response = $slidesService->presentations->batchUpdate($presentationId, $batchUpdateRequest);
        printf("Refreshed a linked Sheets chart with ID: %s\n", $response->getPresentationId());
        return $response;
    } catch (Exception $e) {
        echo 'Message: ' . $e->getMessage();
    }
}

Python

slides/snippets/slides_refresh_sheets_chart.py
import google.auth
from googleapiclient.discovery import build
from googleapiclient.errors import HttpError


def refresh_sheets_chart(presentation_id, presentation_chart_id):
  """
  refresh_sheets_chart the user has access to.
  Load pre-authorized user credentials from the environment.
  TODO(developer) - See https://developers.google.com/identity
  for guides on implementing OAuth2 for the application.
  """
  creds, _ = google.auth.default()
  # pylint: disable=maybe-no-member
  try:
    slides_service = build("slides", "v1", credentials=creds)
    # Refresh an existing linked Sheets chart embedded in a presentation.
    requests = [{"refreshSheetsChart": {"objectId": presentation_chart_id}}]

    # Execute the request.
    body = {"requests": requests}
    response = (
        slides_service.presentations()
        .batchUpdate(presentationId=presentation_id, body=body)
        .execute()
    )
    print(f"Refreshed a linked Sheets chart with ID:{presentation_chart_id}")
    return response
  except HttpError as error:
    print(f"An error occurred: {error}")
    return error


if __name__ == "__main__":
  # Put the presentation_id, presentation_chart_id
  # to be submitted.
  refresh_sheets_chart(
      "10QnVUx1X2qHsL17WUidGpPh_SQhXYx40CgIxaKk8jU4", "1107320627"
  )

Ruby

slides/snippets/lib/file_snippets.rb
# Refresh an existing linked Sheets chart embedded in a presentation.
requests = [{
  refresh_sheets_chart: {
    object_id_prop: presentation_chart_id
  }
}]

# Execute the request.
req = Google::Apis::SlidesV1::BatchUpdatePresentationRequest.new(requests: requests)
response = slides_service.batch_update_presentation(presentation_id, req)

puts "Refreshed a linked Sheets chart with ID: #{presentation_chart_id}"