# About PageSpeed Insights
PageSpeed Insights (PSI) reports on the user experience of a page on both mobile and desktop
devices, and provides suggestions on how that page may be improved.
PSI provides both lab and field data about a page. Lab data is useful for debugging
issues, as it is collected in a controlled environment. However, it may not
capture real-world bottlenecks. Field data is useful for capturing true, real-world user
experience - but has a more limited set of metrics. See [How To Think
About Speed Tools](https://developers.google.com/web/fundamentals/performance/speed-tools) for more information on the two types of data.
## Real-user experience data
Real-user experience data in PSI is powered by the [Chrome User Experience
Report](https://developers.google.com/web/tools/chrome-user-experience-report) (CrUX) dataset. PSI reports real users' [First
Contentful Paint](https://web.dev/articles/fcp) (FCP), [Interaction to Next Paint](https://web.dev/articles/inp) (INP),
[Largest Contentful Paint](https://web.dev/articles/lcp) (LCP), and [Cumulative Layout
Shift](https://web.dev/articles/cls) (CLS) experiences over the previous 28-day collection period. PSI also reports
experiences for the experimental metric [Time to First Byte](https://web.dev/articles/ttfb) (TTFB).
In order to show user experience data for a given page, there must be sufficient data for it
to be included in the CrUX dataset. A page might not have sufficient data if it has been
recently published or has too few samples from real users. When this happens, PSI will fall
back to origin-level granularity, which encompasses all user experiences on all pages of the
website. Sometimes the origin may also have insufficient data, in which case PSI will be
unable to show any real-user experience data.
### Assessing quality of experiences
PSI classifies the quality of user experiences into three buckets: Good, Needs Improvement,
or Poor. PSI sets the following thresholds in alignment with the
[Web Vitals](https://web.dev/articles/vitals) initiative:
| | Good | Needs Improvement | Poor |
|---|---|---|---|
| FCP | \[0, 1800ms\] | (1800ms, 3000ms\] | over 3000ms |
| LCP | \[0, 2500ms\] | (2500ms, 4000ms\] | over 4000ms |
| CLS | \[0, 0.1\] | (0.1, 0.25\] | over 0.25 |
| INP | \[0, 200ms\] | (200ms, 500ms\] | over 500ms |
| TTFB (experimental) | \[0, 800ms\] | (800ms, 1800ms\] | over 1800ms |
### Distribution and selected metric values
PSI presents a distribution of these metrics so that developers can understand the range of
experiences for that page or origin. This distribution is split into three categories:
Good, Needs Improvement, and Poor, which are represented by green, amber, and red bars.
For example, seeing 11% within LCP's amber bar indicates that 11% of all observed LCP values
fall between 2500ms and 4000ms.
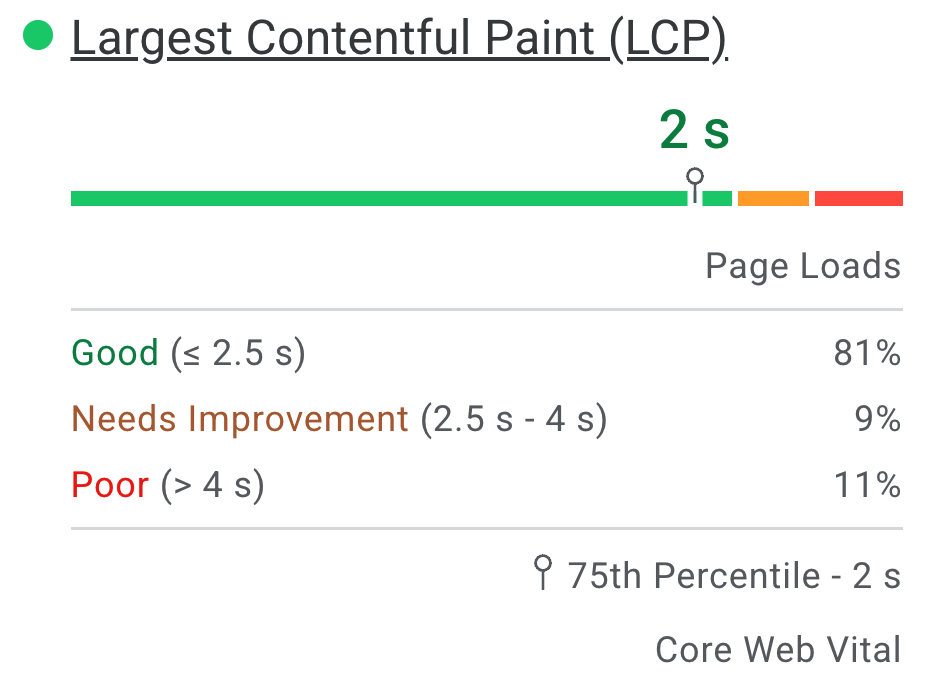
Above the distribution bars, PSI reports the 75th percentile for all metrics. The 75th
percentile is [selected](https://developers.google.com/speed/docs/insights/v5/about#why-is-the-75th-percentile-chosen-for-all-metrics) so that developers can understand the most
frustrating user experiences on their site. These field metric values are classified as
good/needs improvement/poor by applying the same thresholds shown above.
### Core Web Vitals
Core Web Vitals are a common set of performance signals critical to
all web experiences. The Core Web Vitals metrics are INP, LCP, and CLS, and they may be
aggregated at either the page or origin level. For aggregations with sufficient data in all
three metrics, the aggregation passes the Core Web Vitals assessment if the 75th percentiles
of all three metrics are Good. Otherwise, the aggregation does not pass the assessment. If the
aggregation has insufficient data for INP, then it will pass the assessment if both the 75th
percentiles of LCP and CLS are Good. If either LCP or CLS have insufficient data, the page or
origin-level aggregation cannot be assessed.
### Differences between Field Data in PSI and CrUX
The difference between the field data in PSI versus the
[CrUX dataset on BigQuery](https://developer.chrome.com/docs/crux/guides/bigquery) is that PSI's data is updated daily,
while the BigQuery dataset is updated monthly and limited to origin-level data.
Both data sources represent trailing 28-day periods.
## Lab diagnostics
PSI uses [Lighthouse](https://developer.chrome.com/docs/lighthouse/) to analyze the given URL in a simulated
environment for the Performance, Accessibility, Best Practices, and SEO categories.
### Score
At the top of the section are scores for each category, determined by running Lighthouse
to collect and analyze diagnostic information about the page. A score of 90 or above is
considered good. 50 to 89 is a score that needs improvement, and below 50 is considered poor.
### Metrics
The Performance category also has the page's performance on different metrics, including:
[First Contentful Paint](https://web.dev/articles/fcp),
[Largest Contentful Paint](https://web.dev/articles/lcp),
[Speed Index](https://developer.chrome.com/docs/lighthouse/performance/speed-index/),
[Cumulative Layout Shift](https://web.dev/articles/cls),
[Time to Interactive](https://developer.chrome.com/docs/lighthouse/performance/interactive/),
and [Total Blocking Time](https://web.dev/articles/tbt).
Each metric is [scored](https://developer.chrome.com/docs/lighthouse/performance/performance-scoring/) and labeled with a icon:
- Good is indicated with a green circle
- Needs Improvement is indicated with amber informational square
- Poor is indicated with a red warning triangle
### Audits
Within each category are audits that provide information on how to improve the page's user
experience. See the [Lighthouse documentation](https://developer.chrome.com/docs/lighthouse/) for a detailed
breakdown of each category's audits.
## Frequently asked questions (FAQs)
### What device and network conditions does Lighthouse use to simulate a page load?
Currently, Lighthouse simulates the page load conditions of a mid-tier device (Moto G4) device
on a [mobile network](https://github.com/GoogleChrome/lighthouse/blob/master/docs/throttling.md) for mobile, and an
emulated-desktop with a wired connection for desktop. PageSpeed also runs in a Google
datacenter that can vary based on network conditions, you can check the location that the test
was by looking at the Lighthouse Report's environment block:
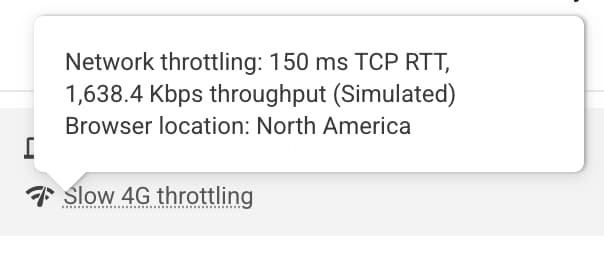
Note: PageSpeed will report running in one of: North America, Europe, or Asia.
### Why do the field data and lab data sometimes contradict each other?
The field data is a historical report about how a particular URL has performed, and represents
anonymized performance data from users in the real-world on a variety of devices and network
conditions. The lab data is based on a simulated load of a page on a single device and fixed
set of network conditions. As a result, the values may differ.
See [Why lab and field data can be different
(and what to do about it)](https://web.dev/articles/lab-and-field-data-differences) for more info.
### Why is the 75th percentile chosen for all metrics?
Our goal is to make sure that pages work well for the majority of users. By focusing on 75th
percentile values for our metrics, this ensures that pages provide a good user experience
under the most difficult device and network conditions.
See [Defining the Core Web Vitals metrics thresholds](https://web.dev/articles/defining-core-web-vitals-thresholds)
for more info.
### What is a good score for the lab data?
Any green score (90+) is considered good, but note that having good lab data does not
necessarily mean real-user experiences will also be good.
### Why does the performance score change from run to run? I didn't change anything on my page!
[Variability](https://developer.chrome.com/docs/lighthouse/performance/performance-scoring/#fluctuations) in performance measurement is introduced via a
number of channels with different levels of impact. Several common sources of metric
variability are local network availability, client hardware availability, and client resource
contention.
### Why is the real-user CrUX data not available for a URL or origin?
Chrome User Experience Report aggregates real-world speed data from
[opted-in users](https://developer.chrome.com/docs/crux/methodology) and
requires that a URL must be public
([crawlable and indexable](https://developer.chrome.com/docs/lighthouse/seo/is-crawlable/))
and have sufficient number of distinct samples that provide a representative, anonymized view
of performance of the URL or origin.
### More questions?
If you've got a question about using PageSpeed Insights that is specific and answerable,
ask your question in English on [Stack Overflow](https://stackoverflow.com/questions/tagged/pagespeed-insights).
If you have general feedback or questions about PageSpeed Insights, or you want to start a
general discussion, start a thread in the [mailing list](https://groups.google.com/forum/#!forum/pagespeed-insights-discuss).
If you have general questions about the Web Vitals metrics, start a thread in the [web-vitals-feedback](https://groups.google.com/g/web-vitals-feedback) discussion group.
## Feedback
Was this page helpful?
> [!TIP]
> Great! Thank you for the feedback. If you have a specific, answerable question about using PageSpeed Insights, ask the question in English on [Stack
> Overflow](https://stackoverflow.com/questions/tagged/pagespeed-insights). For general questions, feedback, and discussion, start a thread in the [mailing list](https://groups.google.com/forum/#!forum/pagespeed-insights-discuss).
> [!WARNING]
> Sorry to hear that. If you have a specific, answerable question about using PageSpeed Insights, ask the question in English on [Stack
> Overflow](https://stackoverflow.com/questions/tagged/pagespeed-insights). For general questions, feedback, and discussion, start a thread in the [mailing list](https://groups.google.com/forum/#!forum/pagespeed-insights-discuss).