Interfejs API PageSpeed Insights umożliwia:
- Pomiar skuteczności strony internetowej.
- Uzyskaj sugestie, jak poprawić działanie, przystępność i SEO strony.
Interfejs PageSpeed Insights API zwraca rzeczywiste dane z Raportu na temat użytkowania Chrome oraz dane laboratoryjne z Lighthouse.
API Explorer
Aby wywoływać interfejs PageSpeed Insights API bez pisania kodu, skorzystaj z narzędzia API Explorer.
Uzyskiwanie i używanie klucza interfejsu API
Uzyskaj kluczMożesz też utworzyć konto na stronie Dane logowania.
Gdy uzyskasz klucz interfejsu API, Twoja aplikacja będzie mogła dołączać parametry zapytania key=yourAPIKey do adresów URL wszystkich żądań.
Klucz interfejsu API można bezpiecznie umieszczać w adresach URL, więc nie trzeba go kodować.
curl
Aby wypróbować interfejs API PageSpeed Insights z poziomu wiersza poleceń:
- Otwórz terminal.
-
Uruchom podane niżej polecenie. Zastąp
yourAPIKeyswoim kluczem API.curl https://www.googleapis.com/pagespeedonline/v5/runPagespeed?url=https://web.dev/&key=yourAPIKey
Odpowiedź to obiekt JSON. Aby dowiedzieć się więcej o właściwościach obiektu odpowiedzi, zapoznaj się z artykułem Odpowiedź.
{
 "captchaResult": "CAPTCHA_NOT_NEEDED",
 "kind": "pagespeedonline#result",
 "id": "https://developers.google.com/",
 "loadingExperience": {
  "id": "https://developers.google.com/",
  "metrics": {
   "FIRST_CONTENTFUL_PAINT_MS": {
    "percentile": 3482,
    "distributions": [
     {
      "min": 0,
      "max": 1000,
      "proportion": 0.37151728768042963
     },
     {
      "min": 1000,
      "max": 2500,
      "proportion": 0.4244153519077991
     },
     {
      "min": 2500,
      "proportion": 0.2040673604117713
     }
    ],
    "category": "SLOW"
   },
   "FIRST_INPUT_DELAY_MS": {
    "percentile": 36,
    "distributions": [
     {
      "min": 0,
      "max": 50,
      "proportion": 0.960628961482204
     },
     {
      "min": 50,
      "max": 250,
      "proportion": 0.02888834714773281
     },
     {
      "min": 250,
      "proportion": 0.010482691370063388
     }
    ],
    "category": "FAST"
   }
  },
  "overall_category": "SLOW",
  "initial_url": "https://developers.google.com/"
 },
 "originLoadingExperience": {
  "id": "https://developers.google.com",
  "metrics": {
   "FIRST_CONTENTFUL_PAINT_MS": {
    "percentile": 2761,
    "distributions": [
     {
      "min": 0,
      "max": 1000,
      "proportion": 0.4236433226493666
     },
     {
      "min": 1000,
      "max": 2500,
      "proportion": 0.45045120795679117
     },
     {
      "min": 2500,
      "proportion": 0.1259054693938423
     }
    ],
    "category": "SLOW"
   },
   "FIRST_INPUT_DELAY_MS": {
    "percentile": 45,
    "distributions": [
     {
      "min": 0,
      "max": 50,
      "proportion": 0.9537371485251699
     },
     {
      "min": 50,
      "max": 250,
      "proportion": 0.03044972719889055
     },
     {
      "min": 250,
      "proportion": 0.01581312427593959
     }
    ],
    "category": "FAST"
   }
  },
  "overall_category": "SLOW",
  "initial_url": "https://developers.google.com/"
 },
 "lighthouseResult": {
  "requestedUrl": "https://developers.google.com/",
  "finalUrl": "https://developers.google.com/",
  "lighthouseVersion": "3.2.0",
  "userAgent": "Mozilla/5.0 (X11; Linux x86_64) AppleWebKit/537.36 (KHTML, like Gecko) HeadlessChrome/72.0.3584.0 Safari/537.36",
  "fetchTime": "2018-11-01T03:03:58.394Z",
  "environment": {
   "networkUserAgent": "Mozilla/5.0 (Macintosh; Intel Mac OS X 10_12_6) AppleWebKit/537.36 (KHTML, like Gecko) Chrome/71.0.3559.0 Safari/537.36",
   "hostUserAgent": "Mozilla/5.0 (X11; Linux x86_64) AppleWebKit/537.36 (KHTML, like Gecko) HeadlessChrome/72.0.3584.0 Safari/537.36",
   "benchmarkIndex": 590.0
  },
  "runWarnings": [],
  "configSettings": {
   "emulatedFormFactor": "desktop",
   "locale": "en-US",
   "onlyCategories": [
    "performance"
   ]
  },
  "audits": {
   "estimated-input-latency": {
    "id": "estimated-input-latency",
    "title": "Estimated Input Latency",
    "description": "The score above is an estimate of how long your app takes to respond to user input, in milliseconds, during the busiest 5s window of page load. If your latency is higher than 50 ms, users may perceive your app as laggy. [Learn more](https://developers.google.com/web/tools/lighthouse/audits/estimated-input-latency).",
    "score": 1.0,
    "scoreDisplayMode": "numeric",
    "displayValue": "30 ms"
   },
   "uses-rel-preconnect": {
    "id": "uses-rel-preconnect",
    "title": "Preconnect to required origins",
    "description": "Consider adding preconnect or dns-prefetch resource hints to establish early connections to important third-party origins. [Learn more](https://developers.google.com/web/fundamentals/performance/resource-prioritization#preconnect).",
    "score": 1.0,
    "scoreDisplayMode": "numeric",
    "details": {
     "headings": [],
     "type": "opportunity",
     "items": [],
     "overallSavingsMs": 0.0
    }
   },
   ...
  },
  "categories": {
   "performance": {
    "id": "performance",
    "title": "Performance",
    "score": 0.96,
    "auditRefs": [
     {
      "id": "first-contentful-paint",
      "weight": 3.0,
      "group": "metrics"
     },
     {
      "id": "first-meaningful-paint",
      "weight": 1.0,
      "group": "metrics"
     },
     ...
    ]
   }
  },
  "categoryGroups": {
   "a11y-element-names": {
    "title": "Elements Have Discernible Names",
    "description": "These are opportunities to improve the semantics of the controls in your application. This may enhance the experience for users of assistive technology, like a screen reader."
   },
   "a11y-language": {
    "title": "Page Specifies Valid Language",
    "description": "These are opportunities to improve the interpretation of your content by users in different locales."
   },
   ...
  },
  "i18n": {
   "rendererFormattedStrings": {
    "varianceDisclaimer": "Values are estimated and may vary.",
    "opportunityResourceColumnLabel": "Opportunity",
    "opportunitySavingsColumnLabel": "Estimated Savings",
    "errorMissingAuditInfo": "Report error: no audit information",
    "errorLabel": "Error!",
    "warningHeader": "Warnings: ",
    "auditGroupExpandTooltip": "Show audits",
    "passedAuditsGroupTitle": "Passed audits",
    "notApplicableAuditsGroupTitle": "Not applicable",
    "manualAuditsGroupTitle": "Additional items to manually check",
    "toplevelWarningsMessage": "There were issues affecting this run of Lighthouse:",
    "scorescaleLabel": "Score scale:",
    "crcLongestDurationLabel": "Maximum critical path latency:",
    "crcInitialNavigation": "Initial Navigation",
    "lsPerformanceCategoryDescription": "[Lighthouse](https://developers.google.com/web/tools/lighthouse/) analysis of the current page on an emulated mobile network. Values are estimated and may vary.",
    "labDataTitle": "Lab Data"
   }
  }
 },
 "analysisUTCTimestamp": "2018-11-01T03:03:58.394Z"
}
JavaScript
Aby wypróbować interfejs API PageSpeed Insights z poziomu kodu JavaScript:
-
Skopiuj kod poniżej. Kod używa interfejsu PageSpeed Insights API do pomiaru wydajności strony
https://web.dev/, a następnie wyświetla wyniki./** * Fetches and displays PageSpeed Insights data. */ async function run() { const apiEndpoint = 'https://www.googleapis.com/pagespeedonline/v5/runPagespeed'; const targetUrl = 'https://web.dev/'; const url = new URL(apiEndpoint); url.searchParams.set('url', targetUrl); try { const response = await fetch(url); if (!response.ok) { throw new Error(`HTTP error! status: ${response.status}`); } const json = await response.json(); // See // https://developers.google.com/speed/docs/insights/v5/reference/pagespeedapi/runpagespeed#response // to learn more about each of the properties in the response object. showInitialContent(json.id); const cruxMetrics = { 'First Contentful Paint': json.loadingExperience.metrics.FIRST_CONTENTFUL_PAINT_MS?.category, 'Interaction to Next Paint': json.loadingExperience.metrics.INTERACTION_TO_NEXT_PAINT?.category, }; showCruxContent(cruxMetrics); const lighthouse = json.lighthouseResult; const lighthouseMetrics = { 'First Contentful Paint': lighthouse.audits['first-contentful-paint']?.displayValue, 'Speed Index': lighthouse.audits['speed-index']?.displayValue, 'Largest Contentful Paint': lighthouse.audits['largest-contentful-paint']?.displayValue, 'Total Blocking Time': lighthouse.audits['total-blocking-time']?.displayValue, 'Time To Interactive': lighthouse.audits['interactive']?.displayValue, }; showLighthouseContent(lighthouseMetrics); } catch (error) { console.error('Fetching PageSpeed Insights failed:', error); document.body.textContent = `Failed to fetch PageSpeed data. Check the console for errors.`; } } /** * Displays initial content, including the page ID. * @param {string} id The ID of the page being tested. */ function showInitialContent(id) { document.body.innerHTML = ''; // Clear previous content const title = document.createElement('h1'); title.textContent = 'PageSpeed Insights API Demo'; document.body.appendChild(title); const page = document.createElement('p'); page.textContent = `Page tested: ${id}`; document.body.appendChild(page); } /** * Displays CrUX metrics. * @param {!Object} cruxMetrics The CrUX metrics to display. */ function showCruxContent(cruxMetrics) { const cruxHeader = document.createElement('h2'); cruxHeader.textContent = 'Chrome User Experience Report Results'; document.body.appendChild(cruxHeader); for (const key in cruxMetrics) { const p = document.createElement('p'); p.textContent = `${key}: ${cruxMetrics[key]}`; document.body.appendChild(p); } } /** * Displays Lighthouse metrics. * @param {!Object} lighthouseMetrics The Lighthouse metrics to display. */ function showLighthouseContent(lighthouseMetrics) { const lighthouseHeader = document.createElement('h2'); lighthouseHeader.textContent = 'Lighthouse Results'; document.body.appendChild(lighthouseHeader); for (const key in lighthouseMetrics) { const p = document.createElement('p'); p.textContent = `${key}: ${lighthouseMetrics[key]}`; document.body.appendChild(p); } } run();
- Wklej kod do tagu
scriptw pliku HTML. -
Otwórz plik HTML w przeglądarce. Gdy wszystko się powiedzie, Twoja strona będzie wyglądać tak jak na rysunku 1.
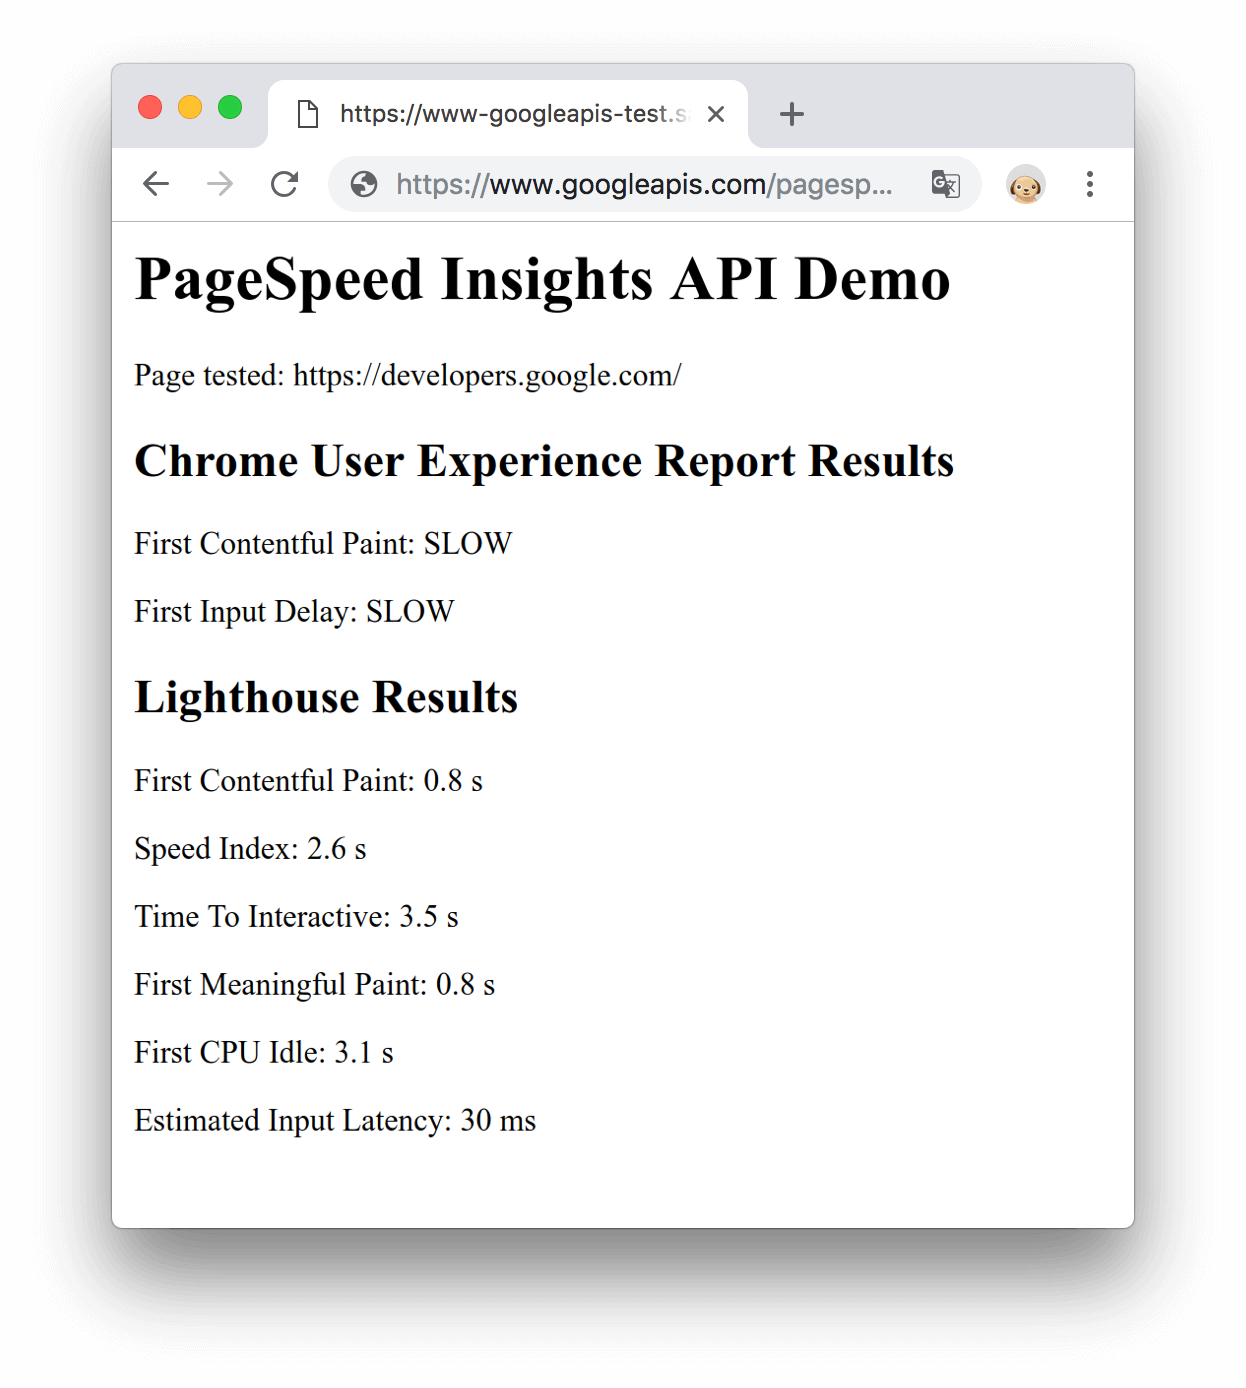
Rysunek 1. Demonstracja JavaScriptu
Dalsze kroki
- Aby dowiedzieć się więcej o właściwościach obiektu odpowiedzi, zapoznaj się z artykułem Odpowiedź.
- Więcej informacji o sposobie obliczania pomiarów wydajności znajdziesz w artykule Informacje o interfejsie PageSpeed Insights API.
Prześlij opinię
Czy ta strona była pomocna?