

ยินดีต้อนรับกลับมา ตอนนี้ผ่านไปแล้วประมาณ 12 สัปดาห์นับตั้งแต่การอัปเดตครั้งล่าสุดสำหรับ Chrome 68 เราข้าม Chrome 69 ไปเนื่องจากเราไม่มีฟีเจอร์หรือการเปลี่ยนแปลง UI ใหม่ๆ เพียงพอที่จะรับประกันการโพสต์
ฟีเจอร์ใหม่ๆ และการเปลี่ยนแปลงสำคัญที่จะเกิดขึ้นกับเครื่องมือสำหรับนักพัฒนาเว็บใน Chrome 70 ได้แก่
- การแสดงสดในคอนโซล
- ไฮไลต์โหนด DOM ระหว่างการประเมินอย่างตั้งใจ
- การเพิ่มประสิทธิภาพแผงประสิทธิภาพ
- การแก้ไขข้อบกพร่องที่เชื่อถือได้มากขึ้น
- เปิดใช้การควบคุมเครือข่ายจากเมนูคำสั่ง
- เติมเบรกพอยท์แบบมีเงื่อนไขอัตโนมัติ
- ช่วงพักโฆษณา
AudioContextเหตุการณ์ - แก้ไขข้อบกพร่องแอป Node.js ด้วย ndb
- เคล็ดลับพิเศษ: วัดการโต้ตอบของผู้ใช้ในชีวิตจริงด้วย User Timing API
อ่านต่อหรือดูวิดีโอเอกสารนี้ในเวอร์ชันวิดีโอ
การแสดงออกแบบสดในคอนโซล
ปักหมุด Live Express ไว้ที่ด้านบนของคอนโซลเมื่อคุณต้องการตรวจสอบค่าของนิพจน์แบบเรียลไทม์
คลิก Create Live Expression
 UI ของ Live Expression จะเปิดขึ้น
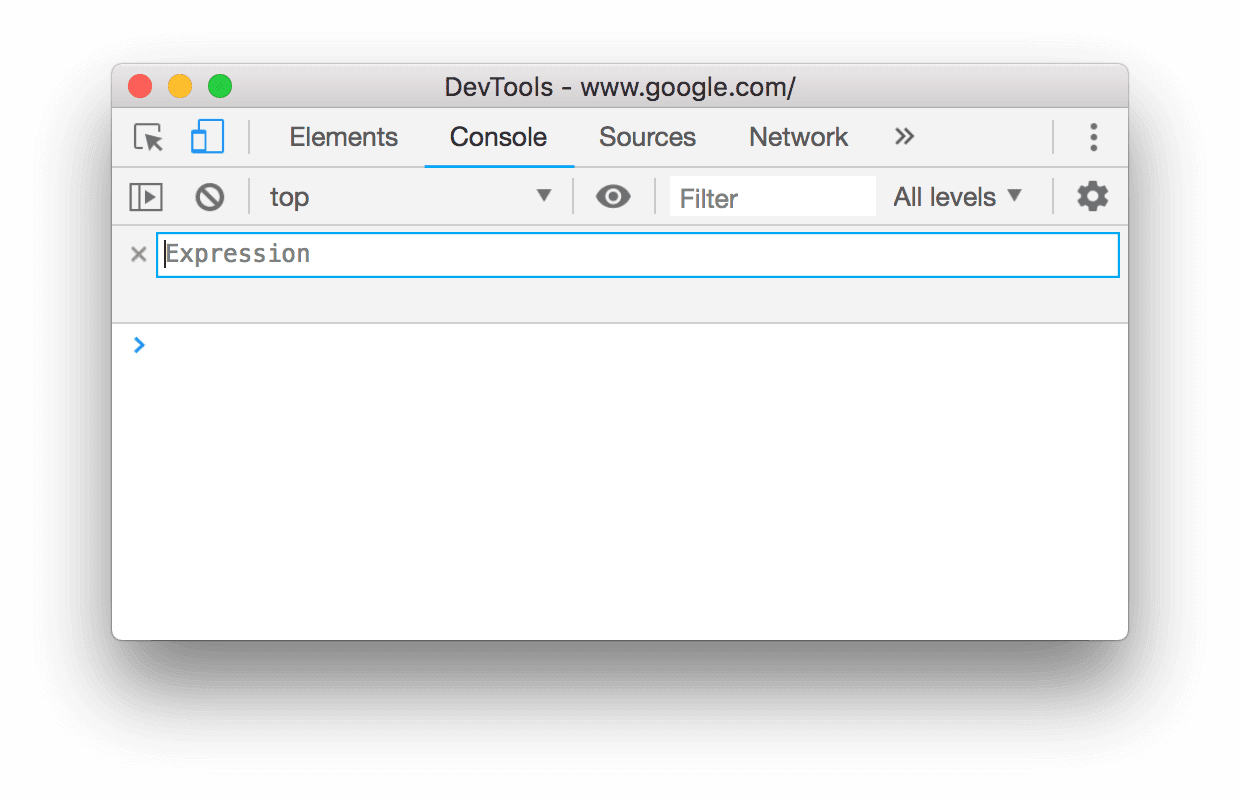
รูปที่ 1 UI การแสดงออกสด
พิมพ์นิพจน์ที่คุณต้องการตรวจสอบ
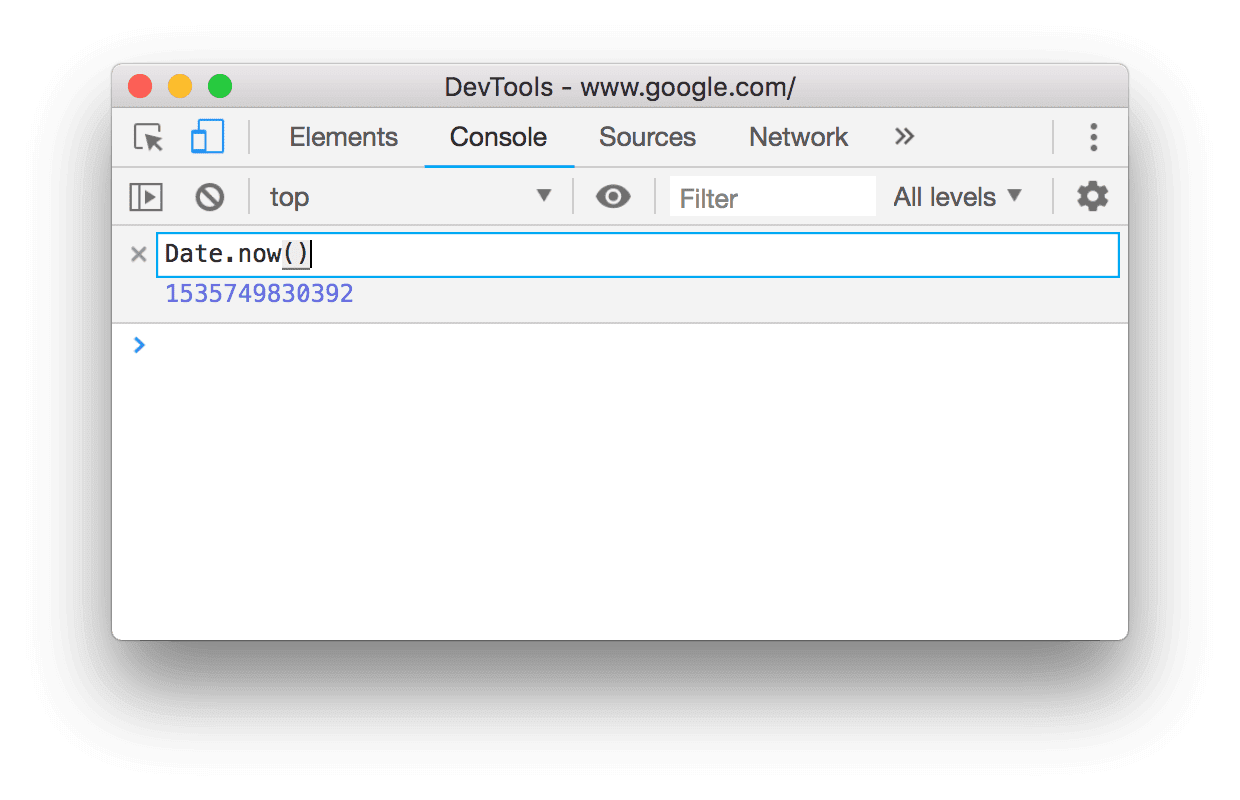
รูปที่ 2 การพิมพ์
Date.now()ลงใน UI การแสดงออกสดคลิกด้านนอก UI นิพจน์สดเพื่อบันทึกสีหน้า
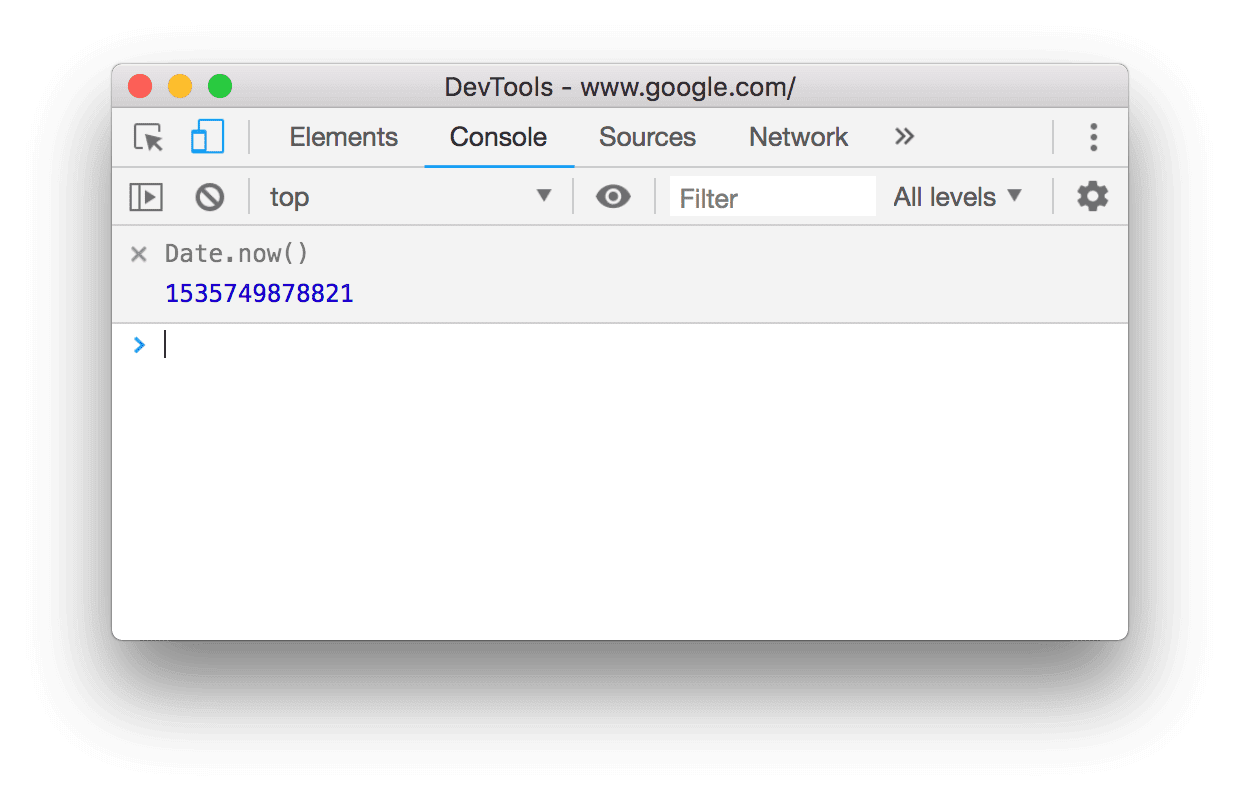
รูปที่ 3 Live Expression ที่บันทึกไว้
ค่า Live Expression จะอัปเดตทุก 250 มิลลิวินาที
ไฮไลต์โหนด DOM ระหว่างการประเมินอย่างตั้งใจ
พิมพ์นิพจน์ที่ประเมินไปยังโหนด DOM ในคอนโซล และตอนนี้การประเมินอย่างตั้งใจจะไฮไลต์โหนดนั้นในวิวพอร์ต
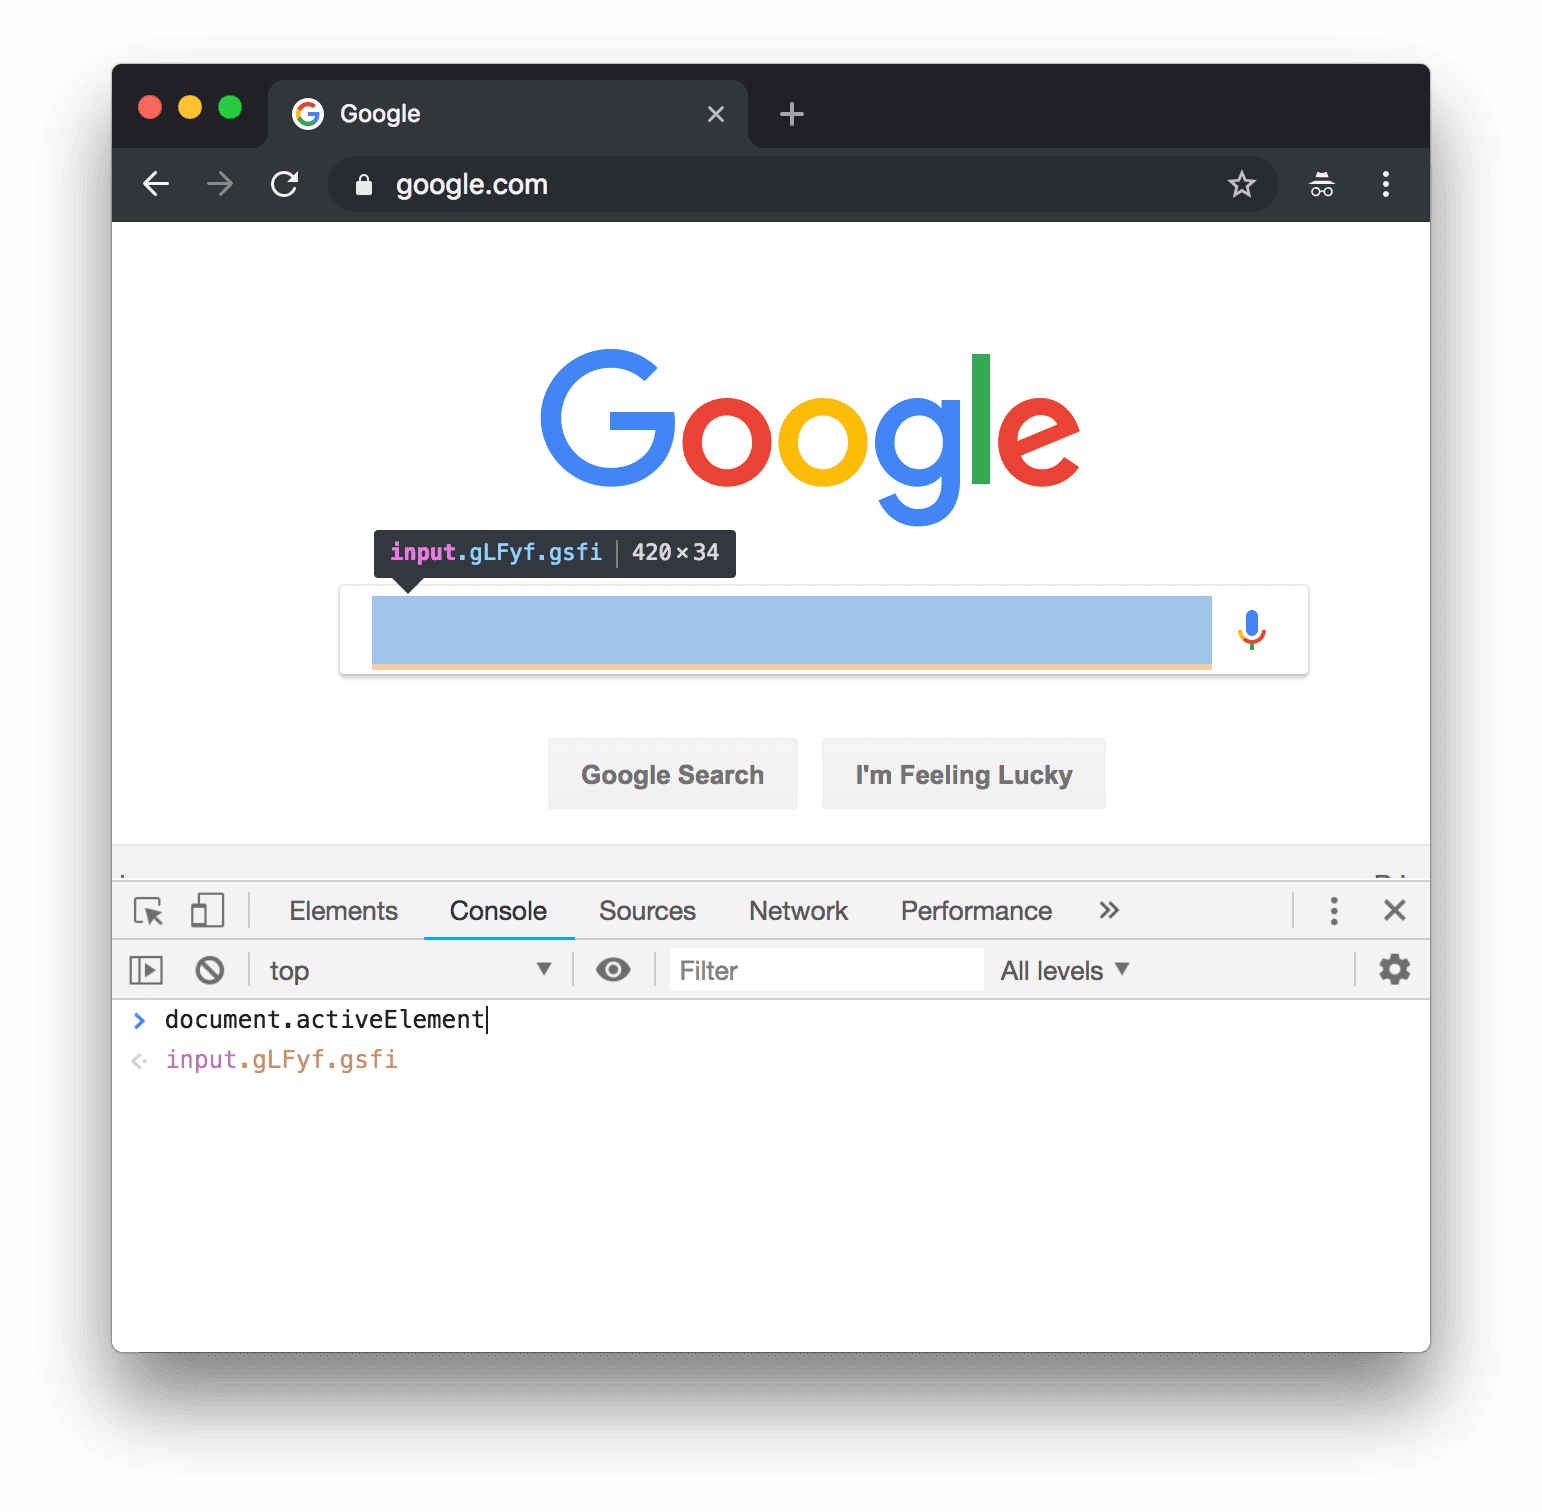
รูปที่ 4 เนื่องจากนิพจน์ปัจจุบันประเมินไปยังโหนด โหนดดังกล่าวจึงไฮไลต์อยู่ในวิวพอร์ต
ต่อไปนี้เป็นนิพจน์บางส่วนที่อาจเป็นประโยชน์สำหรับคุณ
document.activeElementเพื่อไฮไลต์โหนดที่โฟกัสอยู่document.querySelector(s)เพื่อไฮไลต์โหนดที่กำหนดเอง โดยมีsเป็นตัวเลือก CSS ซึ่งเทียบเท่ากับการวางเมาส์เหนือโหนดในแผนผัง DOM$0เพื่อไฮไลต์โหนดใดก็ตามที่เลือกไว้ใน DOM Tree$0.parentElementเพื่อไฮไลต์โหนดหลักของโหนดที่เลือกอยู่
การเพิ่มประสิทธิภาพแผงประสิทธิภาพ
เมื่อทำโปรไฟล์หน้าเว็บขนาดใหญ่ ก่อนหน้านี้แผงประสิทธิภาพจะใช้เวลาหลายสิบวินาทีในการประมวลผลและแสดงข้อมูลเป็นภาพ ในบางครั้ง การคลิกเหตุการณ์เพื่อดูข้อมูลเพิ่มเติมเกี่ยวกับเหตุการณ์ในแท็บสรุปก็ใช้เวลาโหลดหลายวินาที การประมวลผลและการแสดงภาพจะเร็วขึ้นใน Chrome 70
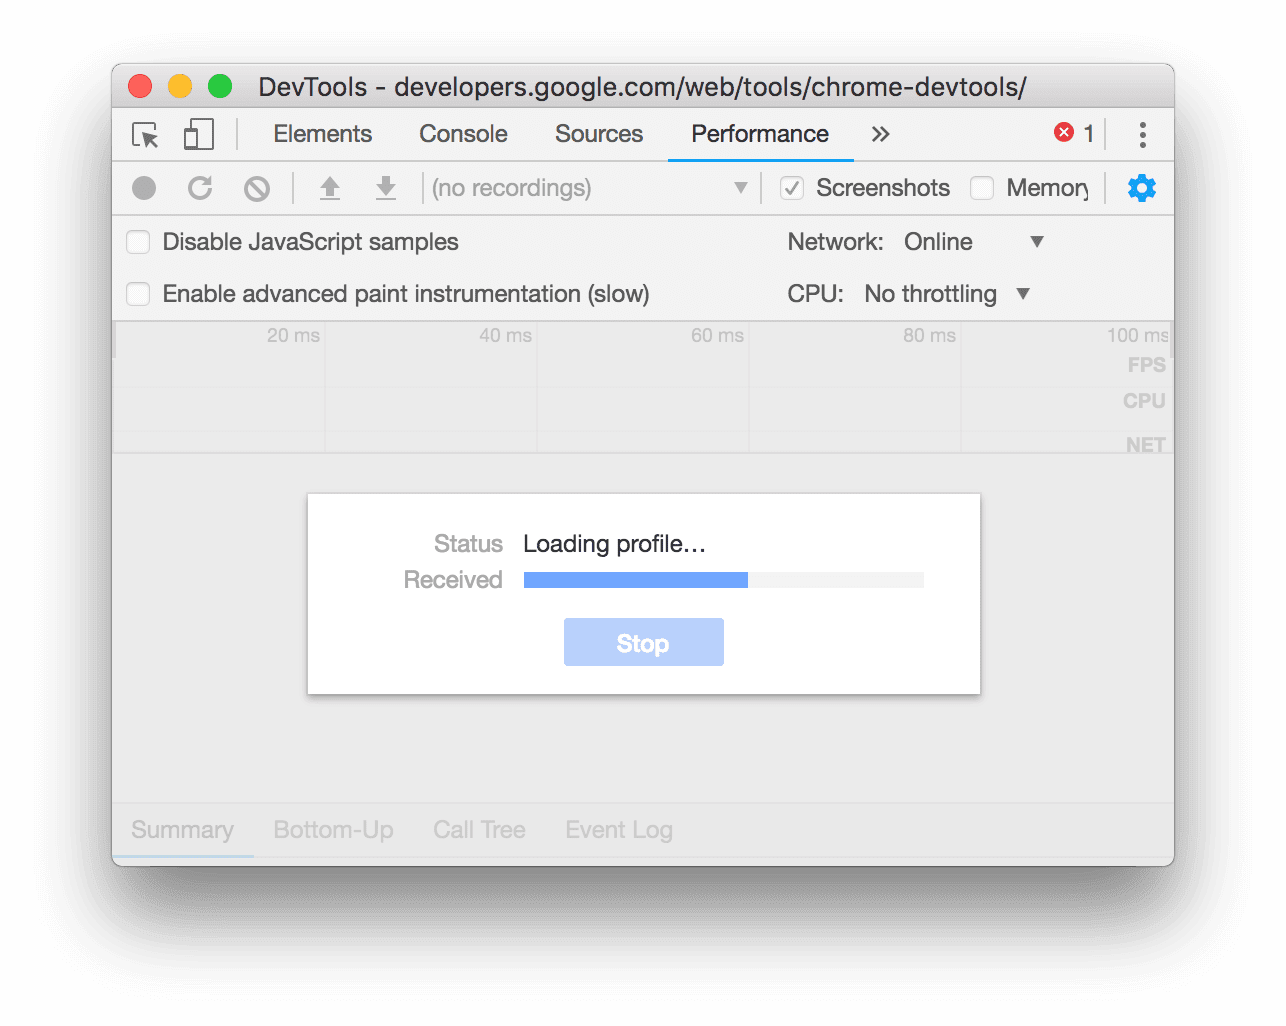
รูปที่ 5 การประมวลผลและการโหลดข้อมูลประสิทธิภาพ
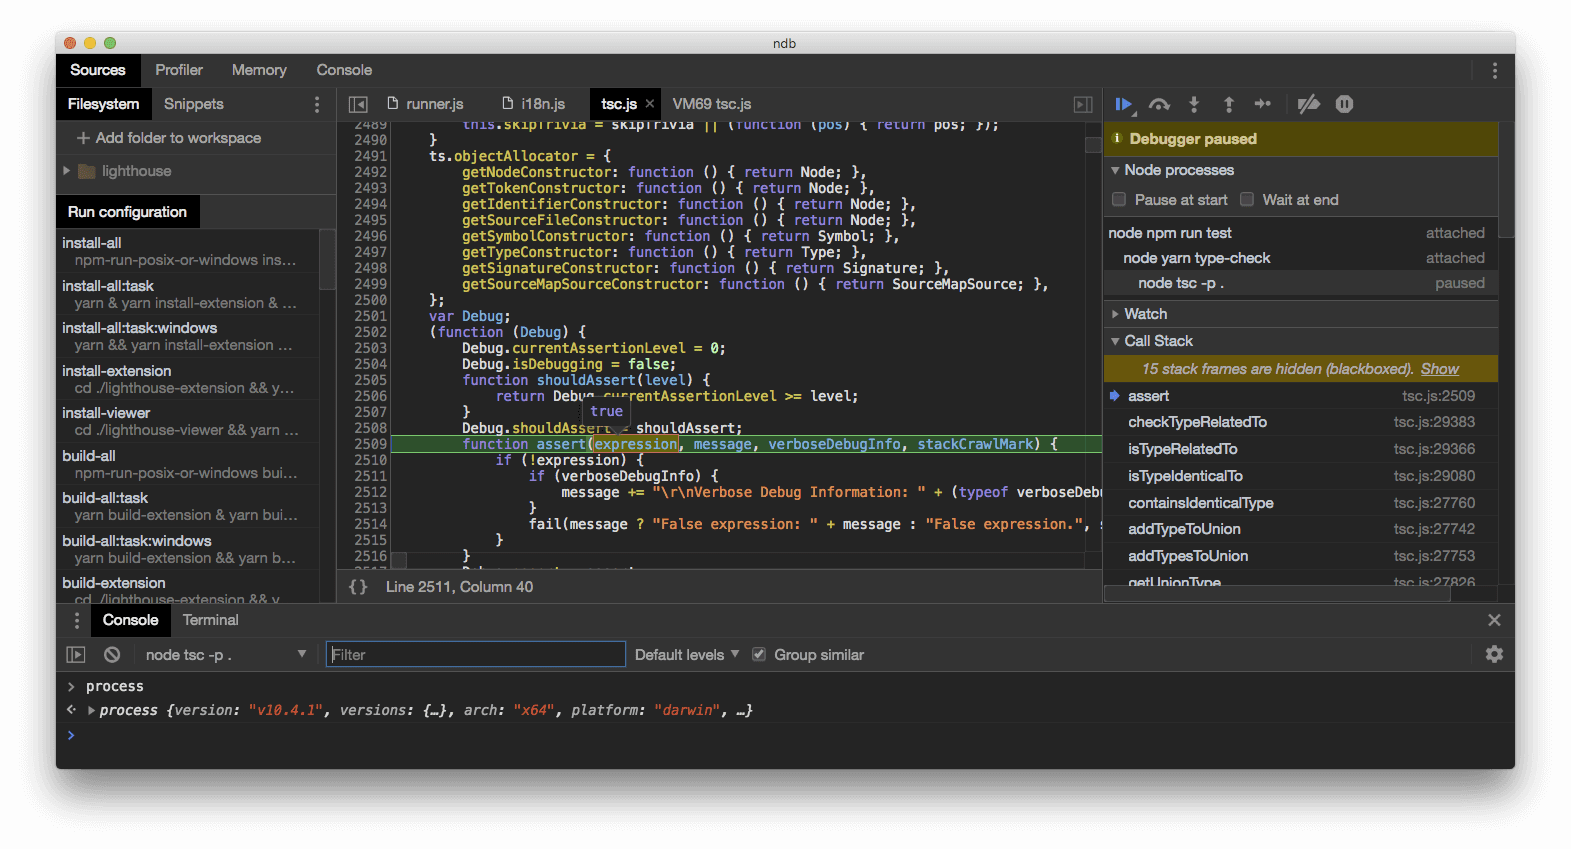
การแก้ไขข้อบกพร่องที่น่าเชื่อถือยิ่งขึ้น
Chrome 70 แก้ไขข้อบกพร่องบางอย่างที่ทําให้เบรกพอยท์หายไปหรือไม่ทำงาน
และยังแก้ไขข้อบกพร่องที่เกี่ยวข้องกับการแมปแหล่งที่มาด้วย ผู้ใช้ TypeScript บางรายจะสั่งให้ DevTools ละเว้นไฟล์ TypeScript บางไฟล์ขณะที่ทำตามขั้นตอนในโค้ด และ DevTools จะเพิกเฉยต่อไฟล์ JavaScript ทั้งชุด การแก้ไขเหล่านี้ยังแก้ปัญหาที่ทำให้แผงแหล่งที่มาทำงานได้ช้าอีกด้วย
เปิดใช้การควบคุมเครือข่ายจากเมนูคำสั่ง
ขณะนี้คุณสามารถตั้งค่าการควบคุมเครือข่ายเป็น 3G แบบเร็วหรือ 3G ที่ช้าได้แล้วจากเมนูคำสั่ง
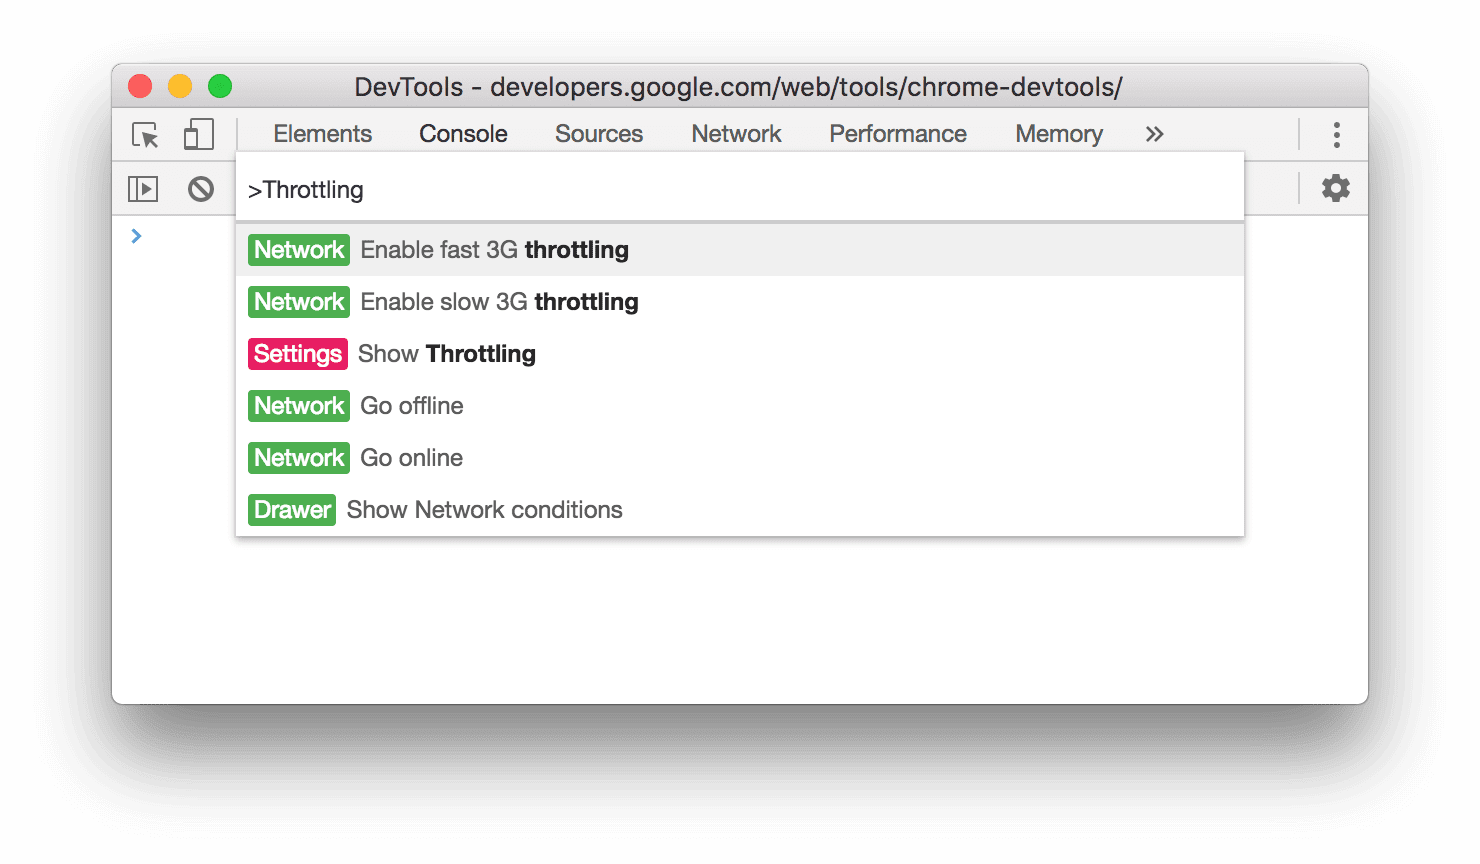
รูปที่ 6 คำสั่งควบคุมปริมาณเครือข่ายในเมนูคำสั่ง
เบรกพอยท์แบบมีเงื่อนไขที่เติมข้อความอัตโนมัติ
ใช้ UI การเติมข้อความอัตโนมัติเพื่อพิมพ์นิพจน์เบรกพอยท์แบบมีเงื่อนไขได้เร็วขึ้น
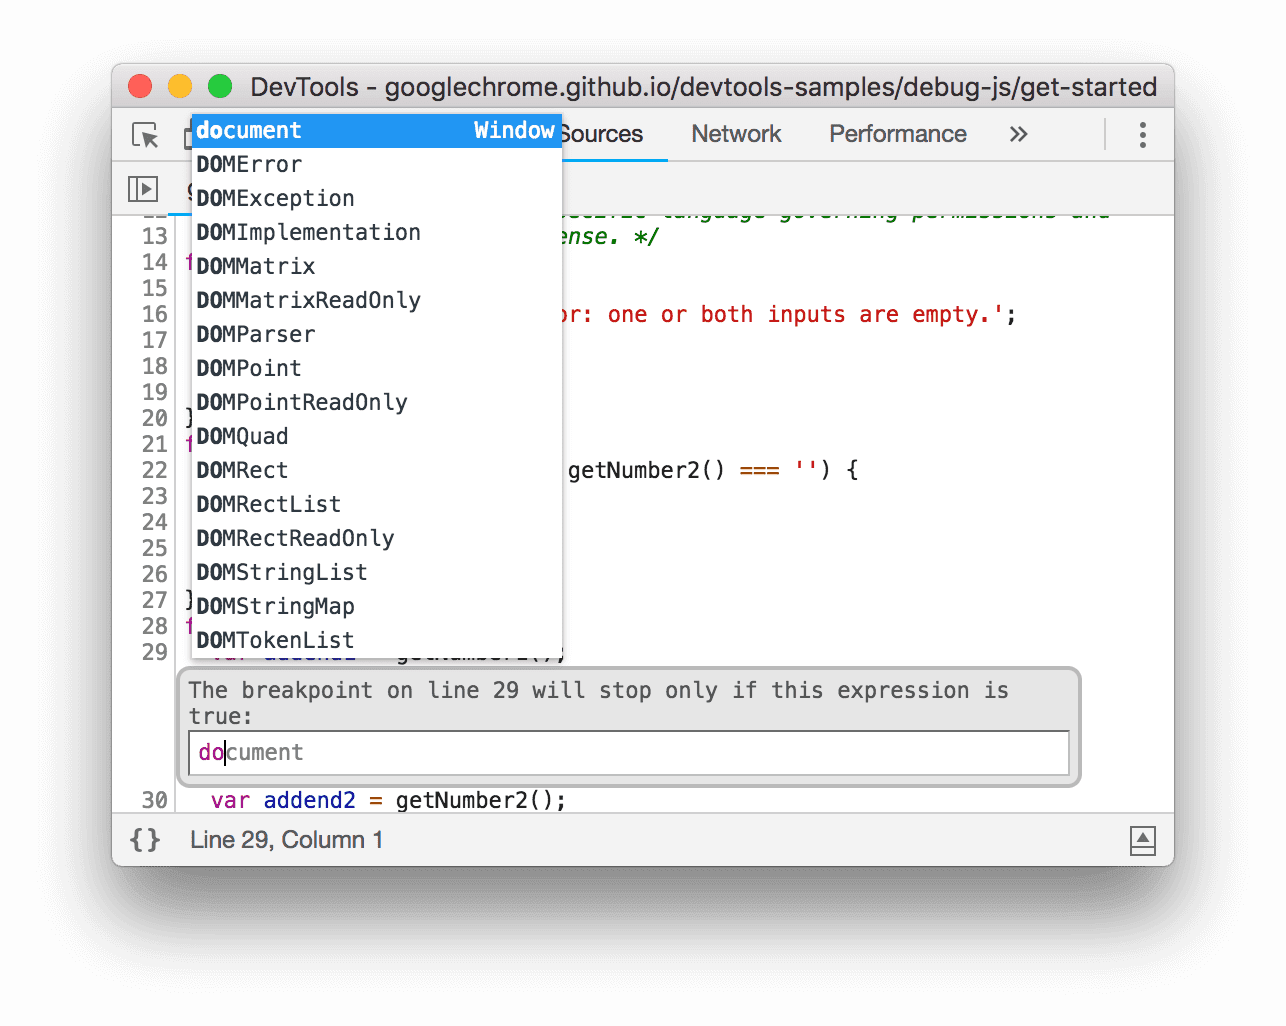
รูปที่ 7 UI การเติมข้อความอัตโนมัติ
ทราบหรือไม่ UI การเติมข้อความอัตโนมัติเป็นไปได้ด้วย CodeMirror ซึ่งเป็นส่วนที่ขับเคลื่อนคอนโซลด้วย
ช่วงพักของเหตุการณ์ AudioContext
ใช้แผงเบรกพอยท์ Listener เหตุการณ์เพื่อหยุดชั่วคราวที่บรรทัดแรกของเครื่องจัดการเหตุการณ์วงจร AudioContext
AudioContext เป็นส่วนหนึ่งของ Web Audio API ที่คุณสามารถใช้เพื่อประมวลผลและสังเคราะห์เสียง
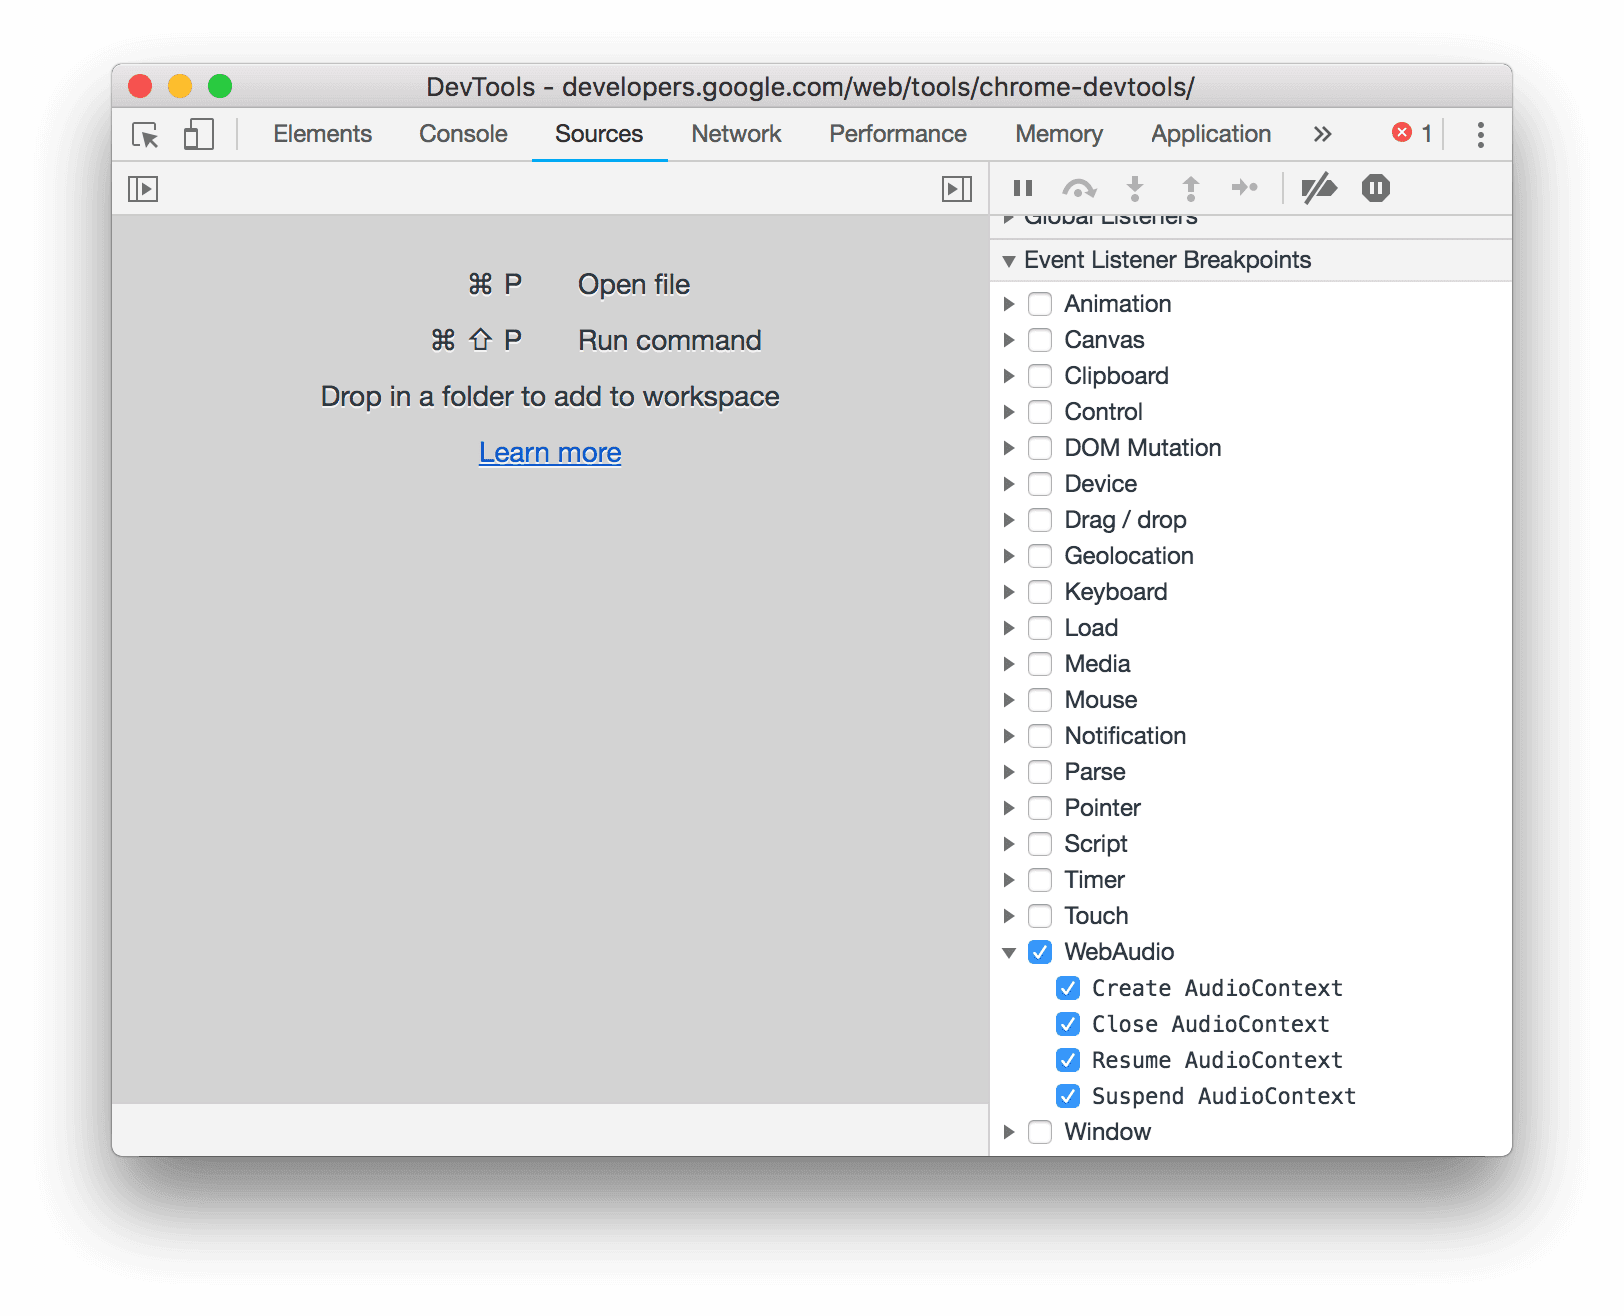
รูปที่ 8 เหตุการณ์ AudioContext ในแผงเบรกพอยท์ของ Listener เหตุการณ์
แก้ไขข้อบกพร่องแอป Node.js ด้วย ndb
ndb คือโปรแกรมแก้ไขข้อบกพร่องใหม่สำหรับแอปพลิเคชัน Node.js นอกเหนือจากฟีเจอร์การแก้ไขข้อบกพร่องปกติที่คุณได้รับผ่านเครื่องมือสำหรับนักพัฒนาเว็บแล้ว NB ยังนำเสนอสิ่งต่อไปนี้ด้วย
- การตรวจหาและต่อเชื่อมกับกระบวนการย่อย
- วางเบรกพอยท์ก่อนจำเป็นต้องมีโมดูล
- การแก้ไขไฟล์ภายใน UI เครื่องมือสำหรับนักพัฒนาเว็บ
- เพิกเฉยต่อสคริปต์ทั้งหมดที่อยู่นอกไดเรกทอรีการทำงานปัจจุบันโดยค่าเริ่มต้น
รูปที่ 9 UI ของ NB
ดูข้อมูลเพิ่มเติมได้ที่ README ของ ndb
เคล็ดลับพิเศษ: วัดการโต้ตอบของผู้ใช้ในชีวิตจริงด้วย User Timing API
หากต้องการวัดว่าผู้ใช้จริงใช้เวลาเท่าไรในเส้นทางที่สำคัญให้เสร็จสิ้นในหน้าเว็บ ลองติดตั้ง User Timing API ในโค้ด
ตัวอย่างเช่น สมมติว่าคุณต้องการวัดระยะเวลาที่ผู้ใช้ใช้ในหน้าแรกก่อนที่จะคลิกปุ่มคำกระตุ้นให้ดำเนินการ (CTA) ขั้นตอนแรก ให้ทำเครื่องหมายจุดเริ่มต้นของเส้นทางในเครื่องจัดการเหตุการณ์ที่เชื่อมโยงกับเหตุการณ์การโหลดหน้าเว็บ เช่น DOMContentLoaded ดังนี้
document.addEventListener('DOMContentLoaded', () => {
  window.performance.mark('start');
});
จากนั้นให้ทำเครื่องหมายจุดสิ้นสุดเส้นทางและคำนวณระยะเวลาเมื่อมีการคลิกปุ่ม ดังนี้
document.querySelector('#CTA').addEventListener('click', () => {
  window.performance.mark('end');
  window.performance.measure('CTA', 'start', 'end');
});
นอกจากนี้ คุณยังดึงข้อมูลการวัดผลเพื่อให้ส่งการวัดผลไปยังบริการข้อมูลวิเคราะห์เพื่อรวบรวมข้อมูลรวมแบบไม่ระบุตัวตนได้อย่างง่ายดายอีกด้วย
const CTA = window.performance.getEntriesByName('CTA')[0].duration;
เครื่องมือสำหรับนักพัฒนาเว็บจะทำเครื่องหมายการวัดระยะเวลาของผู้ใช้โดยอัตโนมัติในส่วนระยะเวลาของผู้ใช้ของการบันทึกประสิทธิภาพ
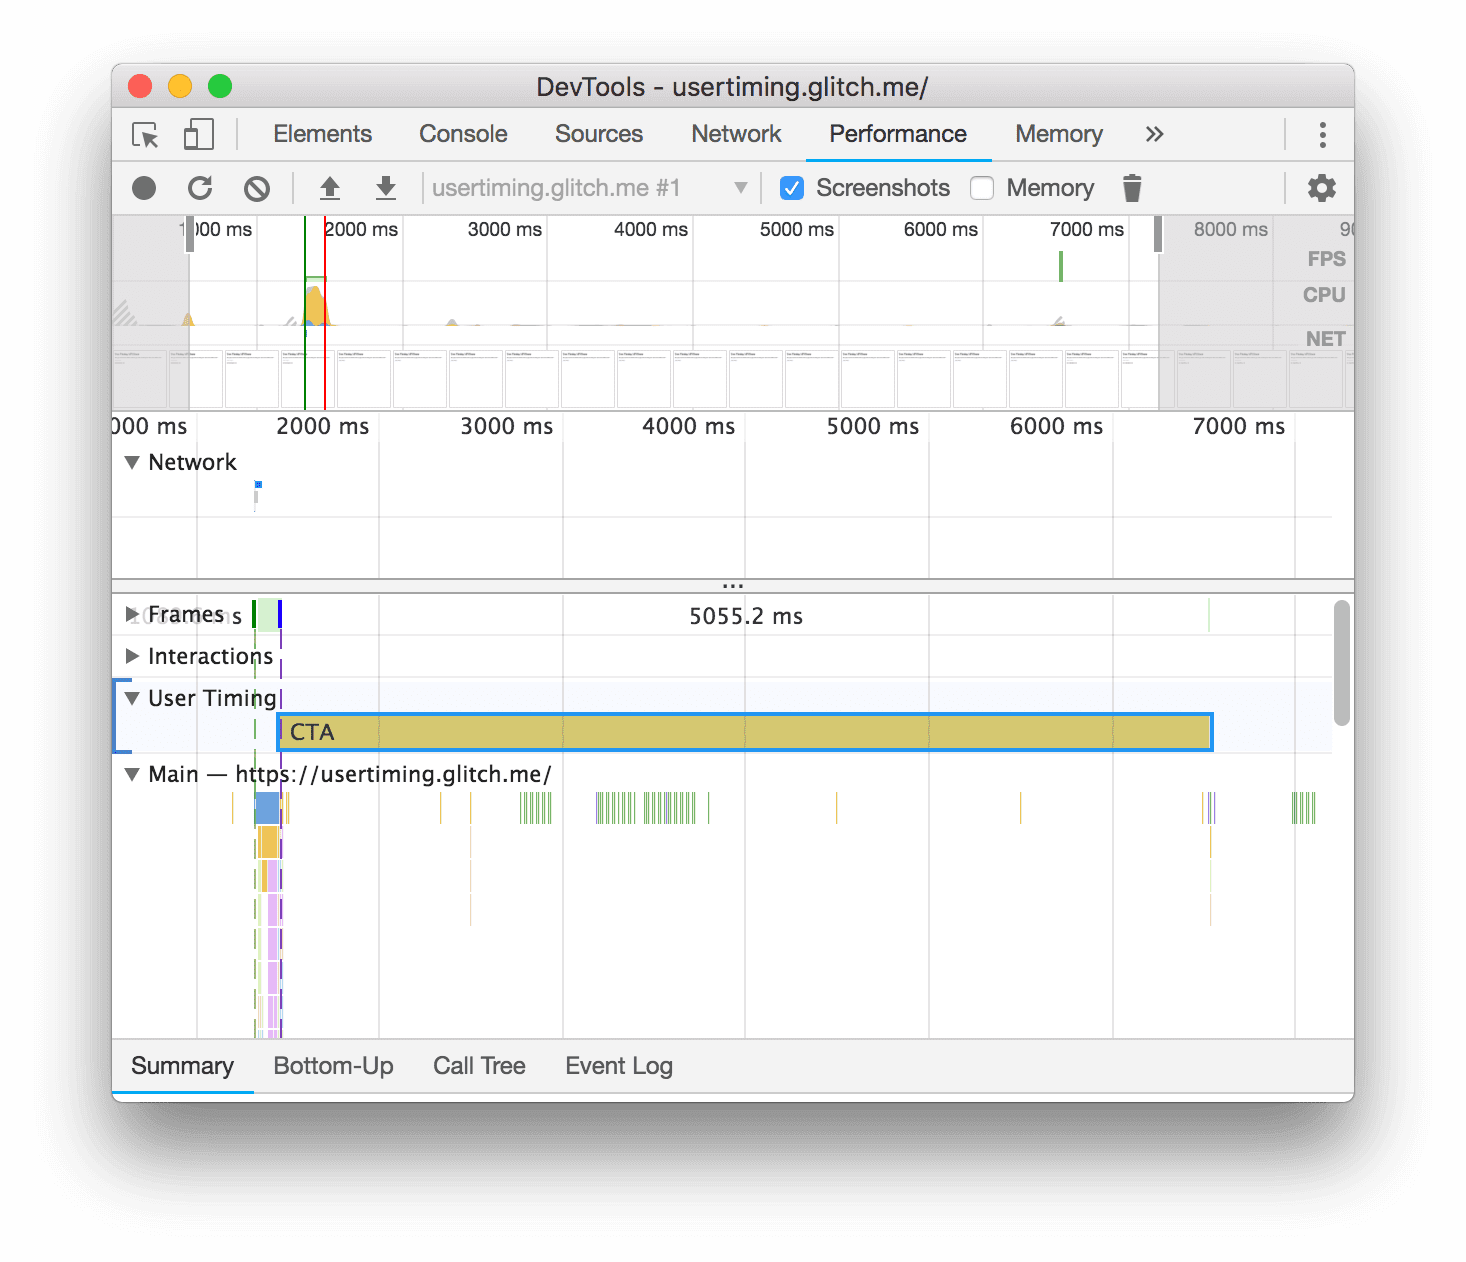
รูปที่ 10 ส่วนระยะเวลาของผู้ใช้
ซึ่งมีประโยชน์เมื่อแก้ไขข้อบกพร่องหรือเพิ่มประสิทธิภาพโค้ดด้วย ตัวอย่างเช่น หากต้องการเพิ่มประสิทธิภาพบางเฟสของวงจร ให้เรียกใช้ window.performance.mark() ที่จุดเริ่มต้นและจุดสิ้นสุดของฟังก์ชันวงจร โดย React จะดำเนินการดังกล่าวในโหมดการพัฒนา
ดาวน์โหลดช่องตัวอย่าง
ลองใช้ Chrome Canary, Dev หรือเบต้าเป็นเบราว์เซอร์สำหรับการพัฒนาเริ่มต้น ตัวอย่างช่องทางเหล่านี้จะช่วยให้คุณสามารถเข้าถึงฟีเจอร์ล่าสุดของเครื่องมือสำหรับนักพัฒนาเว็บ ทดสอบ API แพลตฟอร์มเว็บที่ล้ำสมัย และค้นหาปัญหาในเว็บไซต์ก่อนที่ผู้ใช้จะทำงานได้
ติดต่อทีมเครื่องมือสำหรับนักพัฒนาเว็บใน Chrome
ใช้ตัวเลือกต่อไปนี้เพื่อพูดคุยเกี่ยวกับฟีเจอร์ใหม่ๆ และการเปลี่ยนแปลงในโพสต์หรือเรื่องอื่นๆ ที่เกี่ยวข้องกับเครื่องมือสำหรับนักพัฒนาเว็บ
- ส่งคำแนะนำหรือความคิดเห็นถึงเราผ่าน crbug.com
- รายงานปัญหาเกี่ยวกับเครื่องมือสำหรับนักพัฒนาเว็บโดยใช้ตัวเลือกเพิ่มเติม
 > ความช่วยเหลือ > รายงานปัญหาเกี่ยวกับเครื่องมือสำหรับนักพัฒนาเว็บในเครื่องมือสำหรับนักพัฒนาเว็บ
 - ทวีตที่ @ChromeDevTools
- แสดงความคิดเห็นเกี่ยวกับ "มีอะไรใหม่ในวิดีโอ YouTube สำหรับเครื่องมือสำหรับนักพัฒนาเว็บ" หรือเคล็ดลับเครื่องมือสำหรับนักพัฒนาเว็บวิดีโอ YouTube
มีอะไรใหม่ในเครื่องมือสำหรับนักพัฒนาเว็บ
รายการของทุกอย่างที่อยู่ในชุดมีอะไรใหม่ในเครื่องมือสำหรับนักพัฒนาเว็บ
Chrome 123
- หาไข่อีสเตอร์
- การอัปเดตแผงองค์ประกอบ
- จำลองหน้าที่โฟกัสในองค์ประกอบ > รูปแบบ
- ตัวเลือกสี นาฬิกามุม และเครื่องมือแก้ไขการค่อยๆ เปลี่ยนใน
var()สำรอง - เลิกใช้งานเครื่องมือความยาวของ CSS แล้ว
- ป๊อปอัปสําหรับผลการค้นหาที่เลือกในประสิทธิภาพ > แทร็กหลัก
- การอัปเดตแผงเครือข่าย
- ล้างปุ่มและตัวกรองการค้นหาในแท็บเครือข่าย > EventStream
- เคล็ดลับเครื่องมือที่มีเหตุผลของการยกเว้นสําหรับคุกกี้ของบุคคลที่สามในเครือข่าย > คุกกี้
- เปิดและปิดใช้เบรกพอยท์ทั้งหมดในแหล่งที่มา
- ดูสคริปต์ที่โหลดในเครื่องมือสำหรับนักพัฒนาเว็บสำหรับ Node.js
- Lighthouse 11.5.0
- การปรับปรุงการช่วยเหลือพิเศษ
- ไฮไลต์เบ็ดเตล็ด
Chrome 122
- เราได้เผยแพร่คอลเล็กชันส่วนขยายโปรแกรมอัดเสียงอย่างเป็นทางการแล้ว
- การปรับปรุงเครือข่าย
- สาเหตุที่ดำเนินการไม่สำเร็จในคอลัมน์สถานะ
- เมนูย่อยข้อความที่ปรับปรุงแล้ว
- การปรับปรุงประสิทธิภาพ
- เบรดครัมบ์ในไทม์ไลน์
- ผู้เริ่มกิจกรรมในแทร็กหลัก
- เมนูตัวเลือกอินสแตนซ์ VM ของ JavaScript สำหรับ Node.js DevTools
- ทางลัดและคำสั่งใหม่ในแหล่งที่มา
- การปรับปรุงองค์ประกอบ
- ตอนนี้องค์ประกอบเทียม ::view-transition-transition แก้ไขได้ในสไตล์
- การรองรับพร็อพเพอร์ตี้แนวเนื้อหาสำหรับคอนเทนเนอร์ที่บล็อก
- การรองรับการตั้งท่าสำหรับอุปกรณ์แบบพับได้
- การกำหนดธีมแบบไดนามิก
- คำเตือนการยกเลิกการใช้งานคุกกี้ของบุคคลที่สามในแผงเครือข่ายและแอปพลิเคชัน
- Lighthouse 11.4.0
- การปรับปรุงการช่วยเหลือพิเศษ
- ไฮไลต์เบ็ดเตล็ด
Chrome 121
- การปรับปรุงองค์ประกอบ
- แถบตัวกรองที่มีประสิทธิภาพมากขึ้นในแผงเครือข่าย
- ทีมสนับสนุนของ
@font-palette-values - กรณีที่รองรับ: พร็อพเพอร์ตี้ที่กำหนดเองเป็นพร็อพเพอร์ตี้สำรองของพร็อพเพอร์ตี้ที่กำหนดเองอีกรายการหนึ่ง
- การรองรับการแมปแหล่งที่มาที่ดียิ่งขึ้น
- การปรับปรุงแผงประสิทธิภาพ
- แทร็กการโต้ตอบที่ปรับปรุงแล้ว
- การกรองขั้นสูงในแท็บล่างขึ้นบน โครงสร้างการเรียก และบันทึกเหตุการณ์
- ตัวทำเครื่องหมายการเยื้องในแผงแหล่งที่มา
- เคล็ดลับเครื่องมือที่มีประโยชน์สำหรับส่วนหัวและเนื้อหาที่ถูกลบล้างในแผงเครือข่าย
- ตัวเลือกเมนูคำสั่งใหม่สำหรับการเพิ่มและนำรูปแบบการบล็อกคำขอออก
- นำการทดสอบการละเมิด CSP ออกแล้ว
- Lighthouse 11.3.0
- การปรับปรุงการช่วยเหลือพิเศษ
- ไฮไลต์เบ็ดเตล็ด
Chrome 120
- การยกเลิกการใช้งานคุกกี้ของบุคคลที่สาม
- วิเคราะห์คุกกี้ของเว็บไซต์ด้วยเครื่องมือวิเคราะห์ Privacy Sandbox
- รายการละเว้นที่มีประสิทธิภาพมากขึ้น
- รูปแบบการยกเว้นเริ่มต้นสำหรับ Node_modules
- ตอนนี้ข้อยกเว้นที่ตรวจจับได้จะหยุดการดำเนินการหากตรวจพบหรือผ่านโค้ดที่ไม่ละเว้น
x_google_ignoreListเปลี่ยนชื่อเป็นignoreListในการแมปแหล่งที่มา- สลับโหมดป้อนข้อมูลใหม่ระหว่างการแก้ไขข้อบกพร่องจากระยะไกล
- ตอนนี้แผงองค์ประกอบแสดง URL สำหรับโหนด #document แล้ว
- นโยบายรักษาความปลอดภัยเนื้อหาที่มีประสิทธิภาพในแผงแอปพลิเคชัน
- การแก้ไขข้อบกพร่องของภาพเคลื่อนไหวที่ได้รับการปรับปรุง
- กล่องโต้ตอบ "คุณเชื่อถือโค้ดนี้ไหม" ในคำเตือน "แหล่งที่มา" และคำเตือน XSS ด้วยตนเองใน Console
- เบรกพอยท์ Listener เหตุการณ์ใน Web Worker และ Worklet
- ป้ายสื่อใหม่สำหรับ
<audio>และ<video> - การโหลดล่วงหน้าเปลี่ยนชื่อเป็นการโหลดแบบคาดเดา
- Lighthouse 11.2.0
- การปรับปรุงการช่วยเหลือพิเศษ
- ไฮไลต์เบ็ดเตล็ด
Chrome 119
- ปรับปรุงส่วน @property ในองค์ประกอบ > สไตล์
- กฎ @property ที่แก้ไขได้
- รายงานปัญหาเกี่ยวกับกฎ @property ที่ไม่ถูกต้อง
- รายการอุปกรณ์ที่จะจำลองที่อัปเดต
- รูปแบบ JSON แบบอินไลน์ในแท็กสคริปต์ในแหล่งที่มา
- เติมข้อมูลช่องส่วนตัวอัตโนมัติในคอนโซล
- Lighthouse 11.1.0
- การปรับปรุงการช่วยเหลือพิเศษ
- การเลิกใช้งาน SQL ในเว็บ
- การตรวจสอบสัดส่วนภาพภาพหน้าจอในแอปพลิเคชัน > ไฟล์ Manifest
- ไฮไลต์เบ็ดเตล็ด
Chrome 118
- ส่วนใหม่สำหรับพร็อพเพอร์ตี้ที่กำหนดเองในองค์ประกอบ > รูปแบบ
- การปรับปรุงการลบล้างในพื้นที่เพิ่มเติม
- การค้นหาที่ปรับปรุงแล้ว
- แผงแหล่งที่มาที่ปรับปรุงแล้ว
- พื้นที่ทำงานที่ได้รับการปรับปรุงในแผงแหล่งที่มา
- จัดเรียงแผงใหม่ในแหล่งที่มา
- การไฮไลต์ไวยากรณ์และการจัดรูปแบบสำหรับสคริปต์ประเภทอื่นๆ
- เลียนแบบฟีเจอร์สื่อที่มีความโปร่งใสลดลงมากกว่า
- Lighthouse 11
- การปรับปรุงการช่วยเหลือพิเศษ
- ไฮไลต์เบ็ดเตล็ด
Chrome 117
- การปรับปรุงแผงเครือข่าย
- ลบล้างเนื้อหาเว็บในเครื่องได้เร็วยิ่งขึ้น
- ลบล้างเนื้อหาของ XHR และคำขอดึงข้อมูล
- ซ่อนคำขอส่วนขยาย Chrome
- รหัสสถานะ HTTP ที่มนุษย์อ่านได้
ประสิทธิภาพ: ดูการเปลี่ยนแปลงลำดับความสำคัญในการดึงข้อมูลสำหรับเหตุการณ์ในเครือข่าย
เปิดใช้การตั้งค่าแหล่งที่มาโดยค่าเริ่มต้น: การพับโค้ดและการเปิดเผยไฟล์อัตโนมัติ
การปรับปรุงการแก้ไขข้อบกพร่องเกี่ยวกับปัญหาคุกกี้ของบุคคลที่สาม
(ทดลอง) การจำลองการแสดงผลแบบใหม่: Preferreds-reduced-transparency
Chrome 116
- ปรับปรุงการแก้ไขข้อบกพร่องของสไตล์ชีตที่ขาดหายไป
- การรองรับการกำหนดเวลาเชิงเส้นในองค์ประกอบ > รูปแบบ > เครื่องมือแก้ไขการค่อยๆ เปลี่ยน
- การรองรับที่เก็บข้อมูลของพื้นที่เก็บข้อมูลและมุมมองข้อมูลเมตา
- Lighthouse 10.3.0
- การช่วยเหลือพิเศษ: คำสั่งแป้นพิมพ์และการอ่านหน้าจอที่ได้รับการปรับปรุง
- ไฮไลต์เบ็ดเตล็ด
Chrome 115
- การปรับปรุงองค์ประกอบ
- ป้ายตารางกริดย่อยของ CSS ใหม่
- ความเฉพาะเจาะจงของตัวเลือกในเคล็ดลับเครื่องมือ
- ค่าของพร็อพเพอร์ตี้ CSS ที่กำหนดเองในเคล็ดลับเครื่องมือ
- การปรับปรุงแหล่งที่มา
- การไฮไลต์ไวยากรณ์ CSS
- ทางลัดเพื่อตั้งค่าเบรกพอยท์แบบมีเงื่อนไข
- แอปพลิเคชัน > การลดการติดตามการเข้าออก
- Lighthouse 10.2.0
- ละเว้นสคริปต์เนื้อหาโดยค่าเริ่มต้น
- เครือข่าย > การปรับปรุงการตอบสนอง
- ไฮไลต์เบ็ดเตล็ด
Chrome 114
- การสนับสนุนการแก้ไขข้อบกพร่องของ WebAssembly
- ลักษณะการก้าวที่ดีขึ้นในแอป Wasm
- แก้ไขข้อบกพร่องการป้อนข้อความอัตโนมัติโดยใช้แผงองค์ประกอบและแท็บปัญหา
- การยืนยันในโปรแกรมอัดเสียง
- Lighthouse 10.1.1
- การเพิ่มประสิทธิภาพ
- performance.mark() จะแสดงระยะเวลาเมื่อวางเมาส์เหนือในประสิทธิภาพ > ระยะเวลา
- profile() จะป้อนข้อมูลประสิทธิภาพ > หลัก
- คำเตือนในกรณีที่ผู้ใช้โต้ตอบช้า
- ข้อมูลอัปเดตเกี่ยวกับ Web Vitals
- การเลิกใช้งานเครื่องมือสร้างโปรไฟล์ JavaScript: ระยะที่ 3
- ไฮไลต์เบ็ดเตล็ด
Chrome 113
- ลบล้างส่วนหัวการตอบกลับของเครือข่าย
- การปรับปรุงการแก้ไขข้อบกพร่องของ Nuxt, Vite และ Rollup
- การปรับปรุง CSS ในองค์ประกอบ > รูปแบบ
- พร็อพเพอร์ตี้และค่า CSS ไม่ถูกต้อง
- ลิงก์ไปยังคีย์เฟรมในพร็อพเพอร์ตี้ชวเลขของภาพเคลื่อนไหว
- การตั้งค่าคอนโซลใหม่: เติมข้อความอัตโนมัติด้วย Enter
- เมนูคำสั่งเน้นไฟล์ที่เขียน
- การเลิกใช้งานเครื่องมือสร้างโปรไฟล์ JavaScript: ระยะที่ 2
- ไฮไลต์เบ็ดเตล็ด
Chrome 112
- การอัปเดตโปรแกรมอัดเสียง
- ส่วนขยายการเล่นซ้ำของโปรแกรมอัดเสียง
- บันทึกด้วยตัวเลือกเพียร์
- ส่งออกไฟล์บันทึกเสียงเป็นสคริปต์ Puppeteer ด้วยการวิเคราะห์ Lighthouse
- ดาวน์โหลดส่วนขยายสำหรับโปรแกรมอัดเสียง
- การอัปเดตองค์ประกอบ > สไตล์
- เอกสารประกอบ CSS ในแผงรูปแบบ
- การรองรับการซ้อน CSS
- การทำเครื่องหมายจุดตรวจสอบและเบรกพอยท์แบบมีเงื่อนไขใน Console
- เพิกเฉยต่อสคริปต์ที่ไม่เกี่ยวข้องระหว่างการแก้ไขข้อบกพร่อง
- เริ่มการเลิกใช้งานเครื่องมือสร้างโปรไฟล์ JavaScript
- เพิ่มคอนทราสต์ที่ลดลง
- Lighthouse 10
- ไฮไลต์เบ็ดเตล็ด
Chrome 111
- การแก้ไขข้อบกพร่องของสี HD ด้วยแผงรูปแบบ
- UX ของเบรกพอยท์ที่ปรับปรุงแล้ว
- แป้นพิมพ์ลัดของโปรแกรมอัดเสียงที่ปรับแต่งได้
- ไฮไลต์ไวยากรณ์ที่ดียิ่งขึ้นสำหรับ Angular
- จัดระเบียบแคชในแผงแอปพลิเคชัน
- ไฮไลต์เบ็ดเตล็ด
Chrome 110
- ล้างแผงประสิทธิภาพเมื่อโหลดซ้ำ
- การอัปเดตโปรแกรมอัดเสียง
- ดูและไฮไลต์โค้ดการไหลเวียนของผู้ใช้ในโปรแกรมอัดเสียง
- ปรับแต่งประเภทตัวเลือกสำหรับการบันทึก
- แก้ไขการไหลเวียนของผู้ใช้ขณะบันทึก
- รูปภาพที่สวยงามโดยอัตโนมัติ
- ไฮไลต์ไวยากรณ์ที่ดียิ่งขึ้นและการแสดงตัวอย่างในหน้าสำหรับ Vue, SCSS และอื่นๆ
- การเติมข้อความอัตโนมัติตามหลักการยศาสตร์และสอดคล้องกันในคอนโซล
- ไฮไลต์เบ็ดเตล็ด
Chrome 109
- โปรแกรมอัดเสียง: คัดลอกเป็นตัวเลือกสำหรับขั้นตอน การเล่นซ้ำในหน้าเว็บ เมนูตามบริบทของขั้นตอน
- แสดงชื่อฟังก์ชันจริงในการบันทึกประสิทธิภาพ
- แป้นพิมพ์ลัดใหม่ในแผงคอนโซลและแหล่งที่มา
- การแก้ไขข้อบกพร่อง JavaScript ที่ดียิ่งขึ้น
- ไฮไลต์เบ็ดเตล็ด
- [ทดลอง] UX ที่ได้รับการเพิ่มประสิทธิภาพในการจัดการเบรกพอยท์
- [ทดลอง] สิ่งพิมพ์อัตโนมัติ
Chrome 108
- คำแนะนำสำหรับพร็อพเพอร์ตี้ CSS ที่ไม่มีการใช้งาน
- ตรวจหา XPath และตัวเลือกข้อความโดยอัตโนมัติในแผงโปรแกรมอัดเสียง
- ขั้นตอนผ่านนิพจน์ที่คั่นด้วยคอมมา
- ปรับปรุงการตั้งค่ารายการละเว้น
- ไฮไลต์เบ็ดเตล็ด
Chrome 107
- ปรับแต่งแป้นพิมพ์ลัดในเครื่องมือสำหรับนักพัฒนาเว็บ
- สลับธีมสว่างและมืดด้วยแป้นพิมพ์ลัด
- ไฮไลต์ออบเจ็กต์ C/C++ ในเครื่องมือตรวจสอบหน่วยความจำ
- รองรับข้อมูลผู้เริ่มทั้งหมดสำหรับการนำเข้า HAR
- เริ่มการค้นหา DOM หลังจากกด
Enter - แสดงไอคอน
startและendสำหรับพร็อพเพอร์ตี้ Flexbox ของalign-content - ไฮไลต์เบ็ดเตล็ด
Chrome 106
- จัดกลุ่มไฟล์ตาม "เขียนแล้ว"/ทำให้ใช้งานได้ในแผงแหล่งที่มา
- สแต็กเทรซที่ลิงก์สำหรับการดำเนินการแบบไม่พร้อมกัน
- ละเว้นสคริปต์ของบุคคลที่สามที่รู้จักโดยอัตโนมัติ
- สแต็กการเรียกใช้ที่ดียิ่งขึ้นระหว่างการแก้ไขข้อบกพร่อง
- การซ่อนแหล่งที่มาที่อยู่ในรายการละเว้นในแผงแหล่งที่มา
- การซ่อนไฟล์ที่ไม่ได้อยู่ในรายการละเว้นในเมนูคำสั่ง
- การติดตามการโต้ตอบใหม่ในแผงประสิทธิภาพ
- รายละเอียดระยะเวลา LCP ในแผงข้อมูลเชิงลึกเกี่ยวกับประสิทธิภาพ
- สร้างชื่อเริ่มต้นสำหรับไฟล์บันทึกเสียงในแผงโปรแกรมอัดเสียงโดยอัตโนมัติ
- ไฮไลต์เบ็ดเตล็ด
Chrome 105
- การเล่นซ้ำแบบทีละขั้นตอนในโปรแกรมอัดเสียง
- รองรับเหตุการณ์เมาส์โอเวอร์ในแผงโปรแกรมอัดเสียง
- Largest Contentful Paint (LCP) ในแผงข้อมูลเชิงลึกเกี่ยวกับประสิทธิภาพ
- ระบุความกะพริบของข้อความ (FOIT, FOUT) เป็นสาเหตุหลักที่เป็นไปได้ของการเปลี่ยนเลย์เอาต์
- ตัวแฮนเดิลโปรโตคอลในแผงไฟล์ Manifest
- ป้ายเลเยอร์บนสุดในแผงองค์ประกอบ
- แนบข้อมูลการแก้ไขข้อบกพร่อง Wasm ขณะรันไทม์
- รองรับการแก้ไขแบบเรียลไทม์ระหว่างการแก้ไขข้อบกพร่อง
- ดูและแก้ไข @scope ที่กฎในแผงรูปแบบ
- การปรับปรุงการแมปแหล่งที่มา
- ไฮไลต์เบ็ดเตล็ด
Chrome 104
- รีสตาร์ทเฟรมระหว่างการแก้ไขข้อบกพร่อง
- ตัวเลือกการเล่นซ้ำช้าในแผงโปรแกรมอัดเสียง
- สร้างส่วนขยายสำหรับแผงโปรแกรมอัดเสียง
- จัดกลุ่มไฟล์ตาม "เขียนแล้ว"/ทำให้ใช้งานได้ในแผงแหล่งที่มา
- การติดตามการจับเวลาผู้ใช้ใหม่ในแผงข้อมูลเชิงลึกเกี่ยวกับประสิทธิภาพ
- แสดงช่องที่กำหนดขององค์ประกอบ
- จำลองการเกิดขึ้นพร้อมกันของฮาร์ดแวร์สำหรับการบันทึกประสิทธิภาพ
- ดูตัวอย่างค่าที่ไม่ใช่สีเมื่อเติมตัวแปร CSS อัตโนมัติ
- ระบุเฟรมการบล็อกในแผง Back-Forward Cache
- คำแนะนำที่เติมข้อความอัตโนมัติซึ่งปรับปรุงสำหรับออบเจ็กต์ JavaScript
- การปรับปรุงแผนที่แหล่งที่มา
- ไฮไลต์เบ็ดเตล็ด
Chrome 103
- บันทึกเหตุการณ์การดับเบิลคลิกและคลิกขวาในแผงโปรแกรมอัดเสียง
- ช่วงเวลาและโหมดสแนปชอตใหม่ในแผง Lighthouse
- การควบคุมการซูมที่ได้รับการปรับปรุงในแผงข้อมูลเชิงลึกเกี่ยวกับประสิทธิภาพ
- ยืนยันเพื่อลบการบันทึกประสิทธิภาพ
- จัดเรียงแผงใหม่ในแผงองค์ประกอบ
- การเลือกสีนอกเบราว์เซอร์
- ปรับปรุงการแสดงตัวอย่างค่าในบรรทัดระหว่างแก้ไขข้อบกพร่อง
- สนับสนุน Blob ขนาดใหญ่สำหรับ Authenticator เสมือน
- แป้นพิมพ์ลัดใหม่ในแผงแหล่งที่มา
- การปรับปรุงแผนที่แหล่งที่มา
Chrome 102
- ฟีเจอร์พรีวิว: แผงข้อมูลเชิงลึกเกี่ยวกับประสิทธิภาพแบบใหม่
- แป้นพิมพ์ลัดใหม่เพื่อจำลองธีมสว่างและธีมมืด
- การรักษาความปลอดภัยที่ดีขึ้นในแท็บตัวอย่างเครือข่าย
- ปรับปรุงการโหลดซ้ำที่เบรกพอยท์
- การอัปเดตคอนโซล
- ยกเลิกการบันทึกโฟลว์ผู้ใช้เมื่อเริ่มต้น
- การแสดงผลองค์ประกอบเทียมไฮไลต์ที่รับช่วงมาในแผงรูปแบบ
- ไฮไลต์เบ็ดเตล็ด
- [ทดลอง] คัดลอกการเปลี่ยนแปลง CSS
- [ทดลอง] การเลือกสีนอกเบราว์เซอร์
Chrome 101
- นำเข้าและส่งออกโฟลว์ผู้ใช้ที่บันทึกไว้เป็นไฟล์ JSON
- ดูเลเยอร์การเรียงซ้อนในแผงรูปแบบ
- การรองรับฟังก์ชันสีของ
hwb() - ปรับปรุงการแสดงพร็อพเพอร์ตี้ส่วนตัว
- ไฮไลต์เบ็ดเตล็ด
- [ทดลอง] ช่วงเวลาและโหมดสแนปชอตใหม่ในแผง Lighthouse
Chrome 100
- ดูและแก้ไข @support ที่กฎในแผงรูปแบบ
- รองรับตัวเลือกทั่วไปโดยค่าเริ่มต้น
- ปรับแต่งตัวเลือกการบันทึก
- เปลี่ยนชื่อไฟล์บันทึกเสียง
- ดูตัวอย่างพร็อพเพอร์ตี้คลาส/ฟังก์ชันเมื่อวางเมาส์เหนือ
- เฟรมที่นำเสนอบางส่วนในแผงประสิทธิภาพ
- ไฮไลต์เบ็ดเตล็ด
Chrome 99
- การควบคุมคำขอ WebSocket
- แผง Reporting API ใหม่ในแผงแอปพลิเคชัน
- รองรับรอจนกว่าองค์ประกอบจะปรากฏ/คลิกได้ในแผงโปรแกรมอัดเสียง
- การจัดรูปแบบ การจัดรูปแบบ และการกรองคอนโซลที่ดียิ่งขึ้น
- แก้ไขข้อบกพร่องของส่วนขยาย Chrome ด้วยไฟล์การแมปแหล่งที่มา
- โครงสร้างโฟลเดอร์แหล่งที่มาที่ได้รับการปรับปรุงในแผงแหล่งที่มา
- แสดงไฟล์ต้นฉบับของผู้ปฏิบัติงานในแผงแหล่งที่มา
- การอัปเดตธีมมืดอัตโนมัติของ Chrome
- เครื่องมือเลือกสีและแผงแยกที่ง่ายต่อการสัมผัส
- ไฮไลต์เบ็ดเตล็ด
Chrome 98
- ฟีเจอร์เวอร์ชันตัวอย่าง: แผนผังการช่วยเหลือพิเศษแบบเต็มหน้า
- การเปลี่ยนแปลงที่แม่นยำยิ่งขึ้นในแท็บการเปลี่ยนแปลง
- กำหนดระยะหมดเวลาให้นานขึ้นสำหรับการบันทึกโฟลว์ของผู้ใช้
- ตรวจสอบว่าหน้าเว็บสามารถแคชได้ด้วยแท็บ Back-Forward Cache
- ตัวกรองแผงคุณสมบัติใหม่
- จำลองฟีเจอร์สื่อสีที่บังคับของ CSS
- แสดงไม้บรรทัดในคำสั่งวางเหนือ
- รองรับ
row-reverseและcolumn-reverseในเครื่องมือแก้ไข Flexbox - แป้นพิมพ์ลัดใหม่เพื่อเล่น XHR ซ้ำและขยายผลการค้นหาทั้งหมด
- Lighthouse 9 ในแผง Lighthouse
- แผงแหล่งที่มาที่ปรับปรุงแล้ว
- ไฮไลต์เบ็ดเตล็ด
- [ทดลอง] ปลายทางในแผง Reporting API
Chrome 97
- ฟีเจอร์พรีวิว: แผงโปรแกรมอัดเสียงใหม่
- รีเฟรชรายการอุปกรณ์ในโหมดอุปกรณ์
- เติมข้อความอัตโนมัติด้วยการแก้ไขเป็น HTML
- ประสบการณ์การแก้ไขข้อบกพร่องที่ดีขึ้นของโค้ด
- การซิงค์การตั้งค่าเครื่องมือสำหรับนักพัฒนาเว็บในอุปกรณ์ต่างๆ
Chrome 96
- ฟีเจอร์พรีวิว: แผงภาพรวม CSS ใหม่
- ประสบการณ์การแก้ไขและคัดลอกความยาวของ CSS ได้รับการกู้คืนและปรับปรุง
- จำลองฟีเจอร์สื่อ Preferred-Clicit ของ CSS
- จำลองฟีเจอร์ธีมมืดอัตโนมัติของ Chrome
- คัดลอกการประกาศเป็น JavaScript ในแผงรูปแบบ
- แท็บเพย์โหลดใหม่ในแผงเครือข่าย
- ปรับปรุงการแสดงพร็อพเพอร์ตี้ในแผง "คุณสมบัติ"
- ตัวเลือกในการซ่อนข้อผิดพลาด CORS ในคอนโซล
- การแสดงตัวอย่างและการประเมินออบเจ็กต์
Intlอย่างเหมาะสมในคอนโซล - สแต็กเทรซที่ไม่พร้อมกันที่สอดคล้องกัน
- คงแถบด้านข้างของคอนโซล
- แผงแคชของแอปพลิเคชันที่เลิกใช้งานแล้วในแผงแอปพลิเคชัน
- [ทดลอง] แผง Reporting API ใหม่ในแผงแอปพลิเคชัน
Chrome 95
- เครื่องมือสร้างความยาว CSS ใหม่
- ซ่อนปัญหาในแท็บปัญหา
- ปรับปรุงการแสดงพร็อพเพอร์ตี้
- Lighthouse 8.4 ในแผง Lighthouse
- จัดเรียงตัวอย่างข้อมูลในแผงแหล่งที่มา
- ลิงก์ใหม่ไปยังบันทึกประจำรุ่นที่ได้รับการแปลและรายงานข้อบกพร่องเกี่ยวกับการแปล
- ปรับปรุง UI สำหรับเมนูคำสั่งสำหรับนักพัฒนาเว็บ
Chrome 94
- ใช้เครื่องมือสำหรับนักพัฒนาเว็บในภาษาที่ต้องการ
- อุปกรณ์ Nest Hub ใหม่ในรายการอุปกรณ์
- ช่วงทดลองใช้จากต้นทางในมุมมองรายละเอียดเฟรม
- ป้ายคำค้นหาคอนเทนเนอร์ CSS ใหม่
- ช่องทำเครื่องหมายใหม่เพื่อกลับตัวกรองเครือข่าย
- การเลิกใช้งานแถบด้านข้างของ Console ที่กำลังจะเกิดขึ้น
- แสดงส่วนหัว
Set-Cookiesดิบในแท็บ "ปัญหา" และแผงเครือข่าย - ตัวเข้าถึงโฆษณาแบบดิสเพลย์แบบเนทีฟที่สอดคล้องกันเป็นพร็อพเพอร์ตี้ของตัวเองในคอนโซล
- สแต็กเทรซข้อผิดพลาดที่เหมาะสมสําหรับสคริปต์ในบรรทัดที่มี #sourceURL
- เปลี่ยนรูปแบบสีในแผงที่คำนวณ
- แทนที่เคล็ดลับเครื่องมือที่กำหนดเองด้วยเคล็ดลับเครื่องมือ HTML แบบดั้งเดิม
- [ทดลอง] ซ่อนปัญหาในแท็บปัญหา
Chrome 93
- คำค้นหาคอนเทนเนอร์ CSS ที่แก้ไขได้ในแผงรูปแบบ
- ตัวอย่าง Web Bundle ในแผงเครือข่าย
- การแก้ไขข้อบกพร่อง Attribution Reporting API
- มีการจัดการสตริงที่ดีขึ้นในคอนโซล
- การแก้ไขข้อบกพร่อง CORS ที่ได้รับการปรับปรุง
- Lighthouse 8.1
- URL ของโน้ตใหม่ในแผงไฟล์ Manifest
- ตัวเลือกการจับคู่ CSS แบบคงที่
- การตอบสนองด้วย JSON ที่พิมพ์ออกมาดูดีในแผงเครือข่าย
Chrome 92
- ตัวแก้ไขตารางกริด CSS
- การรองรับการประกาศซ้ำ
constรายการในคอนโซล - ผู้ดูลำดับแหล่งที่มา
- แป้นพิมพ์ลัดใหม่เพื่อดูรายละเอียดเฟรม
- การรองรับการแก้ไขข้อบกพร่องของ CORS ที่มีประสิทธิภาพมากขึ้น
- เปลี่ยนชื่อป้ายกำกับ XHR เป็น Fetch/XHR
- กรองประเภททรัพยากร Wasm ในแผงเครือข่าย
- คำแนะนำไคลเอ็นต์ User Agent สำหรับอุปกรณ์ในแท็บเงื่อนไขของเครือข่าย
- รายงานปัญหาเกี่ยวกับโหมดที่ไม่มาตรฐานในแท็บปัญหา
- รวมจุดตัดของ Compute ในแผงประสิทธิภาพ
- Lighthouse 7.5 ในแผง Lighthouse
- เมนูตามบริบท "เริ่มเฟรมใหม่" ที่เลิกใช้งานแล้วในการเรียกใช้สแต็ก
- [ทดลอง] การตรวจสอบโปรโตคอล
- [ทดลอง] เครื่องบันทึกหุ่นกระบอก
Chrome 91
- ป๊อปอัปข้อมูล Web Vitals
- เครื่องมือตรวจสอบหน่วยความจำใหม่
- แสดงภาพการเลื่อนของ CSS
- แผงการตั้งค่าป้ายใหม่
- ตัวอย่างรูปภาพที่ปรับปรุงแล้วด้วยข้อมูลสัดส่วนภาพ
- ปุ่มเงื่อนไขของเครือข่ายใหม่พร้อมตัวเลือกในการกำหนดค่า
Content-Encoding - ทางลัดเพื่อดูค่าที่คำนวณแล้ว
- คีย์เวิร์ด
accent-colorรายการ - จัดหมวดหมู่ปัญหาด้วยสีและไอคอน
- ลบโทเค็นความน่าเชื่อถือ
- ฟีเจอร์ที่ถูกบล็อกในมุมมองรายละเอียดเฟรม
- กรองการทดสอบในการตั้งค่าการทดสอบ
- คอลัมน์
Vary Headerใหม่ในแผงพื้นที่เก็บข้อมูลแคช - รองรับการตรวจสอบแบรนด์ส่วนตัวของ JavaScript
- การสนับสนุนที่ดียิ่งขึ้นสำหรับการแก้ไขข้อบกพร่องของเบรกพอยท์
- รองรับการแสดงตัวอย่างการวางเมาส์เหนือเครื่องหมาย
[] - ปรับปรุงเค้าโครงของไฟล์ HTML
- สแต็กเทรซข้อผิดพลาดที่เหมาะสมสำหรับการแก้ไขข้อบกพร่อง Wasm
Chrome 90
- เครื่องมือแก้ไขข้อบกพร่อง Flexbox ของ CSS ใหม่
- การวางซ้อนใหม่ของ Core Web Vitals
- ย้ายจำนวนปัญหาไปยังแถบสถานะของคอนโซลแล้ว
- รายงานปัญหาเกี่ยวกับกิจกรรมบนเว็บและเว็บที่เชื่อถือได้
- จัดรูปแบบสตริงเป็นลิเทอรัลสตริง JavaScript (ถูกต้อง) ในคอนโซล
- แผง Trust Token ใหม่ในแผงแอปพลิเคชัน
- จำลองฟีเจอร์สื่อขอบเขตของสี CSS
- เครื่องมือ Progressive Web App ที่ปรับปรุงใหม่
- คอลัมน์
Remote Address Spaceใหม่ในแผงเครือข่าย - การปรับปรุงประสิทธิภาพ
- แสดงฟีเจอร์ที่อนุญาต/ไม่อนุญาตในมุมมองรายละเอียดของเฟรม
- คอลัมน์
SamePartyใหม่ในแผงคุกกี้ - เลิกใช้งานการรองรับ
fn.displayNameแบบไม่เป็นมาตรฐาน - การเลิกใช้งาน
Don't show Chrome Data Saver warningในเมนูการตั้งค่า - [ทดลอง] การรายงานปัญหาคอนทราสต์ต่ำโดยอัตโนมัติในแท็บ "ปัญหา"
- [ทดลอง] มุมมองแบบต้นไม้การช่วยเหลือพิเศษเต็มรูปแบบในแผงองค์ประกอบ
Chrome 89
- การสนับสนุนการแก้ไขข้อบกพร่องสำหรับการละเมิด Trusted Types
- จับภาพหน้าจอของโหนดนอกวิวพอร์ต
- แท็บโทเค็นความน่าเชื่อถือใหม่สำหรับคำขอเครือข่าย
- Lighthouse 7 ในแผง Lighthouse
- รองรับการบังคับใช้สถานะ
:targetของ CSS - แป้นพิมพ์ลัดใหม่สำหรับการทำซ้ำองค์ประกอบ
- ตัวเลือกสีสำหรับคุณสมบัติ CSS ที่กำหนดเอง
- แป้นพิมพ์ลัดใหม่เพื่อคัดลอกพร็อพเพอร์ตี้ CSS
- ตัวเลือกใหม่ในการแสดงคุกกี้ที่ถอดรหัส URL
- ล้างเฉพาะคุกกี้ที่มองเห็น
- ตัวเลือกใหม่ในการล้างคุกกี้ของบุคคลที่สามในแผงพื้นที่เก็บข้อมูล
- แก้ไขคําแนะนําของไคลเอ็นต์ User Agent สําหรับอุปกรณ์ที่กําหนดเอง
- คงการตั้งค่า "บันทึกเครือข่าย" ไว้
- ดูการเชื่อมต่อ WebTransport ในแผงเครือข่าย
- "ออนไลน์" เปลี่ยนชื่อเป็น "ไม่มีการควบคุม"
- ตัวเลือกการคัดลอกใหม่ในแผงคอนโซล แผงแหล่งที่มา และแผงรูปแบบ
- ข้อมูล Service Worker ใหม่ในมุมมองรายละเอียดเฟรม
- วัดข้อมูลหน่วยความจำในมุมมองรายละเอียดเฟรม
- แสดงความคิดเห็นจากแท็บปัญหา
- วางเฟรมในแผงประสิทธิภาพ
- จำลองโหมดแบบพับได้และ Dual Screen ในโหมดอุปกรณ์
- [ทดลอง] ทดสอบเบราว์เซอร์โดยอัตโนมัติด้วย Puppeteer Recorder
- [ทดลอง] เครื่องมือแก้ไขแบบอักษรในแผงรูปแบบ
- [ทดลอง] เครื่องมือแก้ไขข้อบกพร่องของ CSS Flexbox
- [ทดลอง] แท็บการละเมิด CSP ใหม่
- [ทดลอง] การคำนวณคอนทราสต์ของสีแบบใหม่ - อัลกอริทึมคอนทราสต์ขั้นสูง (APCA)
Chrome 88
- เริ่มต้นเครื่องมือสำหรับนักพัฒนาเว็บได้เร็วขึ้น
- เครื่องมือแสดงภาพมุมของ CSS ใหม่
- จำลองประเภทรูปภาพที่ไม่รองรับ
- จำลองขนาดโควต้าพื้นที่เก็บข้อมูลในแผงพื้นที่เก็บข้อมูล
- ช่องทาง Web Vitals ใหม่ในแผงประสิทธิภาพ
- รายงานข้อผิดพลาด CORS ในแผงเครือข่าย
- ข้อมูลการแยกแบบข้ามต้นทางในมุมมองรายละเอียดเฟรม
- ข้อมูล Web Worker ใหม่ในมุมมองรายละเอียดเฟรม
- แสดงรายละเอียดเฟรมของเครื่องมือเปิดสำหรับหน้าต่างที่เปิดอยู่
- เปิดแผงเครือข่ายจากแผง Service Workers
- คัดลอกค่าพร็อพเพอร์ตี้
- คัดลอกสแต็กเทรซสำหรับผู้เริ่มเครือข่าย
- ดูตัวอย่างค่าตัวแปร Wasm เมื่อเมาส์โอเวอร์
- ประเมินตัวแปร Wasm ในคอนโซล
- หน่วยวัดที่สอดคล้องกันสำหรับขนาดไฟล์/หน่วยความจำ
- ไฮไลต์องค์ประกอบจำลองในแผงองค์ประกอบ
- [ทดลอง] เครื่องมือแก้ไขข้อบกพร่องของ CSS Flexbox
- [ทดลอง] ปรับแต่งแป้นพิมพ์ลัดสำหรับคอร์ด
Chrome 87
- เครื่องมือแก้ไขข้อบกพร่องของตารางกริด CSS ใหม่
- แท็บ WebAuthn ใหม่
- ย้ายเครื่องมือไปมาระหว่างแผงด้านบนและด้านล่าง
- แผงแถบด้านข้างที่คำนวณแล้วใหม่ในแผงรูปแบบ
- การจัดกลุ่มพร็อพเพอร์ตี้ CSS ในแผงที่คำนวณ
- Lighthouse 6.3 ในแผง Lighthouse
performance.mark()เหตุการณ์ในส่วนการจับเวลา- ตัวกรอง
resource-typeและurlใหม่ในแผงเครือข่าย - การอัปเดตมุมมองรายละเอียดของเฟรม
- การเลิกใช้งาน
Settingsในเมนูเครื่องมือเพิ่มเติม - [ทดลอง] ดูและแก้ไขปัญหาคอนทราสต์ของสีในแผงภาพรวม CSS
- [ทดลอง] ปรับแต่งแป้นพิมพ์ลัดในเครื่องมือสำหรับนักพัฒนาเว็บ
Chrome 86
- แผงสื่อใหม่
- จับภาพหน้าจอโหนดโดยใช้เมนูตามบริบทของแผงองค์ประกอบ
- การอัปเดตแท็บปัญหา
- จำลองแบบอักษรในเครื่องที่ขาดหายไป
- จำลองผู้ใช้ที่ไม่ได้ใช้งาน
- จำลอง
prefers-reduced-data - การรองรับฟีเจอร์ JavaScript ใหม่
- Lighthouse 6.2 ในแผง Lighthouse
- การเลิกใช้งานรายการ "ต้นทางอื่นๆ" ในแผง Service Workers
- แสดงสรุปความครอบคลุมสำหรับรายการที่กรอง
- มุมมองรายละเอียดเฟรมใหม่ในแผงแอปพลิเคชัน
- คำแนะนำสีที่เข้าถึงได้ในแผงรูปแบบ
- คืนสถานะแผงคุณสมบัติในแผงองค์ประกอบ
- ค่าส่วนหัว
X-Client-Dataที่มนุษย์อ่านได้ในแผงเครือข่าย - เติมแบบอักษรที่กำหนดเองโดยอัตโนมัติในแผงรูปแบบ
- แสดงประเภททรัพยากรอย่างสม่ำเสมอในแผงเครือข่าย
- ล้างปุ่มในแผงองค์ประกอบและเครือข่าย
Chrome 85
- การแก้ไขรูปแบบสำหรับเฟรมเวิร์ก CSS-in-JS
- Lighthouse 6 ในแผง Lighthouse
- การเลิกใช้งาน First Meaningful Paint (FMP)
- การรองรับฟีเจอร์ JavaScript ใหม่
- คำเตือนทางลัดของแอปใหม่ในแผงไฟล์ Manifest
- เหตุการณ์
respondWithของ Service Worker ในแท็บเวลา - การแสดงผลที่สอดคล้องกันของแผงที่คำนวณแล้ว
- การชดเชยไบต์โค้ดสำหรับไฟล์ WebAssembly
- คัดลอกและตัดตามบรรทัดในแผงแหล่งที่มา
- การอัปเดตการตั้งค่าคอนโซล
- การอัปเดตแผงประสิทธิภาพ
- ไอคอนใหม่สำหรับเบรกพอยท์ เบรกพอยท์แบบมีเงื่อนไข และจุดตรวจสอบ
Chrome 84
- แก้ไขปัญหาเว็บไซต์ด้วยแท็บปัญหาใหม่
- ดูข้อมูลการช่วยเหลือพิเศษในเคล็ดลับเครื่องมือของโหมดตรวจสอบ
- การอัปเดตแผงประสิทธิภาพ
- คำศัพท์ของคำสัญญาที่แม่นยำยิ่งขึ้นในคอนโซล
- การอัปเดตแผงรูปแบบ
- การเลิกใช้งานแผงคุณสมบัติในแผงองค์ประกอบ
- รองรับแป้นพิมพ์ลัดของแอปในแผงไฟล์ Manifest
Chrome 83
- จำลองภาวะบกพร่องทางการมองเห็น
- เลียนแบบภาษา
- การแก้ไขข้อบกพร่องของนโยบายเครื่องมือฝังแบบข้ามต้นทาง (COEP)
- ไอคอนใหม่สำหรับเบรกพอยท์ เบรกพอยท์แบบมีเงื่อนไข และจุดตรวจสอบ
- ดูคำขอเครือข่ายที่ตั้งค่าคุกกี้เฉพาะ
- ข้ามเมนูคำสั่งไปทางซ้าย
- ย้ายตัวเลือกการตั้งค่าในเมนูหลักแล้ว
- แผงการตรวจสอบเปลี่ยนเป็นแผง Lighthouse แล้ว
- ลบการลบล้างในเครื่องทั้งหมดในโฟลเดอร์
- UI ของ Tasks แบบยาวที่อัปเดต
- การรองรับไอคอนที่มาสก์ได้ในแผงไฟล์ Manifest
Chrome 82
Chrome 81
- การรองรับ Moto G4 ในโหมดอุปกรณ์
- ข้อมูลอัปเดตที่เกี่ยวข้องกับคุกกี้
- ไอคอนไฟล์ Manifest ของเว็บแอปที่แม่นยำยิ่งขึ้น
- วางเมาส์เหนือพร็อพเพอร์ตี้
contentของ CSS เพื่อดูค่าที่ไม่ใช้ Escape - ข้อผิดพลาดเกี่ยวกับการแมปแหล่งที่มาในคอนโซล
- การตั้งค่าสำหรับปิดใช้การเลื่อนผ่านจุดสิ้นสุดไฟล์
Chrome 80
- รองรับการประกาศซ้ำ
letและclassในคอนโซล - การแก้ไขข้อบกพร่อง WebAssembly ที่ปรับปรุงใหม่
- ขอเชนผู้เริ่มต้นในแท็บผู้เริ่ม
- ไฮไลต์คำขอเครือข่ายที่เลือกในภาพรวม
- คอลัมน์ URL และเส้นทางในแผงเครือข่าย
- สตริง User Agent ที่อัปเดต
- UI การกำหนดค่าแผงการตรวจสอบใหม่
- โหมดการครอบคลุมโค้ดแบบต่อฟังก์ชันหรือต่อบล็อก
- ตอนนี้การครอบคลุมของโค้ดต้องเริ่มต้นโดยการโหลดหน้าซ้ำ
Chrome 79
- แก้ไขข้อบกพร่องสาเหตุที่คุกกี้ถูกบล็อก
- ดูค่าคุกกี้
- จำลองรูปแบบสีที่ชอบและความต้องการการเคลื่อนไหวที่ลดลง
- การอัปเดตการครอบคลุมของโค้ด
- แก้ไขข้อบกพร่องเมื่อมีการขอทรัพยากรเครือข่าย
- แผงคอนโซลและแผงแหล่งที่มาจะเป็นไปตามค่ากำหนดการเยื้องอีกครั้ง
- แป้นพิมพ์ลัดใหม่สำหรับการนำทางเคอร์เซอร์
Chrome 78
- การสนับสนุนหลายลูกค้าในแผงการตรวจสอบ
- การแก้ไขข้อบกพร่องของตัวแฮนเดิลการชำระเงิน
- Lighthouse 5.2 ในแผงการตรวจสอบ
- Largest Contentful Paint ในแผงประสิทธิภาพ
- ปัญหาเกี่ยวกับเครื่องมือสำหรับนักพัฒนาเว็บจากเมนูหลัก
Chrome 77
- คัดลอกรูปแบบองค์ประกอบ
- แสดงภาพการเปลี่ยนเลย์เอาต์
- Lighthouse 5.1 ในแผงการตรวจสอบ
- การซิงค์ธีมของระบบปฏิบัติการ
- แป้นพิมพ์ลัดสำหรับเปิดเครื่องมือแก้ไขเบรกพอยท์
- ดึงข้อมูลแคชล่วงหน้าในแผงเครือข่าย
- พร็อพเพอร์ตี้ส่วนตัวเมื่อดูออบเจ็กต์
- การแจ้งเตือนและข้อความพุชในแผงแอปพลิเคชัน
Chrome 76
- เติมข้อความอัตโนมัติด้วยค่า CSS
- UI ใหม่สำหรับการตั้งค่าเครือข่าย
- ข้อความ WebSocket ในการส่งออก HAR
- ปุ่มนำเข้าและส่งออก HAR
- การใช้งานหน่วยความจำแบบเรียลไทม์
- หมายเลขพอร์ตการลงทะเบียนของ Service Worker
- ตรวจสอบเหตุการณ์การดึงข้อมูลในเบื้องหลังและการซิงค์ในเบื้องหลัง
- Puppeteer สำหรับ Firefox
Chrome 75
- ค่าที่กำหนดล่วงหน้าที่เป็นประโยชน์เมื่อเติมเต็มฟังก์ชัน CSS อัตโนมัติ
- ล้างข้อมูลเว็บไซต์จากเมนูคำสั่ง
- ดูฐานข้อมูล IndexedDB ทั้งหมด
- ดูขนาดที่ไม่มีการบีบอัดของทรัพยากรเมื่อวางเมาส์เหนือ
- เบรกพอยท์ในบรรทัดในแผงเบรกพอยท์
- จำนวนทรัพยากร IndexedDB และ Cache
- การตั้งค่าเพื่อปิดใช้เคล็ดลับเครื่องมือการตรวจสอบโดยละเอียด
- การตั้งค่าสำหรับการสลับการเยื้องแท็บใน Editor
Chrome 74
- ไฮไลต์โหนดทั้งหมดที่ได้รับผลกระทบจากพร็อพเพอร์ตี้ CSS
- Lighthouse v4 ในแผงการตรวจสอบ
- ผู้ดูข้อความไบนารี WebSocket
- จับภาพหน้าจอของพื้นที่ในเมนูคำสั่ง
- ตัวกรอง Service Worker ในแผงเครือข่าย
- การอัปเดตแผงประสิทธิภาพ
- งานที่ใช้เวลานานในการบันทึกแผงประสิทธิภาพ
- การแสดงผลครั้งแรกในส่วนระยะเวลา
- เคล็ดลับพิเศษ: ทางลัดเพื่อดูรหัสสี RGB และ HSL (วิดีโอ)
Chrome 73
- จุดตรวจสอบ
- เคล็ดลับเครื่องมือโดยละเอียดในโหมดตรวจสอบ
- ส่งออกข้อมูลการครอบคลุมของโค้ด
- ไปยังส่วนต่างๆ ในคอนโซลด้วยแป้นพิมพ์
- เส้นอัตราส่วนคอนทราสต์ AAA ในตัวเลือกสี
- บันทึกการลบล้างตำแหน่งทางภูมิศาสตร์ที่กำหนดเอง
- การพับโค้ด
- แท็บเฟรมเปลี่ยนชื่อเป็นแท็บข้อความแล้ว
- เคล็ดลับพิเศษ: การกรองตามพร็อพเพอร์ตี้ของแผงเครือข่าย (วิดีโอ)
Chrome 72
- แสดงภาพเมตริกประสิทธิภาพในแผงประสิทธิภาพ
- ไฮไลต์โหนดข้อความในแผนผัง DOM
- คัดลอกเส้นทาง JS ไปยังโหนด DOM
- การอัปเดตแผงการตรวจสอบ รวมถึงการตรวจสอบใหม่ที่ตรวจหาไลบรารี JS และคีย์เวิร์ดใหม่สำหรับการเข้าถึงแผงการตรวจสอบจากเมนูคำสั่ง
- เคล็ดลับพิเศษ: ใช้โหมดอุปกรณ์เพื่อตรวจสอบคำค้นหาสื่อ (วิดีโอ)
Chrome 71
- วางเมาส์เหนือผลลัพธ์ Live Express เพื่อไฮไลต์โหนด DOM
- เก็บโหนด DOM เป็นตัวแปรร่วม
- ตอนนี้ข้อมูลตัวเริ่มและลำดับความสำคัญในการนำเข้าและส่งออก HAR แล้ว
- เข้าถึงเมนูคำสั่งจากเมนูหลัก
- เบรกพอยท์การแสดงภาพซ้อนภาพ
- เคล็ดลับพิเศษ: ใช้
monitorEvents()เพื่อบันทึกเหตุการณ์ที่เริ่มทำงานของโหนดในคอนโซล (วิดีโอ)
Chrome 70
- นิพจน์ทั่วไปในคอนโซล
- ไฮไลต์โหนด DOM ระหว่างการประเมินอย่างตั้งใจ
- การเพิ่มประสิทธิภาพแผงประสิทธิภาพ
- การแก้ไขข้อบกพร่องที่น่าเชื่อถือยิ่งขึ้น
- เปิดใช้การควบคุมเครือข่ายจากเมนูคำสั่ง
- เติมเบรกพอยท์แบบมีเงื่อนไขอัตโนมัติ
- ช่วงพักของเหตุการณ์ AudioContext
- แก้ไขข้อบกพร่องแอป Node.js ด้วย ndb
- เคล็ดลับพิเศษ: วัดการโต้ตอบของผู้ใช้ในชีวิตจริงด้วย User Timing API
Chrome 68
- การประเมินที่ตั้งใจ
- คําแนะนําการโต้แย้ง
- การเติมข้อความฟังก์ชันอัตโนมัติ
- คีย์เวิร์ด ES2017
- Lighthouse 3.0 ในแผงการตรวจสอบ
- ทีมสนับสนุนของ BigInt
- การเพิ่มเส้นทางพร็อพเพอร์ตี้ไปยังแผงหน้าปัด
- ย้าย"แสดงการประทับเวลา" ไปที่การตั้งค่า
- เคล็ดลับพิเศษ: เมธอดของคอนโซลที่ไม่ค่อยมีคนรู้จัก (วิดีโอ)
Chrome 67
- ค้นหาในส่วนหัวของเครือข่ายทั้งหมด
- ตัวอย่างค่าตัวแปร CSS
- คัดลอกเป็นการดึงข้อมูล
- การตรวจสอบใหม่ ตัวเลือกการกำหนดค่าเดสก์ท็อป และการติดตามการดู
- หยุดการวนซ้ำที่ไม่สิ้นสุด
- ระยะเวลาของผู้ใช้ในแท็บประสิทธิภาพ
- อินสแตนซ์ VM ของ JavaScript ที่แสดงในแผงหน่วยความจำอย่างชัดเจน
- แท็บเครือข่ายเปลี่ยนชื่อเป็นแท็บหน้า
- การอัปเดตธีมมืด
- ข้อมูลความโปร่งใสของใบรับรองในแผงความปลอดภัย
- ฟีเจอร์การแยกเว็บไซต์ในแผงประสิทธิภาพ
- เคล็ดลับพิเศษ: แผงเลเยอร์ + เครื่องมือตรวจสอบภาพเคลื่อนไหว (วิดีโอ)
Chrome 66
- Blackboxing ในแผงเครือข่าย
- ปรับการซูมอัตโนมัติในโหมดอุปกรณ์
- การจัดรูปแบบที่ค่อนข้างมากในแท็บตัวอย่างและแท็บคำตอบ
- การแสดงตัวอย่างเนื้อหา HTML ในแท็บ "แสดงตัวอย่าง"
- การลบล้างในเครื่องรองรับรูปแบบภายใน HTML
- เคล็ดลับพิเศษ: สคริปต์เฟรมเวิร์กของ Blackbox เพื่อทำให้เบรกพอยท์ของ Listener เหตุการณ์มีประโยชน์มากขึ้น
Chrome 65
- การลบล้างในเครื่อง
- เครื่องมือช่วยเหลือพิเศษใหม่
- แท็บการเปลี่ยนแปลง
- SEO และการตรวจสอบประสิทธิภาพแบบใหม่
- การบันทึกหลายรายการในแผงประสิทธิภาพ
- การใช้โค้ดที่เชื่อถือได้กับผู้ปฏิบัติงานในโค้ดแบบไม่พร้อมกัน
- เคล็ดลับพิเศษ: เปลี่ยนการดำเนินการในเครื่องมือสำหรับนักพัฒนาเว็บให้เป็นอัตโนมัติด้วย Puppeteer (วิดีโอ)
Chrome 64
- การตรวจสอบประสิทธิภาพ
- แถบด้านข้างของคอนโซล
- จัดกลุ่มข้อความ Console ที่คล้ายกัน
- เคล็ดลับพิเศษ: เปิด/ปิดคลาส Pseudo แบบวางเหนือ (วิดีโอ)
Chrome 63
- การสนับสนุนการแก้ไขข้อบกพร่องจากระยะไกลแบบหลายไคลเอ็นต์
- พื้นที่ทำงาน 2.0
- การตรวจสอบใหม่ 4 รายการ
- จำลองข้อความ Push ด้วยข้อมูลที่กำหนดเอง
- ทริกเกอร์เหตุการณ์การซิงค์ในเบื้องหลังด้วยแท็กที่กำหนดเอง
- เคล็ดลับพิเศษ: เบรกพอยท์ของ Listener เหตุการณ์ (วิดีโอ)
Chrome 62
- ระดับบนสุดรอคุณอยู่ในคอนโซล
- เวิร์กโฟลว์ภาพหน้าจอใหม่
- การไฮไลต์ตารางกริดของ CSS
- Console API ใหม่สําหรับการค้นหาออบเจ็กต์
- ตัวกรองคอนโซลใหม่
- การนำเข้า HAR ในแผงเครือข่าย
- แหล่งข้อมูลเกี่ยวกับแคชที่แสดงตัวอย่างได้
- การแก้ไขข้อบกพร่องของแคชที่คาดการณ์ได้มากขึ้น
- การครอบคลุมของโค้ดระดับการบล็อก
Chrome 61
- การจำลองการควบคุมอุปกรณ์เคลื่อนที่
- ดูการใช้พื้นที่เก็บข้อมูล
- ดูเมื่อ Service Worker แคชคำตอบ
- เปิดใช้เครื่องวัด FPS จากเมนูคำสั่ง
- ตั้งค่าลักษณะการทำงานของลูกกลิ้งเมาส์เป็นการซูมหรือเลื่อน
- การรองรับการแก้ไขข้อบกพร่องสำหรับโมดูล ES6
Chrome 60
- แผงการตรวจสอบใหม่
- ป้ายของบุคคลที่สาม
- ท่าทางสัมผัสใหม่สำหรับ "ดำเนินการต่อไปยังที่นี่"
- เริ่มการทำงานแบบไม่พร้อมกัน
- ตัวอย่างออบเจ็กต์ที่ให้ข้อมูลมากขึ้นในคอนโซล
- การเลือกบริบทที่ให้ข้อมูลมากขึ้นในคอนโซล
- ข้อมูลอัปเดตแบบเรียลไทม์ในแท็บการครอบคลุม
- ตัวเลือกการควบคุมเครือข่ายที่ง่ายขึ้น
- สแต็กที่ไม่พร้อมกันจะเปิดอยู่โดยค่าเริ่มต้น