The Google Sheets API lets you create and update charts within spreadsheets as
needed. The examples on this page illustrate how you can achieve some common
chart operations with the Sheets API.
These examples are presented in the form of HTTP requests to be language
neutral. To learn how to implement a batch update in different languages using
the Google API client libraries, see
[Update spreadsheets](https://developers.google.com/workspace/sheets/api/guides/batchupdate#example).
In these examples, the placeholders SPREADSHEET_ID and SHEET_ID
indicates where you would provide those IDs. You can find the [spreadsheet
ID](https://developers.google.com/workspace/sheets/api/guides/concepts#spreadsheet) in the spreadsheet URL.
You can get the [sheet ID](https://developers.google.com/workspace/sheets/api/guides/concepts#sheet) by using
the
[`spreadsheets.get`](https://developers.google.com/workspace/sheets/api/reference/rest/v4/spreadsheets/get)
method. The ranges are specified using [A1
notation](https://developers.google.com/workspace/sheets/api/guides/concepts#cell). An example range is
Sheet1!A1:D5.
Additionally, the placeholder CHART_ID indicates the ID of a given
chart. You can set this ID when creating a chart with the Sheets API,
or allow Sheets API to generate one for you. You can get the IDs of
existing charts with the
[`spreadsheets.get`](https://developers.google.com/workspace/sheets/api/reference/rest/v4/spreadsheets/get)
method.
Finally, the placeholder SOURCE_SHEET_ID indicates your sheet with
the source data. In these examples, this is the table listed under [Chart source
data](https://developers.google.com/workspace/sheets/api/samples/charts#chart-source-data).
> [!NOTE]
> The Sheets API doesn't yet grant full control of charts in Google Sheets. Some chart types and certain chart settings (such as background color or axis label formatting) can't be accessed or selected with the current API. If you attempt to edit a chart with one of these settings, the setting might be reset to its default value.
## Chart source data
For these examples, assume the spreadsheet being used has the following source
data in its first sheet ("Sheet1"). The strings in the first row are labels for
the individual columns. To view examples of how to read from other sheets in
your spreadsheet, see [A1 notation](https://developers.google.com/workspace/sheets/api/guides/concepts#cell).
|---|---|---|---|---|---|
| | A | B | C | D | E |
| 1 | Model Number | Sales - Jan | Sales - Feb | Sales - Mar | Total Sales |
| 2 | D-01X | 68 | 74 | 60 | 202 |
| 3 | FR-0B1 | 97 | 76 | 88 | 261 |
| 4 | P-034 | 27 | 49 | 32 | 108 |
| 5 | P-105 | 46 | 44 | 67 | 157 |
| 6 | W-11 | 75 | 68 | 87 | 230 |
| 7 | W-24 | 74 | 52 | 62 | 188 |
## Add a column chart
The following
[`spreadsheets.batchUpdate`](https://developers.google.com/workspace/sheets/api/reference/rest/v4/spreadsheets/batchUpdate)
code sample shows how to use the
[`AddChartRequest`](https://developers.google.com/workspace/sheets/api/reference/rest/v4/spreadsheets/request#addchartrequest)
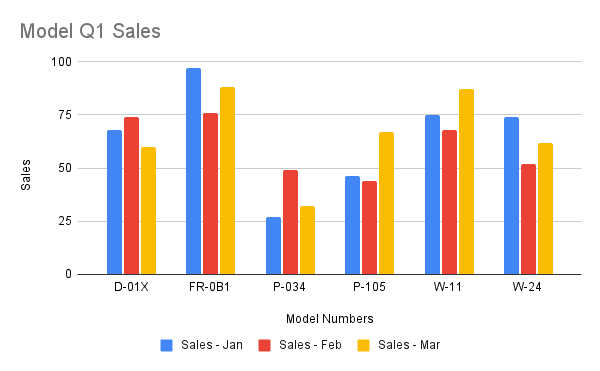
to create a column chart from the source data, placing it in a new sheet. The
request does the following to configure the chart:
- Sets the chart type as a column chart.
- Adds a legend to the bottom of the chart.
- Sets the chart and axis titles.
- Configures 3 data series, representing sales for 3 different months while using default formatting and colors.
The request protocol is shown below.
```
POST https://sheets.googleapis.com/v4/spreadsheets/SPREADSHEET_ID:batchUpdate
```
```
{
"requests": [
{
"https://developers.google.com/workspace/sheets/api/reference/rest/v4/spreadsheets/request#addchartrequest": {
"https://developers.google.com/workspace/sheets/api/reference/rest/v4/spreadsheets/charts#EmbeddedChart": {
"https://developers.google.com/workspace/sheets/api/reference/rest/v4/spreadsheets/charts#ChartSpec": {
"title": "Model Q1 Sales",
"https://developers.google.com/workspace/sheets/api/reference/rest/v4/spreadsheets/charts#BasicChartSpec": {
"https://developers.google.com/workspace/sheets/api/reference/rest/v4/spreadsheets/charts#BasicChartType": "COLUMN",
"https://developers.google.com/workspace/sheets/api/reference/rest/v4/spreadsheets/charts#BasicChartLegendPosition": "BOTTOM_LEGEND",
"https://developers.google.com/workspace/sheets/api/reference/rest/v4/spreadsheets/charts#BasicChartAxis": [
{
"https://developers.google.com/workspace/sheets/api/reference/rest/v4/spreadsheets/charts#BasicChartAxisPosition": "BOTTOM_AXIS",
"title": "Model Numbers"
},
{
"https://developers.google.com/workspace/sheets/api/reference/rest/v4/spreadsheets/charts#BasicChartAxisPosition": "LEFT_AXIS",
"title": "Sales"
}
],
"https://developers.google.com/workspace/sheets/api/reference/rest/v4/spreadsheets/charts#BasicChartDomain": [
{
"https://developers.google.com/workspace/sheets/api/reference/rest/v4/spreadsheets/charts#ChartData": {
"https://developers.google.com/workspace/sheets/api/reference/rest/v4/spreadsheets/charts#ChartSourceRange": {
"https://developers.google.com/workspace/sheets/api/reference/rest/v4/spreadsheets/other#GridRange": [
{
"sheetId": SOURCE_SHEET_ID,
"startRowIndex": 0,
"endRowIndex": 7,
"startColumnIndex": 0,
"endColumnIndex": 1
}
]
}
}
}
],
"https://developers.google.com/workspace/sheets/api/reference/rest/v4/spreadsheets/charts#BasicChartSeries": [
{
"https://developers.google.com/workspace/sheets/api/reference/rest/v4/spreadsheets/charts#ChartData": {
"https://developers.google.com/workspace/sheets/api/reference/rest/v4/spreadsheets/charts#ChartSourceRange": {
"https://developers.google.com/workspace/sheets/api/reference/rest/v4/spreadsheets/other#GridRange": [
{
"sheetId": SOURCE_SHEET_ID,
"startRowIndex": 0,
"endRowIndex": 7,
"startColumnIndex": 1,
"endColumnIndex": 2
}
]
}
},
"https://developers.google.com/workspace/sheets/api/reference/rest/v4/spreadsheets/charts#BasicChartAxisPosition": "LEFT_AXIS"
},
{
"https://developers.google.com/workspace/sheets/api/reference/rest/v4/spreadsheets/charts#ChartData": {
"https://developers.google.com/workspace/sheets/api/reference/rest/v4/spreadsheets/charts#ChartSourceRange": {
"https://developers.google.com/workspace/sheets/api/reference/rest/v4/spreadsheets/other#GridRange": [
{
"sheetId": SOURCE_SHEET_ID,
"startRowIndex": 0,
"endRowIndex": 7,
"startColumnIndex": 2,
"endColumnIndex": 3
}
]
}
},
"https://developers.google.com/workspace/sheets/api/reference/rest/v4/spreadsheets/charts#BasicChartAxisPosition": "LEFT_AXIS"
},
{
"https://developers.google.com/workspace/sheets/api/reference/rest/v4/spreadsheets/charts#ChartData": {
"https://developers.google.com/workspace/sheets/api/reference/rest/v4/spreadsheets/charts#ChartSourceRange": {
"https://developers.google.com/workspace/sheets/api/reference/rest/v4/spreadsheets/other#GridRange": [
{
"sheetId": SOURCE_SHEET_ID,
"startRowIndex": 0,
"endRowIndex": 7,
"startColumnIndex": 3,
"endColumnIndex": 4
}
]
}
},
"https://developers.google.com/workspace/sheets/api/reference/rest/v4/spreadsheets/charts#BasicChartAxisPosition": "LEFT_AXIS"
}
],
"headerCount": 1
}
},
"https://developers.google.com/workspace/sheets/api/reference/rest/v4/spreadsheets/charts#EmbeddedObjectPosition": {
"newSheet": true
}
}
}
}
]
}
```
The request creates a chart in a new sheet like this:
## Add a pie chart
The following
[`spreadsheets.batchUpdate`](https://developers.google.com/workspace/sheets/api/reference/rest/v4/spreadsheets/batchUpdate)
code sample shows how to use the
[`AddChartRequest`](https://developers.google.com/workspace/sheets/api/reference/rest/v4/spreadsheets/request#addchartrequest)
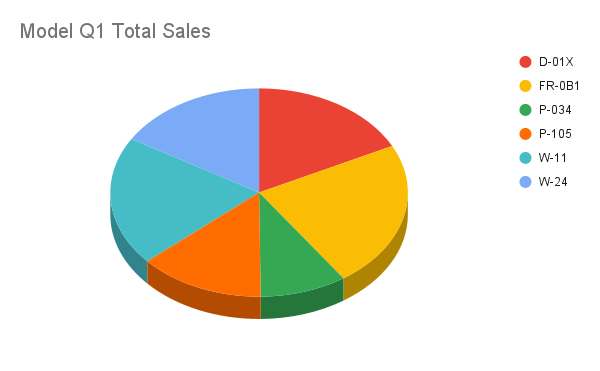
to create a 3D pie chart from the source data. The request does the following to
configure the chart:
- Sets the chart title.
- Adds a legend to the right of the chart.
- Sets the chart as a 3D pie chart. Note that 3D pie charts cannot have a "donut hole" in the center the way flat pie charts can.
- Sets the chart data series as the total sales for each model number.
- Anchors the chart on cell C3 of the sheet specified by SHEET_ID, with a 50 pixel offset in both the X and Y directions.
The request protocol is shown below.
```
POST https://sheets.googleapis.com/v4/spreadsheets/SPREADSHEET_ID:batchUpdate
```
```
{
"requests": [
{
"https://developers.google.com/workspace/sheets/api/reference/rest/v4/spreadsheets/request#addchartrequest": {
"https://developers.google.com/workspace/sheets/api/reference/rest/v4/spreadsheets/charts#EmbeddedChart": {
"https://developers.google.com/workspace/sheets/api/reference/rest/v4/spreadsheets/charts#ChartSpec": {
"title": "Model Q1 Total Sales",
"https://developers.google.com/workspace/sheets/api/reference/rest/v4/spreadsheets/charts#PieChartSpec": {
"https://developers.google.com/workspace/sheets/api/reference/rest/v4/spreadsheets/charts#BasicChartLegendPosition": "RIGHT_LEGEND",
"threeDimensional": true,
"https://developers.google.com/workspace/sheets/api/reference/rest/v4/spreadsheets/charts#ChartData": {
"https://developers.google.com/workspace/sheets/api/reference/rest/v4/spreadsheets/charts#ChartSourceRange": {
"https://developers.google.com/workspace/sheets/api/reference/rest/v4/spreadsheets/other#GridRange": [
{
"sheetId": SOURCE_SHEET_ID,
"startRowIndex": 0,
"endRowIndex": 7,
"startColumnIndex": 0,
"endColumnIndex": 1
}
]
}
},
"https://developers.google.com/workspace/sheets/api/reference/rest/v4/spreadsheets/charts#ChartData": {
"https://developers.google.com/workspace/sheets/api/reference/rest/v4/spreadsheets/charts#ChartSourceRange": {
"https://developers.google.com/workspace/sheets/api/reference/rest/v4/spreadsheets/other#GridRange": [
{
"sheetId": SOURCE_SHEET_ID,
"startRowIndex": 0,
"endRowIndex": 7,
"startColumnIndex": 4,
"endColumnIndex": 5
}
]
}
},
}
},
"https://developers.google.com/workspace/sheets/api/reference/rest/v4/spreadsheets/charts#EmbeddedObjectPosition": {
"https://developers.google.com/workspace/sheets/api/reference/rest/v4/spreadsheets/charts#OverlayPosition": {
"https://developers.google.com/workspace/sheets/api/reference/rest/v4/spreadsheets/charts#GridCoordinate": {
"sheetId": SHEET_ID,
"rowIndex": 2,
"columnIndex": 2
},
"offsetXPixels": 50,
"offsetYPixels": 50
}
}
}
}
}
]
}
```
The request creates a chart like this:
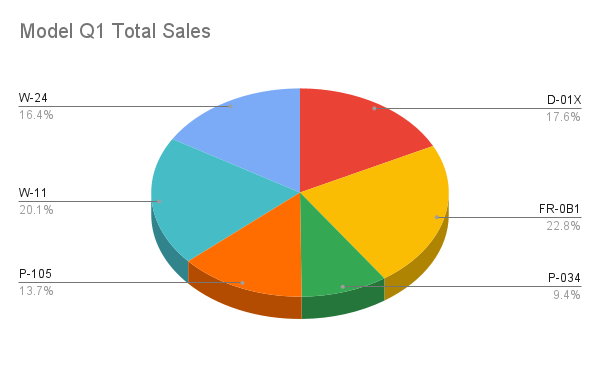
Alternatively, you can also update the legendPosition value from RIGHT_LEGEND
to LABELED_LEGEND within the request so the legend values are
connected to the pie chart slices.
```
'legendPosition': 'LABELED_LEGEND',
```
The updated request creates a chart like this:
## Add a line chart using multiple non-adjacent ranges
The following
[`spreadsheets.batchUpdate`](https://developers.google.com/workspace/sheets/api/reference/rest/v4/spreadsheets/batchUpdate)
code sample shows how to use the
[`AddChartRequest`](https://developers.google.com/workspace/sheets/api/reference/rest/v4/spreadsheets/request#addchartrequest)
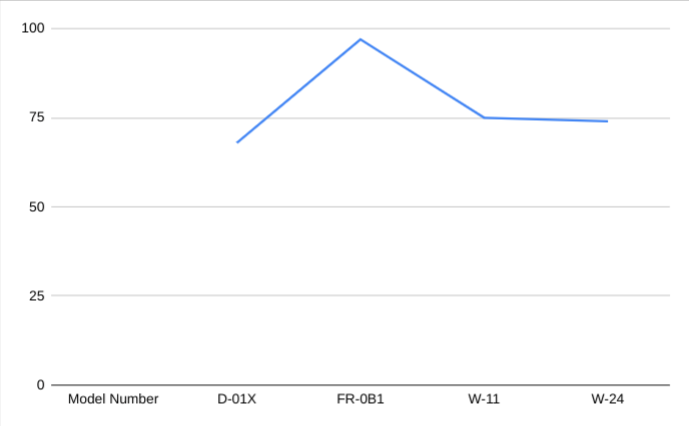
to create a line chart from the source data, placing it in the source sheet.
Selecting non-adjacent ranges can be used to exclude rows from the
[`ChartSourceRange`](https://developers.google.com/workspace/sheets/api/reference/rest/v4/spreadsheets/charts#chartsourcerange).
The request does the following to configure the chart:
- Sets the chart type as a line chart.
- Sets the horizontal x-axis title.
- Configures a data series representing sales. It sets A1:A3 and A6:A7 as a [`domain`](https://developers.google.com/workspace/sheets/api/reference/rest/v4/spreadsheets/charts#basicchartdomain), and B1:B3 and B6:B7 as a [`series`](https://developers.google.com/workspace/sheets/api/reference/rest/v4/spreadsheets/charts#basicchartseries), while using default formatting and colors. Ranges are specified using [A1
notation](https://developers.google.com/workspace/sheets/api/guides/concepts#cell) in the request URL.
- Anchors the chart on cell H8 of the sheet specified by SHEET_ID.
The request protocol is shown below.
```
POST https://sheets.googleapis.com/v4/spreadsheets/SPREADSHEET_ID:batchUpdate
```
```
{
"requests": [
{
"addChart": {
"chart": {
"spec": {
"basicChart": {
"chartType": "LINE",
"domains": [
{
"domain": {
"sourceRange": {
"sources": [
{
"startRowIndex": 0,
"endRowIndex": 3,
"startColumnIndex": 0,
"endColumnIndex": 1,
"sheetId": SOURCE_SHEET_ID
},
{
"startRowIndex": 5,
"endRowIndex": 7,
"startColumnIndex": 0,
"endColumnIndex": 1,
"sheetId": SOURCE_SHEET_ID
}
]
}
}
}
],
"series": [
{
"series": {
"sourceRange": {
"sources": [
{
"startRowIndex": 0,
"endRowIndex": 3,
"startColumnIndex": 1,
"endColumnIndex": 2,
"sheetId": SOURCE_SHEET_ID
},
{
"startRowIndex": 5,
"endRowIndex": 7,
"startColumnIndex": 1,
"endColumnIndex": 2,
"sheetId": SOURCE_SHEET_ID
}
]
}
}
}
]
}
},
"position": {
"overlayPosition": {
"anchorCell": {
"sheetId": SOURCE_SHEET_ID,
"rowIndex": 8,
"columnIndex": 8
}
}
}
}
}
}
]
}
```
The request creates a chart in a new sheet like this:
## Delete a chart
The following
[`spreadsheets.batchUpdate`](https://developers.google.com/workspace/sheets/api/reference/rest/v4/spreadsheets/batchUpdate)
code sample shows how to use the
[`DeleteEmbeddedObjectRequest`](https://developers.google.com/workspace/sheets/api/reference/rest/v4/spreadsheets/request#deleteembeddedobjectrequest)
to delete a chart specified by the CHART_ID.
The request protocol is shown below.
```
POST https://sheets.googleapis.com/v4/spreadsheets/SPREADSHEET_ID:batchUpdate
```
```
{
"requests": [
{
"deleteEmbeddedObject": {
"objectId": CHART_ID
}
}
]
}
```
## Edit a chart's properties
The following
[`spreadsheets.batchUpdate`](https://developers.google.com/workspace/sheets/api/reference/rest/v4/spreadsheets/batchUpdate)
code sample shows how to use the
[`UpdateChartSpecRequest`](https://developers.google.com/workspace/sheets/api/reference/rest/v4/spreadsheets/request#updatechartspecrequest)
to edit the chart created in the [Add a column chart](https://developers.google.com/workspace/sheets/api/samples/charts#column-chart) recipe,
modifying its data, type, and appearance. Subsets of chart properties cannot be
changed individually. To make edits, you must supply the entire `spec` field
with an `UpdateChartSpecRequest`. Essentially, editing a chart specification
requires replacing it with a new one.
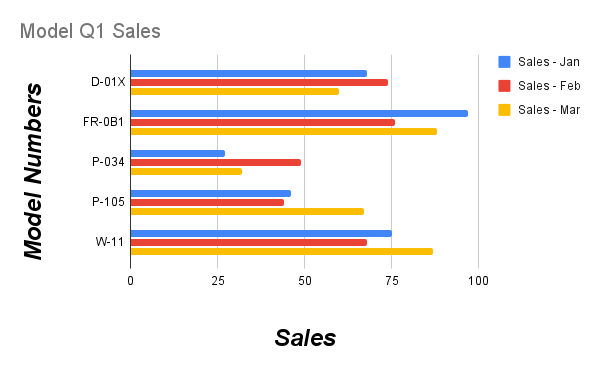
The following request updates the original chart (specified by
CHART_ID):
- Sets the chart type to `BAR`.
- Moves the legend to the right of the chart.
- Inverts the axes so that "Sales" is on the bottom axis and "Model Numbers" is on the left axis.
- Sets the axis title format to be 24-point font, bold, and italicized.
- Removes the "W-24" data from the chart (row 7 in [chart source
data](https://developers.google.com/workspace/sheets/api/samples/charts#chart-source-data)).
The request protocol is shown below.
```
POST https://sheets.googleapis.com/v4/spreadsheets/SPREADSHEET_ID:batchUpdate
```
```
{
"requests": [
{
"https://developers.google.com/workspace/sheets/api/reference/rest/v4/spreadsheets/request#updatechartspecrequest": {
"chartId": CHART_ID,
"https://developers.google.com/workspace/sheets/api/reference/rest/v4/spreadsheets/charts#ChartSpec": {
"title": "Model Q1 Sales",
"https://developers.google.com/workspace/sheets/api/reference/rest/v4/spreadsheets/charts#BasicChartSpec": {
"https://developers.google.com/workspace/sheets/api/reference/rest/v4/spreadsheets/charts#BasicChartType": "BAR",
"https://developers.google.com/workspace/sheets/api/reference/rest/v4/spreadsheets/charts#BasicChartLegendPosition": "RIGHT_LEGEND",
"https://developers.google.com/workspace/sheets/api/reference/rest/v4/spreadsheets/charts#BasicChartAxis": [
{
"https://developers.google.com/workspace/sheets/api/reference/rest/v4/spreadsheets/other#TextFormat": {
"bold": true,
"italic": true,
"fontSize": 24
},
"https://developers.google.com/workspace/sheets/api/reference/rest/v4/spreadsheets/charts#BasicChartAxisPosition": "BOTTOM_AXIS",
"title": "Sales"
},
{
"https://developers.google.com/workspace/sheets/api/reference/rest/v4/spreadsheets/other#TextFormat": {
"bold": true,
"italic": true,
"fontSize": 24
},
"https://developers.google.com/workspace/sheets/api/reference/rest/v4/spreadsheets/charts#BasicChartAxisPosition": "LEFT_AXIS",
"title": "Model Numbers"
}
],
"https://developers.google.com/workspace/sheets/api/reference/rest/v4/spreadsheets/charts#BasicChartDomain": [
{
"https://developers.google.com/workspace/sheets/api/reference/rest/v4/spreadsheets/charts#ChartData": {
"https://developers.google.com/workspace/sheets/api/reference/rest/v4/spreadsheets/charts#ChartSourceRange": {
"https://developers.google.com/workspace/sheets/api/reference/rest/v4/spreadsheets/other#GridRange": [
{
"sheetId": SOURCE_SHEET_ID,
"startRowIndex": 0,
"endRowIndex": 6,
"startColumnIndex": 0,
"endColumnIndex": 1
}
]
}
}
}
],
"https://developers.google.com/workspace/sheets/api/reference/rest/v4/spreadsheets/charts#BasicChartSeries": [
{
"https://developers.google.com/workspace/sheets/api/reference/rest/v4/spreadsheets/charts#ChartData": {
"https://developers.google.com/workspace/sheets/api/reference/rest/v4/spreadsheets/charts#ChartSourceRange": {
"https://developers.google.com/workspace/sheets/api/reference/rest/v4/spreadsheets/other#GridRange": [
{
"sheetId": SOURCE_SHEET_ID,
"startRowIndex": 0,
"endRowIndex": 6,
"startColumnIndex": 1,
"endColumnIndex": 2
}
]
}
},
"https://developers.google.com/workspace/sheets/api/reference/rest/v4/spreadsheets/charts#BasicChartAxisPosition": "BOTTOM_AXIS"
},
{
"https://developers.google.com/workspace/sheets/api/reference/rest/v4/spreadsheets/charts#ChartData": {
"https://developers.google.com/workspace/sheets/api/reference/rest/v4/spreadsheets/charts#ChartSourceRange": {
"https://developers.google.com/workspace/sheets/api/reference/rest/v4/spreadsheets/other#GridRange": [
{
"sheetId": SOURCE_SHEET_ID,
"startRowIndex": 0,
"endRowIndex": 6,
"startColumnIndex": 2,
"endColumnIndex": 3
}
]
}
},
"https://developers.google.com/workspace/sheets/api/reference/rest/v4/spreadsheets/charts#BasicChartAxisPosition": "BOTTOM_AXIS"
},
{
"https://developers.google.com/workspace/sheets/api/reference/rest/v4/spreadsheets/charts#ChartData": {
"https://developers.google.com/workspace/sheets/api/reference/rest/v4/spreadsheets/charts#ChartSourceRange": {
"https://developers.google.com/workspace/sheets/api/reference/rest/v4/spreadsheets/other#GridRange": [
{
"sheetId": SOURCE_SHEET_ID,
"startRowIndex": 0,
"endRowIndex": 6,
"startColumnIndex": 3,
"endColumnIndex": 4
}
]
}
},
"https://developers.google.com/workspace/sheets/api/reference/rest/v4/spreadsheets/charts#BasicChartAxisPosition": "BOTTOM_AXIS"
}
],
"headerCount": 1
}
}
}
}
]
}
```
After the request the chart appears like this:
## Move or resize a chart
The following
[`spreadsheets.batchUpdate`](https://developers.google.com/workspace/sheets/api/reference/rest/v4/spreadsheets/batchUpdate)
code sample shows how to use the
[`UpdateEmbeddedObjectPositionRequest`](https://developers.google.com/workspace/sheets/api/reference/rest/v4/spreadsheets/request#updateembeddedobjectpositionrequest)
to move and resize a chart. After the request, the chart specified by CHART_ID
is:
- Anchored to cell A5 of its original sheet.
- Offset in the X direction by 100 pixels.
- Resized to 1200 by 742 pixels (the default size for a chart is 600 by 371 pixels).
The request only changes those properties specified with the `fields` parameter.
Other properties (such as `offsetYPixels`) retain their original values.
The request protocol is shown below.
```
POST https://sheets.googleapis.com/v4/spreadsheets/SPREADSHEET_ID:batchUpdate
```
```
{
"requests": [
{
"updateEmbeddedObjectPosition": {
"objectId": CHART_ID,
"newPosition": {
"overlayPosition": {
"anchorCell": {
"rowIndex": 4,
"columnIndex": 0
},
"offsetXPixels": 100,
"widthPixels": 1200,
"heightPixels": 742
}
},
"fields": "anchorCell(rowIndex,columnIndex),offsetXPixels,widthPixels,heightPixels"
}
}
]
}
```
## Read chart data
The following
[`spreadsheets.get`](https://developers.google.com/workspace/sheets/api/reference/rest/v4/spreadsheets/get)
code sample shows how to get chart data from a spreadsheet. The `fields` query
parameter specifies that only the chart data should be returned.
The response to this method call is a
[`spreadsheet`](https://developers.google.com/workspace/sheets/api/reference/rest/v4/spreadsheets#resource-spreadsheet)
object, which contains an array of
[`sheet`](https://developers.google.com/workspace/sheets/api/reference/rest/v4/spreadsheets/sheets) objects.
Any charts present on a sheet are represented in the
[`sheet`](https://developers.google.com/workspace/sheets/api/reference/rest/v4/spreadsheets/sheets) object.
If a response field is set to the default value, it's omitted from the response.
In this example, the first sheet (SOURCE_SHEET_ID) doesn't have any
charts, so an empty pair of curly braces is returned. The second sheet has the
chart created by [Add a column chart](https://developers.google.com/workspace/sheets/api/samples/charts#column-chart), and nothing else.
The request protocol is shown below.
```
GET https://sheets.googleapis.com/v4/spreadsheets/SPREADSHEET_ID?fields=sheets(charts)
```
```
{
"https://developers.google.com/workspace/sheets/api/reference/rest/v4/spreadsheets#sheet": [
{},
{
"charts": [
{
"chartId": CHART_ID,
"https://developers.google.com/workspace/sheets/api/reference/rest/v4/spreadsheets/charts#EmbeddedObjectPosition": {
"sheetId": SHEET_ID
},
"https://developers.google.com/workspace/sheets/api/reference/rest/v4/spreadsheets/charts#ChartSpec": {
"https://developers.google.com/workspace/sheets/api/reference/rest/v4/spreadsheets/charts#BasicChartSpec": {
"https://developers.google.com/workspace/sheets/api/reference/rest/v4/spreadsheets/charts#BasicChartAxis": [
{
"https://developers.google.com/workspace/sheets/api/reference/rest/v4/spreadsheets/other#TextFormat": {
"bold": false,
"italic": false
},
"https://developers.google.com/workspace/sheets/api/reference/rest/v4/spreadsheets/charts#BasicChartAxisPosition": "BOTTOM_AXIS",
"title": "Model Numbers"
},
{
"https://developers.google.com/workspace/sheets/api/reference/rest/v4/spreadsheets/other#TextFormat": {
"bold": false,
"italic": false
},
"https://developers.google.com/workspace/sheets/api/reference/rest/v4/spreadsheets/charts#BasicChartAxisPosition": "LEFT_AXIS",
"title": "Sales"
}
],
"https://developers.google.com/workspace/sheets/api/reference/rest/v4/spreadsheets/charts#BasicChartType": "COLUMN",
"https://developers.google.com/workspace/sheets/api/reference/rest/v4/spreadsheets/charts#BasicChartDomain": [
{
"https://developers.google.com/workspace/sheets/api/reference/rest/v4/spreadsheets/charts#ChartData": {
"https://developers.google.com/workspace/sheets/api/reference/rest/v4/spreadsheets/charts#ChartSourceRange": {
"https://developers.google.com/workspace/sheets/api/reference/rest/v4/spreadsheets/other#GridRange": [
{
"endColumnIndex": 1
"endRowIndex": 7,
"sheetId": SOURCE_SHEET_ID,
"startColumnIndex": 0,
"startRowIndex": 0,
}
]
}
}
}
],
"https://developers.google.com/workspace/sheets/api/reference/rest/v4/spreadsheets/charts#BasicChartLegendPosition": "BOTTOM_LEGEND",
"https://developers.google.com/workspace/sheets/api/reference/rest/v4/spreadsheets/charts#BasicChartSeries": [
{
"https://developers.google.com/workspace/sheets/api/reference/rest/v4/spreadsheets/charts#ChartData": {
"https://developers.google.com/workspace/sheets/api/reference/rest/v4/spreadsheets/charts#ChartSourceRange": {
"https://developers.google.com/workspace/sheets/api/reference/rest/v4/spreadsheets/other#GridRange": [
{
"endColumnIndex": 2,
"endRowIndex": 7,
"sheetId": SOURCE_SHEET_ID,
"startColumnIndex": 1,
"startRowIndex": 0,
}
]
}
},
"https://developers.google.com/workspace/sheets/api/reference/rest/v4/spreadsheets/charts#BasicChartAxisPosition": "LEFT_AXIS"
},
{
"https://developers.google.com/workspace/sheets/api/reference/rest/v4/spreadsheets/charts#ChartData": {
"https://developers.google.com/workspace/sheets/api/reference/rest/v4/spreadsheets/charts#ChartSourceRange": {
"https://developers.google.com/workspace/sheets/api/reference/rest/v4/spreadsheets/other#GridRange": [
{
"endColumnIndex": 3,
"endRowIndex": 7,
"sheetId": SOURCE_SHEET_ID,
"startColumnIndex": 2,
"startRowIndex": 0,
}
]
}
},
"https://developers.google.com/workspace/sheets/api/reference/rest/v4/spreadsheets/charts#BasicChartAxisPosition": "LEFT_AXIS"
},
{
"https://developers.google.com/workspace/sheets/api/reference/rest/v4/spreadsheets/charts#ChartData": {
"https://developers.google.com/workspace/sheets/api/reference/rest/v4/spreadsheets/charts#ChartSourceRange": {
"https://developers.google.com/workspace/sheets/api/reference/rest/v4/spreadsheets/other#GridRange": [
{
"endColumnIndex": 4,
"endRowIndex": 7,
"sheetId": SOURCE_SHEET_ID,
"startColumnIndex": 3,
"startRowIndex": 0,
}
]
}
},
"https://developers.google.com/workspace/sheets/api/reference/rest/v4/spreadsheets/charts#BasicChartAxisPosition": "LEFT_AXIS"
}
]
},
"https://developers.google.com/workspace/sheets/api/reference/rest/v4/spreadsheets/charts#ChartHiddenDimensionStrategy": "SKIP_HIDDEN_ROWS_AND_COLUMNS",
"title": "Model Q1 Sales",
},
}
]
}
]
}
```