
این سند نحوه ایجاد نمودارهای پراکنده را با استفاده از Chart API شرح می دهد.
فهرست مطالب
ویژگی های خاص نمودار
| ویژگی های استاندارد
|
معرفی
نمودار پراکندگی (یا نمودار پراکندگی) مجموعه ای از نقاط منفرد روی یک نمودار دو بعدی است. شما می توانید به صورت اختیاری اندازه هر نقطه را مشخص کنید. نمودار پراکندگی می تواند تنها یک سری داده را بپذیرد. نمودارهای پراکنده برای تشخیص گروه بندی یا الگوها در بسیاری از نقاط داده که دارای دو متغیر هستند خوب هستند (اگر فقط یک متغیر دارید، نمودار خطی را در نظر بگیرید).
شما باید حداقل دو سری داده ارائه دهید: سری داده اول مختصات x را مشخص می کند و سری داده دوم مختصات y را مشخص می کند.
شما می توانید به صورت اختیاری یک سری سوم برای تعیین اندازه نقطه های جداگانه ارائه دهید. بدون این سری، تمام نقاط به طور پیش فرض به 10 پیکسل در عرض.
توجه داشته باشید که اگر از chm برای تغییر شکل یا رنگ نقاط داده استفاده می کنید، نقاط نسبت به اندازه ارائه شده در chm مقیاس بندی می شوند.
انواع نمودار ( cht )
یک نمودار پراکنده را با این نحو مشخص کنید:
نحو
cht=s
chd=<x_values>|<y_values>[|<optional_point_sizes>]
| شرح | مثال |
|---|---|
نشانگر پیش فرض نقاط داده یک دایره آبی است. برای استفاده از رنگ یا شکل متفاوت، نشانگرهای شکل را با استفاده از پارامتر این نمودار اندازه نقطه را با گنجاندن سری سوم داده تغییر می دهد. |
|
اگر میخواهید چندین سری را با استفاده از رنگها شبیهسازی کنید، از پارامتر این نمودار دارای سه سری داده است: اولی مقادیر x، دومی مقادیر y مربوطه و سومی اندازه نقطه مربوطه است. مقدار افسانه با استفاده از پارامتر |  chd=t: |
برای تغییر شکل نقاط، از نشانگرهای شکل استفاده کنید. نشانگرهای شکل بسته به ترتیب آنها در پارامتر
نکات بیشتر در مورد استفاده از نشانگرهای شکل:
|  chm=d,FF0000,0,-1,15شکل پیش فرض را روی الماس (d) قرار دهید  chm=پیش فرض الماس ( d ) است، شاخص نشانگر 15 و بعد از آن مربع ( s ) روی الماس ها پوشانده شده است.  chd=t: |
همچنین می توانید یک نشانگر خط (
|  chd=t: |
در اینجا نحوه ایجاد یک خط ردیابی از طریق نقاط خود بدون تکیه بر نقاط قابل مشاهده است:
نمودارهای پراکنده نمی توانند به عنوان نمودارهای ترکیبی استفاده شوند، بنابراین نمی توانید یک سری اضافی برای توصیف خط خود اضافه کنید. با استفاده از این روش نمی توانید خط چین را مشخص کنید، اما می توانید رنگ و ضخامت خط را مشخص کنید. | خط ردیابی با نقاط پنهان:chd=t: |


سری رنگ ها chco
رنگ نقاط را با استفاده از پارامتر chco مشخص کنید. شما می توانید یک رنگ برای همه نقاط، یک گرادیان یا رنگ برای نقاط جداگانه مشخص کنید.
نحو
chco=<single_color>
  or
chco=<point_1_color>|...|<point_n_color>
  or
chco=<gradient_start>,...,<gradient_end> (only with third data series)
- < رنگ >
- رنگ نقاط، در قالب هگزادسیمال RRGGBB . چند فرمت مختلف وجود دارد:
- یک رنگ را مشخص کنید تا در تمام نقاط اعمال شود.
- برای اعمال رنگهای مجزا به نقاط منفرد، یک رنگ در هر نقطه را با جداکننده لوله مشخص کنید.
- اگر رنگهای نقطهای را مشخص کنید، اما رنگهای کمتری نسبت به نقطهها داشته باشید، به هر n نقطه، n ام رنگ مربوطه داده میشود. این راهی برای ایجاد نمودار پراکنده سری چندگانه است.
- برای اعمال یک گرادیان رنگ، باید یک سری داده سوم (که اندازه نقاط را تعیین می کند) اضافه کنید. شامل دو یا چند رنگ که با کاما از هم جدا شده اند تا بسته به اندازه نقطه، شیب رنگی روی نقاط اعمال شود.
ویژگی های استاندارد
بقیه ویژگی های این صفحه ویژگی های نمودار استاندارد هستند.
عنوان نمودار chtt , chts [ همه نمودارها ]
می توانید متن عنوان، رنگ و اندازه قلم را برای نمودار خود مشخص کنید.
نحو
chtt=<chart_title>
chts=<color>,<font_size>,<opt_alignment>
chtt - عنوان نمودار را مشخص می کند.
- < چارت_عنوان >
- عنوانی که باید برای نمودار نشان داده شود. شما نمی توانید مشخص کنید که کجا ظاهر شود، اما می توانید به صورت اختیاری اندازه و رنگ فونت را مشخص کنید. برای نشان دادن فاصله ها از علامت + و برای نشان دادن شکستگی ها از کاراکتر لوله (
|) استفاده کنید.
chts [ اختیاری ] - رنگ ها و اندازه قلم برای پارامتر chtt .
- <رنگ >
- رنگ عنوان، در قالب هگزادسیمال RRGGBB . رنگ پیش فرض مشکی است.
- <font_size >
- اندازه قلم عنوان، بر حسب امتیاز.
- < opt_alignment >
- [ اختیاری ] تراز عنوان. یکی از مقادیر رشته حساس به حروف بزرگ زیر را انتخاب کنید: "l" (چپ)، "c" (مرکز) "r" (راست). پیش فرض "c" است.
مثال ها
| شرح | مثال |
|---|---|
نموداری با عنوان، با استفاده از رنگ و اندازه فونت پیشفرض. یک فاصله با علامت مثبت ( از یک کاراکتر لوله ( |  chtt=Site+visitors+by+month| |
نموداری با عنوان آبی، تراز راست، 20 نقطهای. |  chtt=Site+visitors |
متن و سبک افسانه نمودار chdl , chdlp , chdls [ همه نمودارها ]
افسانه یک بخش جانبی از نمودار است که شرح متنی کوچکی از هر سری ارائه می دهد. می توانید متن مربوط به هر سری را در این افسانه مشخص کنید و مشخص کنید که در کجای نمودار باید ظاهر شود.
همچنین chma مراجعه کنید تا یاد بگیرید که چگونه حاشیه ها را در اطراف افسانه خود تنظیم کنید.
نکته ای در مورد مقادیر رشته: فقط کاراکترهای ایمن URL در رشته های برچسب مجاز هستند. برای ایمن بودن، باید رشتههای حاوی نویسههایی را که در مجموعه کاراکتر 0-9a-zA-Z نیستند، URL-encode کنید. میتوانید یک رمزگذار URL را در اسناد تجسم Google بیابید.
نحو
chdl=<data_series_1_label>|...|<data_series_n_label>
chdlp=<opt_position>|<opt_label_order>
chdls=<color>,<size>
chdl - متن هر سری، برای نمایش در افسانه.
- < data_series_label >
- متن برای ورودی های افسانه. هر برچسب برای سری مربوطه در آرایه
chdاعمال می شود. از علامت + برای فاصله استفاده کنید. اگر این پارامتر را مشخص نکنید، نمودار یک افسانه دریافت نمی کند. هیچ راهی برای تعیین شکست خط در یک برچسب وجود ندارد. افسانه معمولاً برای نگه داشتن متن افسانه شما گسترش می یابد و ناحیه نمودار کوچک می شود تا افسانه را در خود جای دهد.
chdlp - [ اختیاری ] موقعیت افسانه و ترتیب ورودی های افسانه. می توانید < position > و/یا < label_order > را مشخص کنید. اگر هر دو را مشخص کردید، آنها را با یک کاراکتر نوار جدا کنید. اگر میخواهید ورودیهای افسانه خالی در chdl در افسانه حذف شوند، میتوانید یک 's' به هر مقدار اضافه کنید. مثالها: chdlp=bv ، chdlp=r ، chdlp=bv|r ، chdlp=bvs|r
- < opt_position >
- [ اختیاری ] موقعیت افسانه را در نمودار مشخص می کند. برای تعیین بالشتک اضافی بین افسانه و ناحیه نمودار یا حاشیه تصویر، از پارامتر
chmaاستفاده کنید. یکی از مقادیر زیر را انتخاب کنید:-
b- افسانه در پایین نمودار، نوشته های افسانه در یک ردیف افقی. -
bv- افسانه در پایین نمودار، ورودی های افسانه در یک ستون عمودی. -
t- افسانه در بالای نمودار، ورودی های افسانه در یک ردیف افقی. -
tv- افسانه در بالای نمودار، ورودی های افسانه در یک ستون عمودی. -
r- [ پیشفرض ] افسانه در سمت راست نمودار، ورودیهای افسانه در یک ستون عمودی. -
l- افسانه در سمت چپ نمودار، ورودی های افسانه در یک ستون عمودی.
-
- < opt_label_order >
- [ اختیاری ] ترتیب نشان داده شدن برچسب ها در افسانه. یکی از مقادیر زیر را انتخاب کنید:
-
l- [ پیشفرض برای افسانههای عمودی ] برچسبها را به ترتیبی که بهchdlداده شده است نمایش دهید. -
r- برچسب ها را به ترتیب معکوس مطابق باchdlنمایش دهید. این در نمودارهای میله ای انباشته برای نشان دادن افسانه مفید است
به همان ترتیبی که میله ها ظاهر می شوند. -
a- [ پیشفرض برای افسانههای افقی ] مرتبسازی خودکار: تقریباً به معنای مرتبسازی بر اساس طول، ابتدا کوتاهترین، همانطور که در بلوکهای 10 پیکسلی اندازهگیری میشود. هنگامی که دو عنصر دارای طول یکسان هستند (به بلوک های 10 پیکسلی تقسیم می شوند)، عنصری که ابتدا لیست شده است ابتدا ظاهر می شود. -
0,1,2...- سفارش لیبل سفارشی. این فهرستی از شاخصهای برچسب مبتنی بر صفر ازchdlاست که با کاما از هم جدا شدهاند.
-
chdls - [ اختیاری ] رنگ و اندازه قلم متن افسانه را مشخص می کند.
- < رنگ >
- رنگ متن افسانه، در قالب هگزادسیمال RRGGBB .
- < اندازه >
- اندازه نقطه متن افسانه.
مثال ها
| شرح | مثال |
|---|---|
دو نمونه از افسانه ها متن افسانه را به همان ترتیب سری داده های خود مشخص کنید. |
chdl=NASDAQ|FTSE100|DOW
chdl=First|Second|Third |
نمودار اول ورودیهای افسانه افقی را نشان میدهد ( |
|
| این مثال تغییر اندازه فونت را نشان می دهد. |
|


حاشیه های نمودار chma [ همه نمودارها ]
می توانید اندازه حاشیه های نمودار را بر حسب پیکسل مشخص کنید. حاشیه ها از اندازه نمودار مشخص شده ( chs ) به سمت داخل محاسبه می شوند. افزایش اندازه حاشیه، اندازه کل نمودار را افزایش نمی دهد، بلکه در صورت لزوم، منطقه نمودار را کوچک می کند.
حاشیه ها به طور پیش فرض هر چیزی است که پس از محاسبه اندازه نمودار باقی می ماند. این مقدار پیش فرض بسته به نوع نمودار متفاوت است. حاشیه هایی که شما مشخص می کنید حداقل مقدار هستند. اگر ناحیه نمودار جایی برای حاشیه باقی بگذارد، اندازه حاشیه همان چیزی است که باقی مانده است. شما نمی توانید حاشیه ها را کوچکتر از آنچه برای هر افسانه و برچسب لازم است فشار دهید. در اینجا نموداری وجود دارد که بخش های اصلی یک نمودار را نشان می دهد:
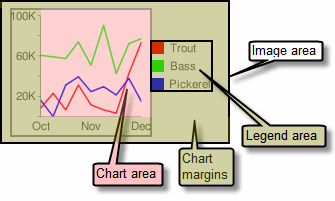 | حاشیه های نمودار شامل برچسب های محور و ناحیه افسانه است. اندازه ناحیه افسانه به طور خودکار تغییر میکند تا دقیقاً با متن مطابقت داشته باشد، مگر اینکه با استفاده از نکته: در نمودار میلهای، اگر میلهها اندازه ثابتی داشته باشند (پیشفرض)، پهنای ناحیه نمودار را نمیتوان کاهش داد. شما باید اندازه نوار کوچکتر یا قابل تغییر اندازه را با استفاده از |
نحو
chma=
  <left_margin>,<right_margin>,<top_margin>,<bottom_margin>|<opt_legend_width>,<opt_legend_height>
- < margin_left >، < right_margin >، < top_margin >، < bottom_margin >
- حداقل اندازه حاشیه در اطراف منطقه نمودار، بر حسب پیکسل. برای جلوگیری از برخورد برچسبهای محور با مرزهای نمودار، این مقدار را افزایش دهید تا مقداری بالشتک اضافه شود.
- < opt_legend_width >، < opt_legend_height >
- [ اختیاری ] عرض حاشیه اطراف افسانه، بر حسب پیکسل. از این برای جلوگیری از برخورد افسانه در ناحیه نمودار یا لبه های تصویر استفاده کنید.
مثال ها
| شرح | مثال |
|---|---|
در این مثال، نمودار دارای حداقل حاشیه 30 پیکسل در هر طرف است. از آنجایی که پهنای افسانه نمودار بیش از 30 پیکسل است، حاشیه سمت راست به عرض نمودار نمودار تنظیم می شود و با حاشیه های دیگر متفاوت است. برچسب های محور خارج از منطقه طرح هستند و بنابراین در فضای حاشیه ترسیم می شوند. |
|
برای اضافه کردن حاشیه در اطراف افسانه، مقداری را برای پارامترهای در این مثال، پهنای افسانه تقریباً 60 پیکسل است. اگر |
|


سبکها و برچسبهای محور [ خط، نوار، Google-o-meter، Radar، Scatter ]
می توانید مشخص کنید که کدام محورها در نمودار نمایش داده شوند و به آنها برچسب ها و موقعیت ها، محدوده ها و سبک های سفارشی بدهید.
همه نمودارها خطوط محور را به طور پیش فرض نشان نمی دهند. با استفاده از پارامتر chxt می توانید دقیقا مشخص کنید که نمودار شما چه محورهایی را نشان دهد. خطوط محور پیش فرض اعداد را نشان نمی دهند. برای نمایش اعداد باید یک محور در پارامتر chxt مشخص کنید.
میتوانید انتخاب کنید که محورهای شما اعدادی را نشان دهند که مقادیر دادهها را منعکس میکنند، یا میتوانید محورهای سفارشی را مشخص کنید. پیشفرض نمایش مقادیر عددی است، با مقادیری که از 0 تا 100 مقیاس شدهاند. با این حال، میتوانید آن محدوده را با استفاده از chxr برای نمایش هر محدوده تغییر دهید، و میتوانید مقادیر (مثلاً برای نشان دادن نمادهای ارز یا اعشار) با استفاده از chxs استایل دهید.
اگر انتخاب می کنید از مقادیر سفارشی استفاده کنید، به عنوان مثال: "Mon, Tues, Wed"، می توانید از پارامتر chxl استفاده کنید. برای قرار دادن این برچسب ها در مکان های خاص در امتداد محور، از پارامتر chxp استفاده کنید.
در نهایت، میتوانید از پارامترهای chxs و chxtc برای تعیین رنگ، اندازه، تراز و سایر ویژگیهای برچسبهای محور سفارشی و عددی استفاده کنید.
نکته ای در مورد مقادیر رشته: فقط کاراکترهای ایمن URL در رشته های برچسب مجاز هستند. برای ایمن بودن، باید رشتههای حاوی نویسههایی را که در مجموعه کاراکتر 0-9a-zA-Z نیستند، URL-encode کنید. میتوانید یک رمزگذار URL را در اسناد تجسم Google بیابید.
این بخش موضوعات زیر را پوشش می دهد:
- محورهای قابل مشاهده (
chxt) - کدام محورها نمایش داده شوند. - محدوده محور (
chxr) - محدوده مقدار برای هر محور. - برچسب های محور سفارشی (
chxl) - مقادیر سفارشی برای نمایش روی محور. - موقعیت های برچسب محور (
chxp) - قرار دادن برچسب های سفارشی در امتداد هر محور. - سبکهای برچسب محور (
chxs) - رنگ، اندازه، تراز و قالببندی برچسبهای محور. - سبک های علامت تیک محور (
chxtc) - طول علامت های تیک برای یک محور خاص.
محورهای قابل مشاهده chxt
نمودارهای میله ای، خطی، رادار و پراکنده به طور پیش فرض یک یا دو خط محور را نشان می دهند، اما این خطوط شامل مقادیر نمی شوند. برای نمایش مقادیر در خطوط محور خود، یا برای تغییر اینکه کدام محور نشان داده می شود، باید از پارامتر chxt استفاده کنید. بهطور پیشفرض، مقادیر محورها از 0 تا 100 متغیر است، مگر اینکه آنها را بهصراحت با استفاده از ویژگی chxr مقیاس کنید. برای پنهان کردن تمام خطوط محور در نمودار خطی، :nda بعد از مقدار نوع نمودار در پارامتر cht مشخص کنید (مثال: cht= lc:nda ).
به طور پیشفرض، محورهای بالا و پایین علامتهای تیک را با مقادیر نشان نمیدهند، در حالی که محورهای چپ و راست آنها را نشان میدهند. می توانید این رفتار را با استفاده از پارامتر chxs تغییر دهید.
نحو
chxt=
  <axis_1>
    ,...,
  <axis_n>
- < محور >
- محوری برای نشان دادن در نمودار. محورهای موجود عبارتند از:
-
x- محور x پایین -
t- محور x بالا [ توسط Google-o-Meter پشتیبانی نمیشود ] -
y- محور y چپ -
r- محور y راست [ توسط Google-o-Meter پشتیبانی نمیشود ]
-
می توانید چندین محور از یک نوع را مشخص کنید، به عنوان مثال: cht=x,x,y . با این کار دو مجموعه از محورهای x در امتداد پایین نمودار قرار می گیرند. این هنگام افزودن برچسب های سفارشی در امتداد محوری که مقادیر عددی را نشان می دهد مفید است (به مثال زیر مراجعه کنید). محورها از داخل به بیرون کشیده می شوند، بنابراین اگر x,x دارید، x اول به درونی ترین کپی، x بعدی به کپی رو به بیرون بعدی اشاره دارد و غیره.
مثال ها
| شرح | مثال |
|---|---|
این مثال نمودار خطی را با محور x، محور y، محور بالا (t) و محور راست (r) نشان میدهد. از آنجایی که هیچ برچسبی مشخص نشده است، نمودار به طور پیش فرض محدوده 0 تا 100 را برای همه محورها تعیین می کند. توجه داشته باشید که بهطور پیشفرض، محورهای بالا و پایین علامتهای تیک را روی برچسبها نشان نمیدهند. |
|
میتوانید چندین مجموعه از برچسبها را برای هر محور با اضافه کردن یک مقدار بیش از یک بار اضافه کنید. این مثال دو مجموعه x و دو مجموعه محور y را نشان می دهد. این به ویژه هنگام استفاده از برچسب های محور پیش فرض، همانطور که در اینجا نشان داده شده است، مفید نیست. اما با استفاده از پارامتر chxl میتوانید برچسبهای سفارشی را برای هر کپی از هر محور مشخص کنید. |
|
این مثال نمودار میلهای افقی را با محور x، محور y، محور t بالا و محور راست نشان میدهد. برچسبهای محور حذف شدهاند، بنابراین نمودار API محدوده 0 تا 100 را برای محور x و برای محور t نمایش میدهد. محدوده برای محور y و برای محور r با تعداد میله ها تعیین می شود. در این مورد، پنج نوار وجود دارد، بنابراین Chart API محدوده 0 تا 4 را نمایش می دهد. برچسب اول در مرکز میله اول، برچسب دوم در مرکز پایه نوار دوم و غیره قرار دارد. . |
|
می توانید محورهای پیش فرض را در نمودار خطی با تعیین :nda بعد از نوع نمودار سرکوب کنید. |  cht=lc:nda |

 chxt=x,x,y,y
  chxt=x,x,y,y
محدوده محوری chxr
با استفاده از پارامتر chxr می توانید محدوده مقادیری را که در هر محور به طور مستقل ظاهر می شوند مشخص کنید. توجه داشته باشید که این کار مقیاس عناصر نمودار را تغییر نمی دهد، فقط مقیاس برچسب های محور را تغییر می دهد. اگر میخواهید اعداد محورها مقادیر واقعی دادهها را توصیف کنند، < start_val > و < end_val > را به ترتیب روی مقادیر پایینتر و بالای محدوده قالب دادهتان تنظیم کنید. برای اطلاعات بیشتر به Axis Scaling مراجعه کنید.
اگر می خواهید محدوده آن را مشخص کنید، باید با استفاده از پارامتر chxt یک محور را قابل مشاهده کنید.
برای تعیین مقادیر محور سفارشی، از پارامتر chxl استفاده کنید.
نحو
محدوده های برچسب چند محور را با استفاده از کاراکتر لوله ( | ) جدا کنید.
chxr=
  <axis_index>,<start_val>,<end_val>,<opt_step>
    |...|
  <axis_index>,<start_val>,<end_val>,<opt_step>
- <axis_index >
- برچسب ها را روی کدام محور اعمال کنیم. این یک شاخص مبتنی بر صفر در آرایه محوری است که توسط
chxtمشخص شده است. به عنوان مثال، محور r درchxt=x,r,y1 خواهد بود. - < start_val >
- عددی که مقدار کم را برای این محور تعریف می کند.
- < end_val >
- عددی که مقدار بالایی را برای این محور تعیین می کند.
- < opt_step >
- [ اختیاری ] مرحله شمارش بین تیک ها روی محور. هیچ مقدار مرحله پیش فرض وجود ندارد. این مرحله برای نشان دادن مجموعه ای از برچسب ها با فاصله خوب محاسبه می شود.
مثال ها
| شرح | مثال |
|---|---|
این مثال محورهای y چپ و راست ( هر محور یک محدوده تعریف شده دارد. از آنجایی که هیچ برچسب یا موقعیتی مشخص نشده است، مقادیر از محدوده داده شده گرفته می شوند و به طور مساوی در آن محدوده قرار می گیرند. در نمودار خطی، مقادیر به طور مساوی در امتداد محور x پخش می شوند. جهت محور برای محور r معکوس می شود (شاخص |
|
در این مثال مقادیری برای محور x مشخص شده است. برچسب های محور به طور مساوی در امتداد محور قرار گرفته اند. مقدار پنج ( |
|


برچسب های محور سفارشی chxl
با استفاده از پارامتر chxl میتوانید برچسبهای محور رشتهای سفارشی را در هر محوری مشخص کنید. می توانید هر تعداد برچسب را که دوست دارید مشخص کنید. اگر یک محور را نمایش دهید (با استفاده از پارامتر chxt ) و برچسب های سفارشی را مشخص نکنید، برچسب های استاندارد و عددی اعمال می شوند. برای تعیین محدوده عددی سفارشی، به جای آن از پارامتر chxr استفاده کنید.
برای تنظیم مکان های خاص در امتداد محور برای برچسب های خود، از پارامتر chxp استفاده کنید.
نحو
برای هر محوری که می خواهید برچسب گذاری کنید یک مجموعه پارامتر مشخص کنید. چندین مجموعه از برچسب ها را با استفاده از کاراکتر لوله ( | ) جدا کنید.
chxl=
  <axis_index>:|<label_1>|...|<label_n>
    |...|
  <axis_index>:|<label_1>|...|<label_n>
- <axis_index >
- برچسب ها را روی کدام محور اعمال کنیم. این یک شاخص در آرایه پارامتر
chxtاست. به عنوان مثال، اگرchxt=x,x,y,yداشته باشید، شاخص 0 اولین محور x و 1 دومین محور x خواهد بود. - <label_1> | ... |< label_n >
- یک یا چند برچسب برای قرار دادن در امتداد این محور. اینها می توانند مقادیر رشته یا عدد باشند. لازم نیست رشته ها در گیومه باشند. label_1 در پایین ترین موقعیت محور و label_n در بالاترین موقعیت نمایش داده می شود. برچسب های اضافی به طور مساوی بین آنها قرار می گیرند. فاصله ها را با علامت + نشان دهید. هیچ راهی برای تعیین شکست خط در یک برچسب وجود ندارد. برچسب ها را با یک کاراکتر لوله جدا کنید. نکته: از قرار دادن لوله بعد از برچسب نهایی در پارامتر
chxlخودداری کنید.
مثال ها
| شرح | مثال |
|---|---|
این نمودار نحوه افزودن برچسب های سفارشی را به دو محور نشان می دهد. توجه داشته باشید که چگونه مقادیر به طور مساوی فاصله دارند، و چگونه آخرین مقدار |  chxt=x,y |
این مثال شامل برچسب های محور در محورهای y چپ و راست ( |
|
این مثال شامل برچسب های محور در محورهای y چپ و راست ( این مثال از مقادیر پیش فرض برای برچسب های محور در سمت چپ محور y استفاده می کند. |
|
اگر میخواهید یک برچسب عمومی برای توصیف یک محور کامل اضافه کنید (مثلاً برای برچسب زدن یک محور "هزینه" و دیگری "دانشجو")، از ویژگی |  chxt=x,x,y,y |


موقعیتهای برچسب محور chxp
میتوانید تعیین کنید که کدام محورها نشان داده شوند، چه از برچسبهای پیشفرض یا برچسبهای سفارشی مشخص شده با استفاده از chxl استفاده کنید. اگر موقعیتهای دقیق را با استفاده از این پارامتر مشخص نکنید، برچسبها به طور مساوی و در یک مقدار گام پیشفرض در امتداد محورها قرار میگیرند. اگر chxl را مشخص نکنید، برچسبهای علامت تیک مقادیر پیشفرض خواهند بود (معمولاً مقادیر دادهها یا اعداد میلهای در نمودارهای میلهای).
نحو
چندین مجموعه موقعیت یابی را با استفاده از کاراکتر لوله ( | ) جدا کنید.
chxp=
  <axis_1_index>,<label_1_position>,...,<label_n_position>
    |...|
  <axis_m_index>,<label_1_position>,...,<label_n_position>
- <axis_index >
- محوری که برای آن موقعیت ها را مشخص می کنید. این یک شاخص در آرایه پارامتر
chxtاست. به عنوان مثال، اگرchxt=x,x,y,yدارید، شاخص 0 اولین محور x، 1 دومین محور x و غیره خواهد بود. - < label_1_position >،...،< label_n_position >
- موقعیت برچسب در امتداد محور. این یک لیست از مقادیر عددی جدا شده با کاما است، که در آن هر مقدار موقعیت برچسب مربوطه را در آرایه
chxlتعیین می کند: اولین ورودی برای اولین برچسب اعمال می شود و غیره. موقعیت یک مقدار در محدوده آن محور است. توجه داشته باشید که این مقدار همیشه 0 تا 100 خواهد بود مگر اینکه یک محدوده سفارشی را با استفاده ازchxrمشخص کرده باشید. شما باید به تعداد برچسب هایی که برای آن محور دارید موقعیت داشته باشید.
مثال ها
| شرح | مثال |
|---|---|
این مثال شامل برچسب های محور r در موقعیت های مشخص شده در نمودار است. متن برچسب با استفاده از پارامتر برچسب هایی با موقعیت مشخص برچسب هایی با موقعیت مشخص | |
این مثال نشان می دهد که مقادیر برچسب پیش فرض را نشان می دهد، اما فقط در مکان های مشخص شده. | chxt=x,y chxt=x,ychxp مشخص نشده است |


Axis Label Styles chxs
می توانید اندازه، رنگ و تراز قلم را برای برچسب های محور، هم برچسب های سفارشی و هم مقادیر برچسب پیش فرض تعیین کنید. همه برچسب ها در یک محور دارای قالب یکسانی هستند. اگر چندین نسخه از یک محور دارید، میتوانید هر کدام را بهطور متفاوتی قالببندی کنید. همچنین می توانید قالب یک رشته برچسب را مشخص کنید، به عنوان مثال برای نشان دادن نمادهای ارز یا صفرهای انتهایی.
به طور پیشفرض، محورهای بالا و پایین علامتهای تیک را با مقادیر نشان نمیدهند، در حالی که محورهای چپ و راست آنها را نشان میدهند.
نحو
مقادیر برای چندین محور باید با استفاده از یک کاراکتر لوله ( | ) از هم جدا شوند.
chxs=
 <axis_index><opt_format_string>,<opt_label_color>,<opt_font_size>,<opt_alignment>,<opt_axis_or_tick>,<opt_tick_color>,<opt_axis_color>
   |...|
 <axis_index><opt_format_string>,<opt_label_color>,<opt_font_size>,<opt_alignment>,<opt_axis_or_tick>,<opt_tick_color>,<opt_axis_color>
- < axis_index >
- محوری که این امر در مورد آن صدق می کند. این یک شاخص مبتنی بر صفر در پارامتر
chxtاست. - < opt_format_string >
- [ اختیاری ] این یک رشته فرمت اختیاری است که در صورت استفاده، بلافاصله پس از شماره شاخص محور بدون کاما می آید. با یک حرف N به معنای واقعی کلمه شروع می شود و مقادیر زیر را به دنبال دارد که همه اختیاری هستند:
N< preceding_text >*< number_type >< decimal_places >zs< x or y >*< following_text >
در اینجا معنای هر عنصر وجود دارد:-
<preceding_text>- متن تحت اللفظی برای قبل از هر مقدار. -
*...*- بلوک اختیاری پیچیده شده در ستاره های تحت اللفظی، که در آن می توانید جزئیات قالب بندی اعداد را مشخص کنید. مقادیر زیر پشتیبانی می شوند و همه اختیاری هستند:-
<number_type>- قالب عددی، برای مقادیر عددی. یکی از موارد زیر را انتخاب کنید:-
f- [ پیشفرض ] قالب نقطه شناور. همچنین دقت را با مقدار < decimal_places > مشخص کنید. -
p- فرمت درصد. علامت % به طور خودکار اضافه می شود. توجه: هنگام استفاده از این فرمت، مقادیر داده از 0.0 - 1.0 نقشه تا 0 - 100٪ (به عنوان مثال، 0.43 به عنوان 43٪ نشان داده می شود). -
e- قالب نمادگذاری علمی. -
c< CUR >- شماره را با ارز مشخص شده با نشانگر ارز مناسب فرمت کنید.< CUR >با یک کد ارز سه حرفی جایگزین کنید. مثال:cEURبرای یورو. شما می توانید لیستی از کدها را در وب سایت ISO پیدا کنید، اگرچه همه نمادها پشتیبانی نمی شوند.
-
-
<decimal_places>- یک عدد صحیح که مشخص می کند چند رقم اعشار باید نشان داده شود. مقدار به این طول گرد (نه کوتاه شده) است. پیش فرض 2 است. -
z- نمایش صفرهای دنباله دار. پیش فرض خیر است . -
s- نمایش جداکننده های گروه. پیش فرض خیر است . -
xیاy-دادهها را از مختصات x یا y نمایش دهید، همانطور که مشخص شده است. معنای دادههای x بر اساس نوع نمودار متفاوت است: نمودار خود را آزمایش کنید تا معنی آن را تعیین کنید. پیش فرض 'y' است .
-
-
< following_text >- متن تحت اللفظی برای دنبال کردن هر مقدار.
-
- < opt_label_color >
- رنگی که باید روی متن محور اعمال شود (اما نه خط محور)، در قالب هگزا دسیمال RRGGBB . رنگ خط محور به طور جداگانه با استفاده از opt_axis_color مشخص می شود. پیش فرض خاکستری است.
- < opt_font_size >
- [ اختیاری ] اندازه فونت را بر حسب پیکسل مشخص می کند. این پارامتر اختیاری است.
- < opt_alignment >
- [ اختیاری ] تراز برچسب. برای محورهای بالا یا پایین، این توضیح می دهد که چگونه برچسب با علامت تیک در بالا یا پایین آن تراز می شود. برای محورهای چپ یا راست، این توضیح می دهد که چگونه در داخل جعبه مرزی خود که محور را لمس می کند، تراز می شود. یکی از اعداد زیر را مشخص کنید:
-
-1- بالا یا پایین : برچسب ها در سمت راست کنه ها قرار دارند. چپ یا راست : برچسب ها در ناحیه خود تراز چپ هستند. پیشفرض برای برچسبهای محور r. -
0- بالا یا پایین : برچسب ها روی کنه ها متمرکز می شوند. چپ یا راست : برچسب ها در مرکز منطقه خود قرار دارند. پیشفرض برای برچسبهای محور x و t. -
1- بالا یا پایین : برچسب ها در سمت چپ کنه ها قرار دارند. چپ یا راست : برچسبها در ناحیه خود به سمت راست تراز میشوند. پیشفرض برای برچسبهای محور y.
-
- < opt_axis_or_tick >
- [ اختیاری در Google-o-meter پشتیبانی نمیشود ] آیا علامتهای تیک و/یا خطوط محور برای این محور نشان داده شود. علامتهای تیک و خطوط محور فقط برای داخلیترین محورها در دسترس هستند (مثلاً برای بیرونی دو محور x پشتیبانی نمیشوند). از یکی از مقادیر زیر استفاده کنید:
-
l(حروف کوچک "L") - فقط خط محور را رسم کنید. -
t- فقط علامت های تیک را بکشید. علامتهای تیک، خطوط کوچک کنار برچسبهای محور هستند. -
lt- [ پیشفرض ] هم یک خط محور بکشید و هم علامتهایی را برای همه برچسبها علامت بزنید. -
_- (زیر خط) نه خط محور و نه علامت تیک بکشید. اگر می خواهید یک خط محور را پنهان کنید، از این مقدار استفاده کنید.
-
- < tick_color >
- [ اختیاری ; در Google-o-meter پشتیبانی نمی شود ] رنگ علامت تیک، در قالب هگزا دسیمال RRGBBB . پیش فرض خاکستری است.
- < opt_axis_color >
- [ اختیاری ] رنگ این خط محور، در قالب RRGGBB هگزادسیمال . پیش فرض خاکستری است.
مثال ها
| شرح | مثال |
|---|---|
Font size and color are specified for the second x-axis (Jan, Feb, Mar). |
|
Font size, color, and alignment are specified for the right y-axis. Tick marks, but no axis line, are drawn. |
|
This chart includes three data sets, and shows three sets of axis labels, one per series. Each set of labels is formatted using a custom formatting string, as described here:
The axis label ranges are set using the |  chd=s: |


Axis Tick Mark Styles chxtc
You can specify long tick marks for specific axes. Typically this is used to extend a tick mark across the length of a chart. Use the chxs parameter to change the tick mark color.
Values for multiple axes should be separated using a pipe character ( | ). Values within a series should be separated by a comma.
نحو
chxtc=
  <axis_index_1>,<tick_length_1>,...,<tick_length_n>
    |...|
<axis_index_m>,<tick_length_1>,...,<tick_length_n>- < axis_index >
- The axis to which this applies. This is a zero-based index into the
chxtparameter. Separate values for different axes using a bar delimiter. - < tick_length_1 >,...,< tick_length_n >
- Length of the tick marks on that axis, in pixels. If a single value is given, it will apply to all values; if more than one value is given, the axis tick marks will cycle through the list of values for that axis. Positive values are drawn outside the chart area and cropped by the chart borders. The maximum positive value is 25. Negative values are drawn inside the chart area and cropped by the chart area borders.
مثال ها
| شرح | مثال |
|---|---|
Example of using
|
|
This chart demonstrates alternating tick lengths. chxtc specifies two tick length values for the y-axis (5 and 15), and the ticks drawn on the chart alternate between the two values. |  chxt=x,y |

Background Fills chf [ All charts ]
You can specify fill colors and styles for the chart data area and/or the whole chart background. Fill types include solid fills, striped fills, and gradients. You can specify different fills for different areas (for example, the whole chart area, or just the data area). The chart area fill overwrites the background fill. All fills are specified using the chf parameter, and you can mix different fill types (solids, stripes, gradients) in the same chart by separating values with pipe character ( | ). Chart area fills overwrite chart background fills.
Solid Fills chf [ All Charts ]
You can specify a solid fill for the background and/or chart area, or assign a transparency value to the whole chart. You can specify multiple fills using the pipe character ( | ). (Maps: background only).
نحو
chf=<fill_type>,s,<color>|...
- < fill_type >
- The part of the chart being filled. Specify one of the following values:
-
bg- Background fill -
c- Chart area fill. Not supported for map charts. -
a- Make the whole chart (including backgrounds) transparent. The first six digits of< color >are ignored, and only the last two (the transparency value) are applied to the whole chart and all fills. -
b <index>- Bar solid fills (bar charts only). Replace < index > with the series index of the bars to fill with a solid color. The effect is similar to specifyingchcoin a bar chart. See Bar Chart Series Colors for an example.
-
- س
- Indicates a solid or transparency fill.
- < color >
- The fill color, in RRGGBB hexadecimal format . For transparencies, the first six digits are ignored, but must be included anyway.
مثال ها
| شرح | مثال |
|---|---|
This example fills the chart background with pale gray ( |
|
This example fills the chart background with pale gray ( |
|
| This example applies a 50% transparency to the whole chart (80 in hexadecimal is 128, or about 50% transparency). Notice the table cell background showing through the chart. |
|


Gradient Fills chf [ Line, Bar, Google-o-meter, Radar, Scatter,Venn ]
میتوانید یک یا چند پرکننده گرادیان را برای مناطق یا پسزمینه نمودار اعمال کنید. Gradient fills are fades from a one color to another color. (Pie, Google-o-meter charts: background only.)
Each gradient fill specifies an angle, and then two or more colors anchored to a specified location. The color varies as it moves from one anchor to another. You must have at least two colors with different < color_centerpoint > values, so that one can fade into the other. Each additional gradient is specified by a < color >,< color_centerpoint > pair.
نحو
chf=<fill_type>,lg,<angle>,<color_1>,<color_centerpoint_1>
    ,...,
  <color_n>,<color_centerpoint_n>
- < fill_type >
- The chart area to fill. یکی از موارد زیر:
-
bg- Background fill -
c- Chart area fill. -
b <index>- Bar gradient fills (bar charts only). Replace < index > with the series index of the bars to fill with a gradient. See Bar Chart Series Colors for an example.
-
- lg
- Specifies a gradient fill.
- < angle >
- A number specifying the angle of the gradient from 0 (horizontal) to 90 (vertical).
- < color >
- The color of the fill, in RRGGBB hexadecimal format .
- < color_centerpoint >
- Specifies the anchor point for the color. The color will start to fade from this point as it approaches another anchor. The value range is from 0.0 (bottom or left edge) to 1.0 (top or right edge), tilted at the angle specified by < angle >.
مثال ها
| شرح | مثال |
|---|---|
Chart area has a horizontal linear gradient, specified with an angle of zero degrees ( The colors are peach ( The chart background is drawn in gray ( |
|
Chart area has a diagonal (bottom left to top right) linear gradient, specified with an angle of forty-five degrees ( Peach ( Blue ( The chart background is drawn in gray ( |
|
Chart area has a vertical (top to bottom) linear gradient, specified with an angle of ninety degrees ( Blue ( Peach ( The chart background is drawn in gray ( |
|


Striped fills chf [ Line, Bar, Google-o-meter, Radar, Scatter, Venn ]
You can specify a striped background fill for your chart area, or the whole chart. (Pie, Google-o-meter charts: background only.)
نحو
chf=
  <fill_type>,ls,<angle>,<color_1>,<width_1>
    ,...,
  <color_n>,<width_n>
- < fill_type >
- The chart area to fill. یکی از موارد زیر:
-
bg- Background fill -
c- Chart area fill -
b <index>- Bar striped fills (bar charts only). Replace < index > with the series index of the bars to fill with stripes. See Bar Chart Series Colors for an example.
-
- ls
- Specifies linear stripe fill.
- < angle >
- The angle of all stripes, relative to the y-axis. Use
0for vertical stripes or90for horizontal stripes. - < color >
- The color for this stripe, in RRGGBB hexadecimal format . Repeat < color > and < width > for each additional stripe. You must have at least two stripes. Stripes alternate until the chart is filled.
- < width >
- The width of this stripe, from
0to1, where1is the full width of the chart. Stripes are repeated until the chart is filled. Repeat < color > and < width > for each additional stripe. You must have at least two stripes. Stripes alternate until the chart is filled.
مثال ها
| شرح | مثال |
|---|---|
|  chf= |
|  chf= |
Grid Lines chg [ Line, Bar, Radar, Scatter ]
You can specify solid or dotted grid lines on your chart using the chg parameter.
This parameter doesn't let you specify the thickness or color of the lines. For more ways to make lines across your chart, see shape markers ( chm type h, H, v, or V), range markers ( chm ), and axis tick marks ( chxtc ).
نحو
chg=
  <x_axis_step_size>,<y_axis_step_size>,<opt_dash_length>,<opt_space_length>,<opt_x_offset>,<opt_y_offset>
- < x_axis_step_size >, < y_axis_step_size >
- Used to calculate how many x or y grid lines to show on the chart. 100 / step_size = how many grid lines on the chart. So: 20,25 would mean 5 vertical grid lines and 4 horizontal grid lines.
- < opt_dash_length >, < opt_space_length >
- [ Optional ] Used to define dashed grid lines. The first parameter is the length of each line dash, in pixels. The second parameter is the spacing between dashes, in pixels. Specify 0 for < opt_space_length> for a solid line. Default values are 4,1.
- < opt_x_offset >,< opt_y_offset >
- [ Optional ] The number of units, according to the chart scale, to offset the x and y grid lines, respectively. Can be positive or negative values. If you specify this value, you must also specify all preceding values. Default values are 0,0.
مثال ها
| شرح | مثال |
|---|---|
These examples use only the |  chg=20,50 chg=20,50 |
This example uses larger spaces to display lighter grid lines ( |  |
To display solid grid lines, specify zero ( This chart also specifies an x-axis offset of 10. |  chg=20,50,1,0,10 |
This chart demonstrates an x-axis offset of 10, and ay axis offset of 20. |  chg=20,50,3,3,10,20 |
Dynamic Icon Markers chem [ Bar, Line, Radar, Scatter ]
Create your chart, and specify one or more dynamic icons as chem values. The syntax of chem is as follows. All semicolon-delimited items in purple are optional, and any one can be omitted entirely in your URL. You can include multiple markers by including multiple syntax strings delimited by a | شخصیت. You can read more about dynamic icons on the dynamic icon page .
You can also embed a chart inside another chart as a dynamic icon. See the Embedded Charts subsection below.
chem=
  y;s=<icon_string_constant>;d=<marker_data_string>;ds=<which_series>;dp=<which_points>;py=<opt_z_order>;po=<x,y>;of=<x_offset,y_offset>
   |...|
  y;s=<icon_string_constant>;d=<marker_data_string>;ds=<which_series>;dp=<which_points>;py=<opt_z_order>;po=<x,y>;of=<x_offset,y_offset>
- s=< icon_string_constant >
- A string marker constant for a dynamic icon, from the dynamic icon page . This constant is almost the same as the
chstparameter for freestanding icons. But where the freestanding icon string starts with "d_", you should remove that prefix to get the equivalent dynamic icon marker. Example: freestanding icon:d_bubble_icon_text_small; equivalent dynamic icon marker:bubble_icon_text_small. - d=< marker_data_string >
- The data required for this particular marker type. This holds the same string that would be used in a
chldparameter for an equivalent freestanding icon, except that all | delimiters should be replaced by commas (remember to use commas instead of pipe markers for multiline text!). Note that within the data string, you must also escape the following characters with a @ mark: pipe ( | ) , at ( @ ) , equals ( = ), comma ( , ), semicolon ( ; ). Examples:hello@,+world,5@@10+cents+each. - ds=< which_series >
- [ Optional ] The zero-based index of the data series that this marker belongs to. Default value is 0.
- dp=< which_points >
- [ Optional ] Specifies which data points are used to draw markers. Default value is 0 (first point in the series) . Use one of the following formats:
-
nd- Which data point to draw the marker on, where nd is the zero-based index in the series. If you specify a non-integer value, then the fraction indicates a calculated intermediate point. For example, 3.5 means halfway between point 3 and point 4. -
range,< start >,< end >,< step >- Draw a marker on every step data point in a range from start to end , inclusive. start and end are index values, and can be floating point numbers to indicate intermediate values. All values are optional; defaults are: start=0, end=last item, step=1. If you skip a value, you must still include any intermediate commas, but you don't have to include empty trailing commas. Examples:dp=range,0,4draws a marker on elements 0 through 4;dp=range,5,10,2draws a marker on elements 5, 7, and 9;dp=range,2draws points on the third point and later;dp=range,3,,1.5draws markers on every 1.5 data points from the fourth item to the last. -
all- Draw a marker on every element. This is equivalent torange,0, end_index. Example:dp=all -
every,n- Draw a marker on every n th marker. Example:dp=every,2draws a marker on items 0, 2, and 4.
-
- py=< z_order >
- [ Optional ] The layer on which to draw the marker, compared to other markers and all other chart elements. This is a floating point number from -1.0 to 1.0, inclusive, where -1.0 is the bottom and 1.0 is the top. Chart elements (lines and bars) are just below zero. If two markers have the same value, they are drawn in the order given by the URL. Default value is 0.0 (just above the chart elements).
- po=< x,y >
- [ Optional ] An absolute position on the chart at which to draw the marker. x and y are two floating point numbers, where 0.0,0.0 is the bottom left corner and 1.0,1.0 is the top right corner.
- of=< x_offset,y_offset >
- [ Optional ] A number of pixels to offset the icon from its normal position. x_offset and y_offset are positive or negative integers. It is important to specify this value in an embedded dynamic icon, because the marker will be centered vertically and horizontally over the point, which means that the point probably won't line up with the data marker. A good offset for an upright pin is
of=0,22; a good offset for a slanted pin is eitherof=-12,20orof=12,20depending on the direction of the slant, but you might have to experiment. Default value is 0,0.
مثال ها
| شرح | مثال |
|---|---|
| Here are examples of the same dynamic icon created as a free-standing image, and used as a marker in a line chart. Chart 1: Chart 2: |
|
Note that a dynamic icon marker will be centered on the point horizontally and vertically. So if you use a dynamic icon with a tail, the tail won't be on the chart point; the marker center will be. The first chart centers the mark on data point 3, which actually puts the tail a bit to the right of the mark on the line. The second chart uses the |  chem=y;chem=y; |
To include multiple dynamic icons, repeat the syntax string, delimited by a | شخصیت. This example shows a range, as well as two individual markers. Note how the vertical pins are offset by of 0,22, and the slanted pin has an offset of 12,20 to make the pin points line up with the series that they describe. |  chem= |
This demonstrates a multiline text marker. The marker must be offset after adding the text, because the bubble resizes to fit the text, causing it to be re-centered on the chart. Note how newlines in the text are indicated by commas in the d data string. |  chem=y; |


Embedded Charts
You can embed one chart inside another using the dynamic icon syntax.
There are two styles of embedded chart markers: embedded charts in a bubble, and embedded charts with no bubble. Here are examples of both:
 |  |
Chart with bubble | Chart without bubble |
Here are the specifics of the s=< icon_string_constant >;d=< marker_data_string > parameters, both for non-bubble and bubble-embedded charts (parameters covered above aren't described again here):
نحو
Non-bubble:
  chem=y;s=ec;d=<alignment_string>,<chart_data>;ds=<which_series>;dp=<which_points>;py=<z_order>;po=<x,y>;of=<x_offset,y_offset>

Bubble:
  chem=y;s=ecb;d=<frame_type>,<padding>,<frame_color>,<fill_color>,<chart_data>;ds=<which_series>;dp=<which_points>;py=<z_order>;po=<x,y>;of=<x_offset,y_offset>
- alignment_string
- [ Non-bubble only ] Which part of the bubble-less embedded chart is pinned to the data point. Choose one of the two-letter string constants in the following diagram:
- chart_data
- The data for the embedded chart. This is everything after
https://chart.googleapis.com/chart?in the URL of the chart to embed. Use the tool below, or follow the rules listed below the tool. - frame_type
- [ Bubble only ] One of the dynamic icon frame style constants .
- padding
- [ Bubble only ] Padding inside the bubble, in pixels.
- frame_color
- [ Bubble only ] Color of the frame, as a six-digit HTML color string without the # mark. Example:
FF00FF. - fill_color
- [ Bubble only ] Bubble fill color, as a six-digit HTML color string without the # mark. Example:
FF00FF.
Embedded chart data
Use the following conversion tool to help generate your chart string, or else generate the chart string manually following the rules given after the tool.
Rules for manual conversion
1. First replace all the following characters in the parameter and value pairs with the following values, in the order shown:
| Replace | With this |
|---|---|
%7C or %7c | | |
@ | @@ |
% | %25 |
, | @, |
| | @| |
; | @; |
& | %26 |
= | %3D |
2. Then replace all the & and = values in the parameter1=value1¶meter2=value2... pairs with commas.
Shape Markers chm [ Bar, Line, Radar, Scatter ]
You can specify graphical markers for all or individual data points on a chart. If two or more markers occupy the same point, the markers are drawn in the order in which they appear in the chm parameter. You can also create text markers on data points, which is covered in Data Point Markers .
You can combine shape markers with any other chm parameters using a pipe character ( | ) to separate the chm parameters.
نحو
Specify one set of the following parameters for each series that should be marked. To mark multiple series, create additional parameter sets, delimited by a pipe character. You do not need to mark up all series. If you do not assign markers to a data series, it will not get any markers.
Shape markers behave slightly differently in scatter charts . See that documentation for more information.
chm=
  [@]<marker_type>,<color>,<series_index>,<opt_which_points>,<size>,<opt_z_order>,<opt_offset>
    |...|
  [@]<marker_type>,<color>,<series_index>,<opt_which_points>,<size>,<opt_z_order>,<opt_offset>
- @
- [ Optional ] If you precede the marker type with the optional @ character, then < opt_which_points > should use the x:y format.
- <marker_type>
- The type of marker to use. Specify one of the following types:
-
a- Arrow -
c- Cross -
C- Rectangle. If a rectangle marker, you must have at least two data series, where series 0 specifies the bottom edge and series 1 specifies the top edge. < size > specifies the width of the rectangle, in pixels. -
d- Diamond -
E- Error-bar marker ( ) This marker requires two data series to create, one value for the bottom, and the corresponding point in the second series for the top. It also exposes an extended < size > syntax: line_thickness [: top_and_bottom_width ] where top_and_bottom_width is optional. See the examples below.
 -
h- Horizontal line across the chart at a specified height. ( The only valid format for < opt_which_points > parameter is nd . ) -
H- Horizontal line through the specified data marker. This supports an extended < size > syntax that lets you specify an exact line length: line_thickness [: length ] where : length is optional, and defaults to the full chart area width. -
o- Circle -
s- Square -
v- Vertical line from the x-axis to the data point -
V- Vertical line of adjustable length. This supports an extended < size > value syntax that lets you specify an exact line length: line_thickness [: length ] where : length is optional, and defaults to the full chart area height. The marker is centered on the data point. -
x- An X
-
- < color >
- The color of the markers for this series, in RRGGBB hexadecimal format .
- < series_index >
- The zero-based index of the data series on which to draw the markers. Ignored for
hmarkers and markers that specify location by x/y position (start with the @ character). You can use hidden data series as a source for markers; see Compound Charts for more information. Grouped vertical bar charts support a special extended syntax to align markers with specific bars. - < opt_which_points >
- [ Optional ] Which point(s) to draw markers on. Default is all markers. Use one of the following values:
-
nd- Where to draw the marker. The meaning depends on the marker type:- All types except h - Which data point to draw the marker on, where nd is the zero-based index in the series. If you specify a non-integer value, then the fraction indicates a calculated intermediate point. For example, 3.5 means halfway between point 3 and point 4.
-
h- A number from 0.0 to 1.0, where 0.0 is the bottom of the chart, and 1.0 is the top of the chart.
-
-1- Draw a marker on all data points. You can also leave this parameter empty to draw on all data points. -
- n- Draw a marker on every n -th data point. Floating point value; if n is less than 1 the chart will calculate additional intermediary points for you. For example, -0.5 will put twice as many markers as data points. -
start:end:n- Draw a marker on every n -th data point in a range, from start to end index values, inclusive. All parameters are optional (may be absent), so 3::1 would be from the fourth element to the last, step 1, and omitting this parameter entirely would default to first : last :1. All values can be floating point numbers. start and end can be negative, to count backward from the last value. If both start and end are negative, be sure that they are listed in increasing value (for example, -6:-1:1). If the n step value is less than 1, it will calculate additional data points by interpolating the data values given. Default values are first:last:1 -
x : y- Draw a marker at a specific x/y point on the chart. This point does not have to be on a line. Add the @ character before the marker type to use this option. Specify the coordinates as floating point values, where0:0is the bottom left corner of the chart and1:1is the top right corner of the chart. For example, to add a red, 15-pixel diamond to the center of a chart, use@d,FF0000,0,0.5:0.5,15.
-
- < size >
- The size of the marker, in pixels. Most take a single number value for this parameter; the V, H, and S markers support the syntax < size >[: width ] where the optional second part specifies the line or marker length.
- < opt_z_order >
- [ Optional ] The layer on which to draw the marker, compared to other markers and all other chart elements. This is a floating point number from -1.0 to 1.0, inclusive, where -1.0 is the bottom and 1.0 is the top. Chart elements (lines and bars) are just lower than zero. If two markers have the same value, they are drawn in the order given by the URL. Default value is 0.0 (just above the chart elements).
- < opt_offset >
- [ Optional ] Let you specify horizontal and vertical offsets from the specified location. Here is the syntax, which uses a : delimiter:
reserved :< horizontal_offset >:< vertical_offset >. If specified, you can include an empty ,, value in thechmparameter string for < opt_z_order >. Examples:o,FF9900,0,4,12,, :10 o,FF9900,0,4,12.0,, :-10:20 o,FF9900,0,4,12,1, ::20- reserved - Leave blank.
-
< horizontal_offset >- A positive or negative number specifying the horizontal offset, in pixels. Optional; leave blank if not used. -
< vertical_offset >- A positive or negative number specifying the vertical offset, in pixels. Optional; leave blank if not used.
مثال ها
| شرح | مثال |
|---|---|
Here's an example of several of the shape and line markers.
|  chm= |
Here's an example using diamonds for one data series, and circles for the other data series. If two or more markers occupy the same point, the markers are drawn in the order in which they appear in the |  chm= |
Here's a line chart with a marker on every second data point (-2 means every other point). |  chd=t: |
| Here's a line chart with twice as many markers as data points (-0.5 means every half point). |  chd=t: |
This example shows how to use h and v markers to create grid lines with custom colors and thickness. The z-order value (the last value) is set to -1 so that the grid lines are drawn beneath the data line. |  chm= |
This chart adds vertical fill lines to a line chart:
|  chm= |
| This example adds an arrow and text marker to the chart using exact coordinates. The first D marker is the trace line under the bars. The second marker is the arrow, and the third marker is the arrow text. |  chm= |
A horizontal line fixed to a specific data point ( H ) can be useful for showing relative values, or emphasizing the height of a data value on a chart. |  chm=H,FF0000,0,18,1 |
This graph demonstrates the markers that can specify line thickness and length in the < size > parameter.
| title="cht=lc&chd=s:2gounjqLaCf,jqLaCf2goun&chco=008000,00008033&chls=2.0,4.0,1.0&chs=250x150&chm=H,990066,1,2,5:50%7CV,3399CC,0,8,3:50%7CE,000000,0,6,1:20" src="/chart/image/images/chart_95.png" />chm= |
Text and Data Value Markers chm [ Bar, Line, Radar, Scatter ]
You can label specific points on your chart with custom text, or with formatted versions of the data at that point.
You can combine any chm markers using a pipe character ( | ) to separate the chm parameter sets.
A note on string values: Only URL-safe characters are permitted in label strings. To be safe, you should URL-encode any strings containing characters not in the character set 0-9a-zA-Z . You can find a URL encoder in the Google Visualization Documentation .
نحو
Specify one set of the following parameters for each series that should be marked. To mark multiple series, create additional parameter sets, delimited by a pipe character. You do not need to mark up all series. If you do not assign markers to a data series, it will not get any markers.
chm=
  <marker_type>,<color>,<series_index>,<opt_which_points>,<size>,<opt_z_order>,<opt_placement>
    |...|
  <marker_type>,<color>,<series_index>,<opt_which_points>,<size>,<opt_z_order>,<opt_placement>
- <marker_type>
- The type of marker to use. You can choose from the following types:
-
f<text>- A flag containing text. Specify the character 'f', followed by custom URL-encoded text. To escape commas in text markers, precede the comma by a \ mark. Example:fHello\,+World! -
t<text>- A simple text marker. Specify the character 't' followed by custom URL-encoded text. To escape commas in text markers, precede the comma by a \ mark. Example:tHello\,+World! -
A< text >- An annotation marker. This is similar to a flag marker, but markers will coordinate their position so that they do not overlap. The only valid format for < opt_which_points > is nd , to signify the index of a point in the series. -
N< formatting_string >- The value of the data at this point, with optional formatting. If you do not use thechdsparameter (custom scaling) it gives the exact encoded value; if you do use that parameter with any format type the value will be scaled to the range that you specify. See an example ofchdswith numeric markers below. With this marker type in a stacked bar chart , if you specify -1 for < series_index > you will get a marker that shows the sum of all values in this stacked bar. The formatting string syntax is as follows:
< preceding_text >*< number_type >< decimal_places >zs< x or y >*< following_text >.
All of these elements are optional. Here is the meaning of each element:-
<preceding_text>- Text to precede each value. -
*...*- An optional block wrapped in literal asterisks, in which you can specify formatting details for numbers. The following values are supported, and are all optional:-
<number_type>- The number format, for numeric values. Choose one of the following:-
f- [ Default ] Floating point format. Consider specifying precision as well with the < decimal_places > value. -
p- Percentage format. A % sign is appended automatically. Note: When using this format, data values from 0.0 — 1.0 map to 0 — 100% (for example, 0.43 will be shown as 43%). -
e- Scientific notation format. -
c< CUR >- Format the number in the currency specified, with the appropriate currency marker. Replace< CUR >with a three-letter currency code. Example:cEURfor Euros. You can find a list of codes on the ISO web site , although not all symbols are supported.
-
-
<decimal_places>- An integer specifying how many decimal places to show. The value is rounded (not truncated) to this length. Default is 2. -
z- Display trailing zeros. Default is no . -
s- Display group separators. Default is no . -
xory-Display the data from the x- or y-coordinate, as specified. The meaning of x data varies by chart type: experiment with your chart to determine what it means. Default is 'y' .
-
-
< following_text >- Text to follow each value.
-
-
- < color >
- The color of the markers for this set, in RRGGBB hexadecimal format .
- < series_index >
- The zero-based index of the data series on which to draw the markers. If this is a stacked bar chart and the marker type is N (data point values), you can specify -1 to create a summed value marker for each stack of bars. See below for an example.
- < opt_which_points >
- [ Optional ] Which point(s) to draw markers on. Default is all markers. Use one of the following values:
-
nd- Which data point to draw the marker on, where nd is the zero-based index in the series. If you specify a non-integer value, then the fraction indicates a calculated intermediate point. For example, 3.5 means halfway between point 3 and point 4. -
-1- Draw a marker on all data points. You can also leave this parameter empty to draw on all data points. -
-n- Draw a marker on every n -th data point. -
start : end : n- Draw a marker on every n -th data point in a range, from start to end index values, inclusive. All parameters are optional (may be absent), so 3::1 would be from the fourth element to the last, step 1, and omitting this parameter entirely would default to first : last :1. All values can be floating point numbers. start and end can be negative, to count backward from the last value. If both start and end are negative, be sure that they are listed in increasing value (for example, -6:-1:1). If the n step value is less than 1, it will calculate additional data points by interpolating the data values given. Default values are first:last:1 -
x : y- [ Not supported for N-type markers ] Draw a marker at a specific x/y point on the chart. This point does not have to be on a line. Add the at character (@) before the marker type to use this option. Specify the coordinates as floating point values, where0:0is the bottom left corner of the chart,0.5:0.5is the center of the chart, and1:1is the top right corner of the chart. For example, to add a red, 15-pixel diamond to the center of a chart, use@d,FF0000,0,0.5:0.5,15.
-
- < size >
- The size of the marker in pixels. If this is a scatter chart with a third data series (used to specify point sizes), this value will be scaled by the data range. So if the data range is 0—100 and < size > is 30, a data value of 100 would be 30 pixels wide, a data value of 50 would be 15 pixels wide, and so on.
- < opt_z_order >
- [ Optional ] The layer on which to draw the marker, compared to other markers and all other chart elements. This is a floating point number from -1.0 to 1.0, inclusive, where -1.0 is the bottom and 1.0 is the top. Chart elements (lines and bars) are just lower than zero. If two markers have the same value, they are drawn in the order given by the URL. Default value is 0.0 (just above the chart elements).
- < opt_placement >
- [ Optional ] Additional placement details describing where to put this marker, in relation to the data point. You can specify horizontal and/or vertical relative positioning, as well as offsets. Placement syntax is a string with : delimiters as shown here. All elements are optional:
< horizontal_and_vertical_justification >:< horizontal_offset >:< vertical_offset >. If specified, you can include an empty ,, value in thechmparameter string for < opt_z_order >. Examples:N,000000,0,1,10,,bandN,000000,0,1,10,,lvandN,000000,0,1,10,,r::10.- horizontal_and_vertical_justification
- The anchor point of the marker. This behaves opposite to justification, so a left anchor actually puts the marker to the right of the data point. You can choose a horizontal and/or vertical justifier from the following list:
- Horizontal placement : 'l', 'h', or 'r' - Left, center, or right-anchored, horizontally. Default is 'l'.
- Vertical placement : 'b', 'v', 't' - Bottom, middle, or top-anchored, vertically. Default is 'b'.
- Bar-relative placement [ Bar charts only] : 's', 'c', 'e' - Base, center, or top of a bar. For stacked charts, this is relative to the section of the bar for each series, not for the whole bar. If the series index given is -1 (stack total) it is in relation to the whole bar. This can be combined with vertical placement values: for example, 'be' or 'vs'. Default value is 'e'.
- horizontal_offset
- A horizontal offset for this marker, in pixels. Default is 0.
- vertical_offset
- A vertical offset for this marker, in pixels. Non-bar chart default: 15; bar chart chart default: 2 .
| شرح | مثال | |
|---|---|---|
Here's an example of value labels on a bar chart. The first chart ( The second chart ( |
| |
You can use the This example shows a chart with simple-encoded values of 46, 39, 29, 30, 43, 41. Simple encoding range is 0—61 . The |  chd=s:underp | |
Here's an example of a chart with a text label at the minimum point and a flag label at the maximum point. |
| |
| This example shows a stacked chart with values for individual series, plus the series total. To show the stacked series values, we must use the 'c' positioning option; if we did not, the top bar value would overlap the sum value at the top of each bar. |  chm= | |
| Some more demonstrations of how vertical and horizontal placement work. This example demonstrates various combinations of anchor values for bar charts (which use s, c,and e for vertical placement). Note how a right anchor moves a marker left, and a top anchor moves a marker down, and vice-versa. The red dots show the base, center, and top of each bar. The number is the data value, fixed using different anchor values for each bar. |  chm= | |
Annotation markers automatically adjust the label position so that they don't overlap. The first chm value is for the line fill, the following values are all annotation markers. |  chm=B,C5D4B5BB,0,0,0 | |
| Another annotation marker example demonstrating city altitudes in Switzerland. |  | |


Range Markers chm [ Bar, Candlestick, Line, Radar, Scatter ]
You can color horizontal or vertical bands of background fill to highlight specific areas of a chart.
You can combine any chm markers using a pipe character ( | ) to separate the chm parameter sets.
نحو
Specify one set of the following parameters for each band to draw. To draw multiple bands, create additional parameter sets, delimited by a pipe character. Ranges are drawn in the order specified, so the last range drawn will be drawn on top of previous ranges.
chm=
  <direction>,<color>,0,<start_point>,<end_point>
    |...|
  <direction>,<color>,0,<start_point>,<end_point>
- <direction>
- Specifies horizontal or vertical shading. Use
rfor a horizontal range andRfor a vertical range. - < color >
- The range color as an RRGGBB format hexadecimal number .
- 0
- Reserved — must be zero.
- < start_point >
- The start position of the range.
- For horizontal range markers, this is a position on the y-axis, where
0.00is the bottom of the chart, and1.00is the top of the chart. - For vertical range markers, this is a position on the x-axis, where
0.00is the left of the chart, and1.00is the right of the chart.
- < end_point >
- The end position of the range.
- For horizontal range markers, this is a position on the y-axis, where
0.00is the bottom of the chart, and1.00is the top of the chart. - For vertical range markers, this is a position on the x-axis, where
0.00is the left of the chart, and1.00is the right of the chart.
مثال ها
| شرح | مثال |
|---|---|
Range markers can be a thin line or a band of color.
|  |
This example shows the vertical range markers. The first marker is a red line ( |  |
Markers are drawn in the order specified. In this example, you can see that the vertical red marker was drawn before the pale blue horizontal marker. |  chm= |
Here's an example of a line chart that uses range markers to draw faint horizontal lines across the chart at the zero line, midpoint line, and top. |  |
Line Markers chm=D [ Bar, Candlestick, Line, Radar, Scatter ]
You can add a line that traces data in your chart. Most often, this is used in compound charts .
To add multiple lines (or combine this with any other chm markers), separate the chm parameter sets using a pipe ( | ) delimiter. You cannot make a dashed line marker with this parameter.
نحو
chm=
  D,<color>,<series_index>,<which_points>,<width>,<opt_z_order>
- D
- Indicates that this is a line marker.
- < color >
- The color of the line, in RRGGBB hexadecimal format .
- < series_index >
- The index of the data series used to draw the line. The data series index is
0for the first data series,1for the second data series, and so on. - < which_points >
- Which points in a series to use to draw the line. Use one of the following values:
-
0- Use all the points in the series. -
start:end- Use a specific range of points in the series, from the start to end , inclusive (zero-based index). You can also use floating point values to specify intermediate points, or leave start or end blank to indicate the first or last data point, respectively. start and end can be negative, as a reverse index from the last value. If both start and end are negative, be sure to write them in increasing value (for example, -6:-1).
-
- < size >
- The width of the line in pixels.
- < opt_z_order >
- [ Optional ] The layer on which to draw the marker, compared to other markers and all other chart elements. This is a floating point number from -1.0 to 1.0, inclusive, where -1.0 is the bottom and 1.0 is the top. Chart elements (lines and bars) are just lower than zero. If two markers have the same value, they are drawn in the order given by the URL. Default value is 0.0 (just above the chart elements).
مثال ها
| شرح | مثال |
|---|---|
This is an example of drawing a marker line on a bar chart. The z-order is set to |  chm=D,0033FF,0,0,5,1 |
This is the same bar chart, but with an additional data series just for the line. This is an example of a compound chart. Compound charts are drawn by adding additional data series to the See Compound Charts for more information. |  chm=D,0033FF,1,0,5,1 |
Data Functions chfd [ All chd charts ]
You can specify a custom function to run over chart data using muParser function syntax . The data used in the function can come from one of two sources:
- A data series from
chd- The data is pulled from the specified series inchd. - A range of values declared in the
chfdparameter itself - You declare a start, stop, and step value for an arbitrary data range.
It is important to note that in all cases you must assign the output to an existing series in chd ; that series will be overwritten by the function output. The chart is rendered only after all functions have been processes, so if you assign multiple functions to output to the same data series, the functions will be run in the order given, but only the output of the final function will be plotted on the chart. Note that you can chain functions, so that one function can take as input a series that was output by a previous function.
To assign colors or chm markers to a function line, assign the colors or markers to the function's series index. Note that markers are placed according to the data after it has been manipulated by the function.
نحو
chfd=
  <output_series_index>,<function_data>,<function_string>
    |...|
<output_series_index>,<function_data>,<function_string>- < output_series_index >
- Zero-based index of a data series in
chdto which the function output will be written. Any existing data will be completely overwritten by the function output. If a series is not being used as input for a function, best practice is to assign a single dummy value to that series. - < function_data >
- The variables and data to plot. The data can be from a range that you define, or from one of the
chddata series. You can specify multiple variables for each function, using a ; (semicolon) delimiter for multiple variables. Note that if you define multiple variables for a single function, and these variables have a different number of points, the function will stop when it reaches the first endpoint. For example, if a function defines both x=1—5 step 1 and y=1—10 step 1, the function will end when it reaches the fifth point.
< variable_name >,< input_series_index >OR
< variable_name >,< start >,< end >,< step >- variable_name - An arbitrary string name for the variable. Use this in the function defined by function_string .
- input_series_index - The index of a
chddata series to use as input data. - start - The numeric start value of a range.
- end - The numeric end value of a range.
- step - The numeric step value from start to end . Can be positive or negative, but cannot be zero.
x,0,100,1declares a variable namedxwith values 0, 1, 2, ... 100.x,0,100,1;r,0,3.1,.1declares the samexvariable plus a variable namedrwith values 0, 0.1, 0.2, ..., 3.0, 3.1.x,0declares a variable named x that uses the data from the firstchdseries. These variables will be used by function_string . They will not be plotted on the graph unless you specify them in function_string . The smaller the step, the smoother your graph. - < function_string >
- Your function, written in the muParser syntax . The function is applied to the variables and data specified in variable_data . You can only reference the variables declared in this local function set, not in another piped set of
chfdparameters. Summary muParser functions are not supported (min, max sum, avg). IMPORTANT: Remember to use%2Binstead of+in your functions!
مثال ها
| شرح | مثال |
|---|---|
A simple sine wave. Some things to notice:
| *50%2b50&chxt=x,y") cht=lc |
This line uses data from the chd parameter. |  chd=t:5,10 |
A mix of function and non-function lines. Notice how the colors are specified by the series color parameter Notice the placement of markers on the function output; the data points are calculated from start , end , and step , so if your range is 0—11 step 0.1, point 0 is 0, point 1 is 0.1 and so on, until point 110, which has a value of 11. | *50%2B50&chxt=x,y&chm=c,00A5C6,0,110,10|a,00A5C6,0,60,10") chd=t: |
To define a function in two dimensions, use an
| *50%2B50|1,y,0,10,0.1,cos(y)*50%2B50") cht=lxy |
The Try clicking these images to open and play with them in the chart playground; you'll get hooked! | |


*(exp(cos(t))-2.0*cos(4.0*t)-sin(t/12.0)^5)*20|1,t,0,100,.05,cos(t)*(exp(cos(t))-2.0*cos(4.0*t)-sin(t/12.0)^5.0)*20-10&chf=c,lg,90,FFE7C6,0,76A4FB,1|bg,s,EFEFEF&chxt=x,y&chxs=0,000000,0,0,_|1,000000,0,0,_")
*50%2b50|1,y,0,360,.1,cos(y)*50%2b50&chco=FFFF10&chf=bg,lg,90,000000,0,FFFFFF,.5,000000,1")
*40%2b50|1,y,0,180,1.4,cos(3*y)*40%2b50")
*40%2b50|1,y,0,360,1.9,cos(6*y)*40%2b50&chf=c,lg,90,FFFF00,0,FF9933,1&chco=006699")