
এই নথিটি বর্ণনা করে কিভাবে চার্ট API ব্যবহার করে স্ক্যাটার চার্ট তৈরি করতে হয়।
সুচিপত্র
চার্ট-নির্দিষ্ট বৈশিষ্ট্য
| সাধারণ বৈশিষ্ট্য
|
ভূমিকা
একটি স্ক্যাটার চার্ট (বা স্ক্যাটার প্লট) একটি দ্বি-মাত্রিক চার্টে পৃথক বিন্দুগুলির একটি সেট। আপনি ঐচ্ছিকভাবে পৃথক বিন্দুর আকার নির্দিষ্ট করতে পারেন। একটি স্ক্যাটার প্লট শুধুমাত্র একটি ডেটা সিরিজ গ্রহণ করতে পারে। স্ক্যাটার চার্ট দুটি ভেরিয়েবল আছে এমন অনেক ডেটা পয়েন্টে গ্রুপিং বা প্যাটার্ন সনাক্ত করার জন্য ভাল (যদি আপনার শুধুমাত্র একটি ভেরিয়েবল থাকে তবে একটি লাইন চার্ট বিবেচনা করুন)।
আপনাকে কমপক্ষে দুটি ডেটা সিরিজ সরবরাহ করতে হবে: প্রথম ডেটা সিরিজ x-স্থানাঙ্ক নির্দিষ্ট করে এবং দ্বিতীয় ডেটা সিরিজটি y-স্থানাঙ্ক নির্দিষ্ট করে।
পৃথক পয়েন্টের আকার নির্দিষ্ট করতে আপনি ঐচ্ছিকভাবে একটি তৃতীয় সিরিজ সরবরাহ করতে পারেন। এই সিরিজটি ছাড়া, সমস্ত পয়েন্ট ডিফল্ট 10 পিক্সেল জুড়ে থাকবে।
মনে রাখবেন যে আপনি যদি ডাটা পয়েন্টের আকৃতি বা রঙ পরিবর্তন করতে chm ব্যবহার করেন, তাহলে chm এ প্রদত্ত আকারের তুলনায় পয়েন্টগুলি স্কেল করা হয়।
চার্টের ধরন ( cht )
এই সিনট্যাক্স সহ একটি স্ক্যাটার চার্ট নির্দিষ্ট করুন:
বাক্য গঠন
cht=s
chd=<x_values>|<y_values>[|<optional_point_sizes>]
| বর্ণনা | উদাহরণ |
|---|---|
ডেটা পয়েন্টের জন্য ডিফল্ট মার্কার হল একটি নীল বৃত্ত। একটি ভিন্ন রঙ বা আকৃতি ব্যবহার করতে, এই অংশের বাকি অংশে বর্ণিত এই চার্টটি একটি তৃতীয় ডেটা সিরিজ অন্তর্ভুক্ত করে পয়েন্টের আকার পরিবর্তন করে। |
|
আপনি যদি রঙ ব্যবহারের মাধ্যমে একাধিক সিরিজ অনুকরণ করতে চান তবে পৃথক ডট রঙ নির্দিষ্ট করতে এই চার্টে তিনটি ডেটা সিরিজ রয়েছে: প্রথমটি হল x-মান, দ্বিতীয়টি সংশ্লিষ্ট y-মান এবং তৃতীয়টি সংশ্লিষ্ট বিন্দুর আকার। কিংবদন্তি |  chd=t: |
পয়েন্টের আকৃতি পরিবর্তন করতে, আকৃতি চিহ্নিতকারী ব্যবহার করুন। আকৃতি চিহ্নিতকারীরা
আকৃতি চিহ্নিতকারী ব্যবহার করার জন্য আরও টিপস:
|  chm=d,FF0000,0,-1,15ডিফল্ট আকারটি হীরাতে সেট করুন (d)  chm=ডিফল্ট হল হীরা ( d ), মার্কার সূচক 15 এবং পরবর্তীতে হীরার উপর বর্গাকার ( s ) আবৃত।  chd=t: |
আপনি একটি স্ক্যাটার চার্টে কিছু বা সমস্ত পয়েন্ট সংযোগ করতে একটি লাইন মার্কার (
|  chd=t: |
দৃশ্যমান পয়েন্টগুলির উপর নির্ভর না করে কীভাবে আপনার পয়েন্টগুলির মাধ্যমে একটি ট্রেস লাইন তৈরি করবেন তা এখানে রয়েছে:
স্ক্যাটার চার্টগুলি যৌগিক চার্ট হিসাবে ব্যবহার করা যাবে না, তাই আপনি আপনার লাইন বর্ণনা করার জন্য একটি অতিরিক্ত সিরিজ যোগ করতে পারবেন না। আপনি এই পদ্ধতি ব্যবহার করে একটি ড্যাশড লাইন নির্দিষ্ট করতে পারবেন না, তবে আপনি লাইনের রঙ এবং বেধ নির্দিষ্ট করতে পারেন। | লুকানো পয়েন্ট সহ ট্রেস লাইন:chd=t: |


সিরিজ রং chco
chco প্যারামিটার ব্যবহার করে বিন্দুর রঙ নির্দিষ্ট করুন। আপনি সমস্ত পয়েন্টের জন্য একটি একক রঙ, একটি গ্রেডিয়েন্ট বা পৃথক পয়েন্টের জন্য রঙ নির্দিষ্ট করতে পারেন।
বাক্য গঠন
chco=<single_color>
  or
chco=<point_1_color>|...|<point_n_color>
  or
chco=<gradient_start>,...,<gradient_end> (only with third data series)
- < রঙ >
- বিন্দুর রঙ, RRGGBB হেক্সাডেসিমেল বিন্যাসে । কয়েকটি ভিন্ন ফরম্যাট আছে:
- সমস্ত পয়েন্টে প্রয়োগ করার জন্য একটি একক রঙ নির্দিষ্ট করুন।
- পৃথক বিন্দুতে পৃথক রং প্রয়োগ করতে, একটি পাইপ বিভাজক সহ প্রতি বিন্দুতে একটি রঙ নির্দিষ্ট করুন।
- আপনি যদি পৃথক বিন্দুর রঙ নির্দিষ্ট করেন কিন্তু বিন্দুর চেয়ে কম রঙ থাকে, প্রতিটি n ম বিন্দুতে সংশ্লিষ্ট n ম রঙ দেওয়া হয়। এটি একটি একাধিক সিরিজ স্ক্যাটারচার্ট তৈরি করার উপায়।
- একটি রঙের গ্রেডিয়েন্ট প্রয়োগ করতে, আপনাকে অবশ্যই একটি তৃতীয় ডেটা সিরিজ অন্তর্ভুক্ত করতে হবে (যা পয়েন্টের আকার নির্ধারণ করে)। বিন্দুর আকারের উপর নির্ভর করে পয়েন্টগুলিতে একটি রঙের গ্রেডিয়েন্ট প্রয়োগ করতে কমা দ্বারা পৃথক করা দুটি বা ততোধিক রঙ অন্তর্ভুক্ত করুন।
সাধারণ বৈশিষ্ট্য
এই পৃষ্ঠার বাকি বৈশিষ্ট্যগুলি স্ট্যান্ডার্ড চার্ট বৈশিষ্ট্য।
চার্ট শিরোনাম chtt , chts [ সমস্ত চার্ট ]
আপনি আপনার চার্টের জন্য শিরোনাম পাঠ্য, রঙ এবং ফন্টের আকার নির্দিষ্ট করতে পারেন।
বাক্য গঠন
chtt=<chart_title>
chts=<color>,<font_size>,<opt_alignment>
chtt - চার্ট শিরোনাম নির্দিষ্ট করে।
- < চার্ট_টাইটেল >
- চার্ট দেখানোর জন্য শিরোনাম। এটি কোথায় প্রদর্শিত হবে তা আপনি নির্দিষ্ট করতে পারবেন না, তবে আপনি ঐচ্ছিকভাবে ফন্টের আকার এবং রঙ নির্দিষ্ট করতে পারেন। শূন্যস্থান নির্দেশ করতে একটি + চিহ্ন এবং লাইন বিরতি নির্দেশ করতে একটি পাইপ অক্ষর (
|) ব্যবহার করুন।
chts [ ঐচ্ছিক ] - chtt প্যারামিটারের জন্য রঙ এবং ফন্টের আকার।
- <রঙ >
- শিরোনামের রঙ, RRGGBB হেক্সাডেসিমেল বিন্যাসে । ডিফল্ট রঙ কালো।
- <font_size>
- শিরোনামের হরফের আকার, পয়েন্টে।
- < opt_alignment >
- [ ঐচ্ছিক ] শিরোনামের প্রান্তিককরণ। নিম্নলিখিত কেস-সংবেদনশীল স্ট্রিং মানগুলির মধ্যে একটি বেছে নিন: "l" (বাম), "c" (কেন্দ্রিক) "r" (ডান)। ডিফল্ট হল "c"।
উদাহরণ
| বর্ণনা | উদাহরণ |
|---|---|
একটি শিরোনাম সহ একটি চার্ট, ডিফল্ট রঙ এবং ফন্টের আকার ব্যবহার করে৷ যোগ চিহ্ন ( একটি লাইন বিরতি জোর করতে একটি পাইপ অক্ষর ( |  chtt=Site+visitors+by+month| |
একটি নীল, ডান-সারিবদ্ধ, 20-পয়েন্ট শিরোনাম সহ একটি চার্ট। |  chtt=Site+visitors |
চার্ট লিজেন্ড টেক্সট এবং স্টাইল chdl , chdlp , chdls [ সমস্ত চার্ট ]
কিংবদন্তি হল চার্টের একটি পার্শ্ব বিভাগ যা প্রতিটি সিরিজের একটি ছোট পাঠ্য বিবরণ দেয়। আপনি এই কিংবদন্তির প্রতিটি সিরিজের সাথে যুক্ত পাঠ্যটি নির্দিষ্ট করতে পারেন এবং চার্টে এটি কোথায় প্রদর্শিত হবে তা উল্লেখ করতে পারেন।
আপনার কিংবদন্তির চারপাশে মার্জিন কীভাবে সেট করবেন তা শিখতে chma দেখুন।
স্ট্রিং মানগুলির উপর একটি নোট: লেবেল স্ট্রিংগুলিতে শুধুমাত্র URL-নিরাপদ অক্ষরগুলি অনুমোদিত৷ নিরাপদে থাকার জন্য, আপনি 0-9a-zA-Z অক্ষর সেটে নেই এমন অক্ষর সমন্বিত যেকোনো স্ট্রিংকে URL-এনকোড করতে হবে। আপনি Google ভিজ্যুয়ালাইজেশন ডকুমেন্টেশনে একটি URL এনকোডার খুঁজে পেতে পারেন।
বাক্য গঠন
chdl=<data_series_1_label>|...|<data_series_n_label>
chdlp=<opt_position>|<opt_label_order>
chdls=<color>,<size>
chdl - কিংবদন্তীতে প্রদর্শনের জন্য প্রতিটি সিরিজের পাঠ্য।
- < ডেটা_সিরিজ_লেবেল >
- কিংবদন্তি এন্ট্রি জন্য পাঠ্য. প্রতিটি লেবেল
chdঅ্যারের সংশ্লিষ্ট সিরিজে প্রযোজ্য। একটি স্থানের জন্য একটি + চিহ্ন ব্যবহার করুন। আপনি যদি এই প্যারামিটারটি নির্দিষ্ট না করেন তবে চার্টটি একটি কিংবদন্তি পাবে না। একটি লেবেলে একটি লাইন বিরতি নির্দিষ্ট করার কোন উপায় নেই। কিংবদন্তিটি সাধারণত আপনার কিংবদন্তি পাঠ্যটিকে ধরে রাখতে প্রসারিত হবে এবং লেজেন্ডটিকে মিটমাট করার জন্য চার্টের ক্ষেত্রটি সঙ্কুচিত হবে।
chdlp - [ ঐচ্ছিক ] কিংবদন্তির অবস্থান, এবং কিংবদন্তি এন্ট্রির ক্রম। আপনি < অবস্থান > এবং/অথবা < label_order > নির্দিষ্ট করতে পারেন। আপনি যদি উভয়টি নির্দিষ্ট করেন তবে একটি বার অক্ষর দিয়ে আলাদা করুন। আপনি যদি চান যে chdl এ খালি কিংবদন্তি এন্ট্রিগুলি কিংবদন্তিতে এড়িয়ে যেতে চান তাহলে আপনি যেকোনো মানতে একটি 's' যোগ করতে পারেন। উদাহরণ: chdlp=bv , chdlp=r , chdlp=bv|r , chdlp=bvs|r
- < opt_position >
- [ ঐচ্ছিক ] লেজেন্ডের অবস্থান সুনির্দিষ্ট করে। কিংবদন্তি এবং চার্ট এলাকা বা ছবির সীমানার মধ্যে অতিরিক্ত প্যাডিং নির্দিষ্ট করতে,
chmaপ্যারামিটার ব্যবহার করুন। নিম্নলিখিত মানগুলির মধ্যে একটি চয়ন করুন:-
b- লেজেন্ডের নীচে লেজেন্ড, একটি অনুভূমিক সারিতে লেজেন্ড এন্ট্রি। -
bv- চার্টের নীচে কিংবদন্তি, একটি উল্লম্ব কলামে কিংবদন্তি এন্ট্রি। -
t- চার্টের শীর্ষে লেজেন্ড, একটি অনুভূমিক সারিতে কিংবদন্তি এন্ট্রি। -
tv- চার্টের শীর্ষে লেজেন্ড, একটি উল্লম্ব কলামে কিংবদন্তি এন্ট্রি। -
r- [ ডিফল্ট ] লেজেন্ড লেজেন্ডের ডানদিকে, একটি উল্লম্ব কলামে লেজেন্ড এন্ট্রি। -
l- লেজেন্ডের বাম দিকে, একটি উল্লম্ব কলামে কিংবদন্তি এন্ট্রি।
-
- < opt_label_order >
- [ ঐচ্ছিক ] যে ক্রমে লেবেলগুলি কিংবদন্তিতে দেখানো হয়েছে৷ নিম্নলিখিত মানগুলির মধ্যে একটি চয়ন করুন:
-
l- [ উল্লম্ব কিংবদন্তিগুলির জন্য ডিফল্ট ]chdlদেওয়া ক্রমে লেবেলগুলি প্রদর্শন করুন৷ -
r-chdlকে দেওয়া বিপরীত ক্রমে লেবেলগুলি প্রদর্শন করুন। এটি কিংবদন্তি দেখানোর জন্য স্ট্যাক করা বার চার্টে দরকারী
বার প্রদর্শিত একই ক্রমে. -
a- [ অনুভূমিক কিংবদন্তির জন্য ডিফল্ট ] স্বয়ংক্রিয় ক্রম: মোটামুটি মানে হল দৈর্ঘ্য অনুসারে বাছাই করা, প্রথমে সংক্ষিপ্ততম, যেমন 10 পিক্সেল ব্লকে পরিমাপ করা হয়। যখন দুটি উপাদান একই দৈর্ঘ্যের হয় (10 পিক্সেল ব্লকে বিভক্ত), প্রথমে তালিকাভুক্ত একটি প্রথমে প্রদর্শিত হবে। -
0,1,2...- কাস্টম লেবেল অর্ডার। এটিchdlথেকে শূন্য-ভিত্তিক লেবেল সূচীগুলির একটি তালিকা, কমা দ্বারা পৃথক করা হয়েছে।
-
chdls - [ ঐচ্ছিক ] কিংবদন্তি পাঠ্যের রঙ এবং ফন্টের আকার নির্দিষ্ট করে।
- < রঙ >
- লেজেন্ড টেক্সট রঙ, RRGGBB হেক্সাডেসিমেল ফর্ম্যাটে ।
- < আকার >
- কিংবদন্তি পাঠ্যের বিন্দু আকার।
উদাহরণ
| বর্ণনা | উদাহরণ |
|---|---|
কিংবদন্তির দুটি উদাহরণ। আপনার ডেটা সিরিজের মতো একই ক্রমে কিংবদন্তি পাঠ্য নির্দিষ্ট করুন। |
chdl=NASDAQ|FTSE100|DOW
chdl=First|Second|Third |
প্রথম চার্ট অনুভূমিক কিংবদন্তি এন্ট্রিগুলি প্রদর্শন করে ( |
|
| এই উদাহরণটি ফন্টের আকার পরিবর্তন দেখায়। |
|


চার্ট মার্জিন chma [ সমস্ত চার্ট ]
আপনি চার্টের মার্জিনের আকার পিক্সেলে নির্দিষ্ট করতে পারেন। মার্জিন নির্দিষ্ট চার্ট আকার ( chs ) থেকে ভিতরের দিকে গণনা করা হয়; মার্জিনের আকার বাড়ানো মোট চার্টের আকার বাড়ায় না, বরং প্রয়োজনে চার্টের ক্ষেত্রটিকে সঙ্কুচিত করে।
চার্টের আকার গণনা করার পরে যা অবশিষ্ট থাকে তা ডিফল্টভাবে মার্জিন হয়। এই ডিফল্ট মান চার্টের ধরন অনুসারে পরিবর্তিত হয়। আপনি যে মার্জিনগুলি নির্দিষ্ট করেছেন তা একটি সর্বনিম্ন মান; যদি চার্টের ক্ষেত্রটি মার্জিনের জন্য জায়গা ছেড়ে দেয়, তবে মার্জিনের আকার যা অবশিষ্ট থাকবে তা হবে; আপনি কোন কিংবদন্তি এবং লেবেলগুলির জন্য প্রয়োজনীয়তার চেয়ে ছোট মার্জিনগুলিকে চাপতে পারবেন না। এখানে একটি চার্টের মৌলিক অংশগুলি দেখানো একটি চিত্র:
 | চার্ট মার্জিনে অক্ষ লেবেল এবং কিংবদন্তি এলাকা অন্তর্ভুক্ত রয়েছে। কিংবদন্তি এলাকা স্বয়ংক্রিয়ভাবে টেক্সট ফিট করার জন্য স্বয়ংক্রিয়ভাবে আকার পরিবর্তন করে, যদি না আপনি টিপ: একটি বার চার্টে, বারগুলির একটি নির্দিষ্ট আকার (ডিফল্ট) থাকলে, চার্ট এলাকার প্রস্থ কমানো যাবে না। আপনাকে অবশ্যই |
বাক্য গঠন
chma=
  <left_margin>,<right_margin>,<top_margin>,<bottom_margin>|<opt_legend_width>,<opt_legend_height>
- < left_margin >, < right_margin >, < top_margin >, < bottom_margin >
- চার্ট এলাকার চারপাশে ন্যূনতম মার্জিন আকার, পিক্সেলে। অক্ষের লেবেলগুলিকে চার্টের সীমানাগুলির সাথে বাম্পিং থেকে আটকাতে কিছু প্যাডিং অন্তর্ভুক্ত করতে এই মানটি বাড়ান৷
- < opt_legend_width >, < opt_legend_height >
- [ ঐচ্ছিক ] কিংবদন্তির চারপাশে মার্জিনের প্রস্থ, পিক্সেলে। লেজেন্ডটিকে চার্ট এরিয়া বা ছবির প্রান্তের সাথে বাম্প আপ করা এড়াতে এটি ব্যবহার করুন।
উদাহরণ
| বর্ণনা | উদাহরণ |
|---|---|
এই উদাহরণে, চার্টের প্রতিটি পাশে ন্যূনতম 30 পিক্সেল মার্জিন রয়েছে। চার্ট লিজেন্ডটি 30 পিক্সেলের বেশি প্রশস্ত হওয়ার কারণে, ডান পাশের মার্জিনটি চার্ট লিজেন্ডের প্রস্থে সেট করা হয়েছে এবং অন্যান্য মার্জিন থেকে আলাদা। অক্ষ লেবেলগুলি প্লট এলাকার বাইরে, এবং তাই মার্জিন স্পেসের মধ্যে আঁকা হয়। |
|
কিংবদন্তির চারপাশে একটি মার্জিন যোগ করতে, এই উদাহরণে, কিংবদন্তিটি প্রায় 60 পিক্সেল চওড়া। আপনি যদি |
|


অক্ষ শৈলী এবং লেবেল [ লাইন, বার, গুগল-ও-মিটার, রাডার, স্ক্যাটার ]
আপনি চার্টে কোন অক্ষগুলি প্রদর্শন করতে হবে তা নির্দিষ্ট করতে পারেন এবং তাদের কাস্টম লেবেল এবং অবস্থান, ব্যাপ্তি এবং শৈলী দিতে পারেন।
সমস্ত চার্ট ডিফল্টরূপে অক্ষরেখা দেখায় না। chxt প্যারামিটার ব্যবহার করে আপনার চার্টে ঠিক কোন অক্ষগুলি দেখানো উচিত তা আপনি নির্দিষ্ট করতে পারেন। ডিফল্ট অক্ষ রেখা সংখ্যা দেখায় না; সংখ্যা দেখানোর জন্য আপনাকে chxt প্যারামিটারে একটি অক্ষ উল্লেখ করতে হবে।
আপনি আপনার অক্ষগুলি ডেটা মানগুলিকে প্রতিফলিত করে প্রদর্শন সংখ্যাগুলি বেছে নিতে পারেন বা আপনি কাস্টম অক্ষগুলি নির্দিষ্ট করতে পারেন৷ ডিফল্ট হল সাংখ্যিক মান প্রদর্শন করা, মানগুলি 0-100 থেকে পরিসরে স্কেল করা। যাইহোক, আপনি chxr ব্যবহার করে যে কোনো পরিসর পরিবর্তন করতে পারেন, এবং আপনি chxs ব্যবহার করে মান (উদাহরণস্বরূপ, মুদ্রার প্রতীক বা দশমিক স্থান দেখানোর জন্য) স্টাইল করতে পারেন।
আপনি যদি কাস্টম মান ব্যবহার করতে চান, উদাহরণস্বরূপ: "সোম, মঙ্গল, বুধ", আপনি chxl প্যারামিটার ব্যবহার করতে পারেন। এই লেবেলগুলিকে অক্ষ বরাবর নির্দিষ্ট স্থানে রাখতে, chxp প্যারামিটার ব্যবহার করুন।
অবশেষে, আপনি chxs এবং chxtc প্যারামিটার ব্যবহার করতে পারেন।
স্ট্রিং মানগুলির উপর একটি নোট: লেবেল স্ট্রিংগুলিতে শুধুমাত্র URL-নিরাপদ অক্ষরগুলি অনুমোদিত৷ নিরাপদে থাকার জন্য, আপনি 0-9a-zA-Z অক্ষর সেটে নেই এমন অক্ষর সমন্বিত যেকোনো স্ট্রিংকে URL-এনকোড করতে হবে। আপনি Google ভিজ্যুয়ালাইজেশন ডকুমেন্টেশনে একটি URL এনকোডার খুঁজে পেতে পারেন।
এই বিভাগে নিম্নলিখিত বিষয়গুলি কভার করে:
- দৃশ্যমান অক্ষ (
chxt) - কোন অক্ষগুলি প্রদর্শন করতে হবে৷ - অক্ষ পরিসর (
chxr) - প্রতিটি অক্ষের জন্য মান পরিসীমা। - কাস্টম অক্ষ লেবেল (
chxl) - অক্ষে দেখানোর জন্য কাস্টম মান। - অক্ষ লেবেল অবস্থান (
chxp) - প্রতিটি অক্ষ বরাবর কাস্টম লেবেল স্থাপন। - অক্ষ লেবেল শৈলী (
chxs) - অক্ষ লেবেলের রঙ, আকার, প্রান্তিককরণ এবং বিন্যাস। - অক্ষ টিক চিহ্ন শৈলী (
chxtc) - একটি নির্দিষ্ট অক্ষের জন্য টিক চিহ্নের দৈর্ঘ্য।
দৃশ্যমান Axes chxt
বার, লাইন, রাডার, এবং স্ক্যাটার চার্ট ডিফল্টভাবে এক বা দুটি অক্ষ রেখা দেখায়, কিন্তু এই লাইনগুলিতে মান অন্তর্ভুক্ত নয়। আপনার অক্ষ রেখায় মান প্রদর্শন করতে, বা কোন অক্ষগুলি দেখানো হয়েছে তা পরিবর্তন করতে, আপনাকে অবশ্যই chxt প্যারামিটার ব্যবহার করতে হবে। ডিফল্টরূপে, অক্ষের মানগুলি 0-100 এর মধ্যে থাকে, যদি না আপনি chxr প্রপার্টি ব্যবহার করে স্পষ্টভাবে স্কেল না করেন। একটি লাইন চার্টে সমস্ত অক্ষ রেখা লুকানোর জন্য, cht প্যারামিটারে চার্ট টাইপ মানের পরে :nda উল্লেখ করুন (উদাহরণ: cht= lc:nda )।
ডিফল্টরূপে, উপরের এবং নীচের অক্ষগুলি মান দ্বারা টিক চিহ্ন দেখায় না, যখন বাম এবং ডান অক্ষগুলি সেগুলি দেখায়। আপনি chxs প্যারামিটার ব্যবহার করে এই আচরণ পরিবর্তন করতে পারেন।
বাক্য গঠন
chxt=
  <axis_1>
    ,...,
  <axis_n>
- < অক্ষ >
- চার্টে দেখানোর জন্য একটি অক্ষ। উপলব্ধ অক্ষগুলি হল:
-
x- নিচের x-অক্ষ -
t- শীর্ষ x-অক্ষ [ Google-o-Meter দ্বারা সমর্থিত নয় ] -
y- বাম y-অক্ষ -
r- ডান y-অক্ষ [ Google-o-Meter দ্বারা সমর্থিত নয় ]
-
আপনি একই ধরণের একাধিক অক্ষ নির্দিষ্ট করতে পারেন, উদাহরণস্বরূপ: cht=x,x,y । এটি চার্টের নীচের দিকে x-অক্ষের দুটি সেট স্ট্যাক করবে। সাংখ্যিক মান দেখায় এমন একটি অক্ষ বরাবর কাস্টম লেবেল যোগ করার সময় এটি দরকারী (নীচের উদাহরণ দেখুন)। অক্ষগুলি ভিতরের বাইরে থেকে আঁকা হয়, তাই আপনার যদি x,x থাকে, তাহলে প্রথম xটি সবচেয়ে ভিতরের অনুলিপিকে বোঝায়, পরের xটি পরবর্তী বাইরের অনুলিপিকে বোঝায় এবং আরও অনেক কিছু।
উদাহরণ
| বর্ণনা | উদাহরণ |
|---|---|
এই উদাহরণটি একটি x-অক্ষ, একটি y-অক্ষ, একটি শীর্ষ অক্ষ (t), এবং একটি ডান অক্ষ (r) সহ একটি লাইন চার্ট দেখায়। যেহেতু কোনো লেবেল নির্দিষ্ট করা নেই, তাই সমস্ত অক্ষের জন্য চার্টটি 0 থেকে 100 এর পরিসরে ডিফল্ট। মনে রাখবেন যে ডিফল্টরূপে, উপরের এবং নীচের অক্ষগুলি লেবেল দ্বারা টিক চিহ্ন দেখায় না। |
|
আপনি একই মান একাধিকবার অন্তর্ভুক্ত করে প্রতিটি অক্ষের জন্য লেবেলের একাধিক সেট অন্তর্ভুক্ত করতে পারেন। এই উদাহরণটি x এর দুটি সেট এবং y-অক্ষের দুটি সেট দেখায়। শুধুমাত্র ডিফল্ট অক্ষ লেবেল ব্যবহার করার সময় এটি বিশেষভাবে উপযোগী নয়, যেমনটি এখানে দেখানো হয়েছে। কিন্তু আপনি chxl প্যারামিটার ব্যবহার করে প্রতিটি অক্ষের প্রতিটি কপির জন্য কাস্টম লেবেল নির্দিষ্ট করতে পারেন। |
|
এই উদাহরণটি একটি x-অক্ষ, একটি y-অক্ষ, একটি উপরের টি-অক্ষ এবং একটি ডান r-অক্ষ সহ একটি অনুভূমিক বার চার্ট দেখায়। অক্ষ লেবেলগুলি বাদ দেওয়া হয়েছে, তাই চার্ট API x-অক্ষ এবং টি-অক্ষের জন্য 0 থেকে 100 এর পরিসর প্রদর্শন করে। y-অক্ষ এবং r-অক্ষের জন্য পরিসীমা বারের সংখ্যা দ্বারা নির্ধারিত হয়। এই ক্ষেত্রে, পাঁচটি বার আছে, তাই চার্ট এপিআই 0 থেকে 4 এর পরিসর প্রদর্শন করে। প্রথম লেবেলটি প্রথম বারের গোড়ায় কেন্দ্রীভূত হয়, দ্বিতীয় লেবেলটি দ্বিতীয় বারের গোড়ায় কেন্দ্রীভূত হয় এবং আরও অনেক কিছু। . |
|
আপনি চার্টের প্রকারের পরে :nda উল্লেখ করে একটি লাইন চার্টে ডিফল্ট অক্ষগুলিকে দমন করতে পারেন। |  cht=lc:nda |

 chxt=x,x,y,y
  chxt=x,x,y,y
অক্ষ রেঞ্জ chxr
আপনি chxr প্যারামিটার ব্যবহার করে প্রতিটি অক্ষে স্বতন্ত্রভাবে প্রদর্শিত মানগুলির পরিসর নির্দিষ্ট করতে পারেন। মনে রাখবেন যে এটি চার্ট উপাদানগুলির স্কেল পরিবর্তন করে না , শুধুমাত্র অক্ষ লেবেলের স্কেল পরিবর্তন করে। আপনি যদি অক্ষ সংখ্যাগুলিকে প্রকৃত ডেটা মানগুলি বর্ণনা করতে চান তবে যথাক্রমে আপনার ডেটা বিন্যাস পরিসরের নিম্ন এবং উপরের মানগুলিতে < start_val > এবং < end_val > সেট করুন। আরও তথ্যের জন্য অক্ষ স্কেলিং দেখুন।
আপনি chxt প্যারামিটার ব্যবহার করে একটি অক্ষকে দৃশ্যমান করতে হবে যদি আপনি এর পরিসীমা নির্দিষ্ট করতে চান।
কাস্টম অক্ষ মান নির্দিষ্ট করতে, chxl প্যারামিটার ব্যবহার করুন।
বাক্য গঠন
পাইপ অক্ষর ( | ) ব্যবহার করে একাধিক অক্ষ লেবেল রেঞ্জ আলাদা করুন।
chxr=
  <axis_index>,<start_val>,<end_val>,<opt_step>
    |...|
  <axis_index>,<start_val>,<end_val>,<opt_step>
- <axis_index>
- কোন অক্ষে লেবেল প্রয়োগ করতে হবে। এটি
chxtদ্বারা নির্দিষ্ট করা অক্ষ অ্যারের মধ্যে একটি শূন্য-ভিত্তিক সূচক। উদাহরণস্বরূপ,chxt=x,r,yতে r-অক্ষ 1 হবে। - < start_val >
- একটি সংখ্যা, এই অক্ষের জন্য নিম্ন মান সংজ্ঞায়িত করে।
- < end_val >
- একটি সংখ্যা, এই অক্ষের জন্য উচ্চ মান সংজ্ঞায়িত করে।
- < opt_step >
- [ ঐচ্ছিক ] অক্ষে টিকগুলির মধ্যে গণনা ধাপ। কোন ডিফল্ট ধাপ মান নেই; ধাপটি সুন্দরভাবে ফাঁকা লেবেলের একটি সেট দেখানোর চেষ্টা করার জন্য গণনা করা হয়।
উদাহরণ
| বর্ণনা | উদাহরণ |
|---|---|
এই উদাহরণটি বাম এবং ডান y-অক্ষ ( প্রতিটি অক্ষের একটি নির্দিষ্ট পরিসর রয়েছে। যেহেতু কোনও লেবেল বা অবস্থান নির্দিষ্ট করা নেই, মানগুলি প্রদত্ত পরিসর থেকে নেওয়া হয় এবং সেই সীমার মধ্যে সমানভাবে ব্যবধান করা হয়। লাইন চার্টে, মানগুলি সমানভাবে x-অক্ষ বরাবর ছড়িয়ে আছে। অক্ষের দিকটি r-অক্ষ (সূচক |
|
এই উদাহরণে, x-অক্ষের জন্য মান নির্দিষ্ট করা হয়েছে। অক্ষের লেবেলগুলি অক্ষ বরাবর সমানভাবে ব্যবধানযুক্ত। < opt_step > প্যারামিটারের জন্য পাঁচ ( |
|


কাস্টম অক্ষ লেবেল chxl
আপনি chxl প্যারামিটার ব্যবহার করে যেকোনো অক্ষে কাস্টম স্ট্রিং অক্ষ লেবেল নির্দিষ্ট করতে পারেন। আপনি আপনার পছন্দ অনুযায়ী অনেক লেবেল নির্দিষ্ট করতে পারেন. আপনি যদি একটি অক্ষ প্রদর্শন করেন ( chxt প্যারামিটার ব্যবহার করে) এবং কাস্টম লেবেল নির্দিষ্ট না করেন, তাহলে মানক, সংখ্যাসূচক লেবেল প্রয়োগ করা হবে। একটি কাস্টম সাংখ্যিক পরিসর নির্দিষ্ট করতে, পরিবর্তে chxr প্যারামিটার ব্যবহার করুন।
আপনার লেবেলের জন্য অক্ষ বরাবর নির্দিষ্ট অবস্থান সেট করতে, chxp প্যারামিটার ব্যবহার করুন।
বাক্য গঠন
আপনি লেবেল করতে চান এমন প্রতিটি অক্ষের জন্য একটি প্যারামিটার সেট নির্দিষ্ট করুন। পাইপ অক্ষর ( | ) ব্যবহার করে লেবেলের একাধিক সেট আলাদা করুন।
chxl=
  <axis_index>:|<label_1>|...|<label_n>
    |...|
  <axis_index>:|<label_1>|...|<label_n>
- <axis_index>
- কোন অক্ষে লেবেল প্রয়োগ করতে হবে। এটি
chxtপ্যারামিটার অ্যারের একটি সূচক। উদাহরণস্বরূপ, আপনার যদিchxt=x,x,y,yথাকে তাহলে সূচক 0 হবে প্রথম x-অক্ষ, 1 হবে দ্বিতীয় x-অক্ষ। - <label_1> | ... |< লেবেল_এন >
- এই অক্ষ বরাবর স্থাপন করতে এক বা একাধিক লেবেল। এই স্ট্রিং বা সংখ্যা মান হতে পারে; স্ট্রিং উদ্ধৃতি হতে হবে না. label_1 অক্ষের সর্বনিম্ন অবস্থানে প্রদর্শিত হয়, এবং label_n সর্বোচ্চ অবস্থানে প্রদর্শিত হয়। অতিরিক্ত লেবেল তাদের মধ্যে সমানভাবে ফাঁক করা হয়. একটি + চিহ্ন দিয়ে শূন্যস্থান নির্দেশ করুন। একটি লেবেলে একটি লাইন বিরতি নির্দিষ্ট করার কোন উপায় নেই। একটি পাইপ অক্ষর সঙ্গে পৃথক লেবেল. দ্রষ্টব্য:
chxlপ্যারামিটারে চূড়ান্ত লেবেলের পরে একটি পাইপ রাখবেন না।
উদাহরণ
| বর্ণনা | উদাহরণ |
|---|---|
এই চার্টটি দেখায় কিভাবে দুটি অক্ষে কাস্টম লেবেল যোগ করতে হয়। লক্ষ্য করুন কিভাবে মানগুলি সমানভাবে ব্যবধানে রাখা হয় এবং কিভাবে শেষ |  chxt=x,y |
এই উদাহরণে বাম এবং ডান y-অক্ষে অক্ষের লেবেল রয়েছে ( |
|
এই উদাহরণে বাম এবং ডান y-অক্ষে অক্ষের লেবেল রয়েছে ( এই উদাহরণটি বাম y-অক্ষের অক্ষ লেবেলের জন্য ডিফল্ট মান ব্যবহার করে। |
|
আপনি যদি একটি সম্পূর্ণ অক্ষ বর্ণনা করার জন্য একটি সাধারণ লেবেল যোগ করতে চান (উদাহরণস্বরূপ, একটি অক্ষকে "খরচ" এবং অন্যটি "ছাত্র" লেবেল করতে), প্রতিটি পাশে একটি অতিরিক্ত অক্ষ যোগ করতে |  chxt=x,x,y,y |


অক্ষ লেবেল অবস্থান chxp
ডিফল্ট লেবেল ব্যবহার করে বা chxl ব্যবহার করে নির্দিষ্ট করা কাস্টম লেবেল ব্যবহার করে কোন অক্ষের লেবেল দেখাতে হবে তা আপনি নির্দিষ্ট করতে পারেন। আপনি যদি এই পরামিতি ব্যবহার করে সঠিক অবস্থান নির্দিষ্ট না করেন, তাহলে লেবেলগুলি সমানভাবে এবং অক্ষ বরাবর একটি ডিফল্ট ধাপের মানের মধ্যে থাকবে। আপনি যদি chxl নির্দিষ্ট না করেন, তাহলে টিক মার্ক লেবেলগুলি হবে ডিফল্ট মান (সাধারণত ডেটা মান, বা বার চার্টে বার নম্বর)।
বাক্য গঠন
পাইপ অক্ষর ( | ) ব্যবহার করে একাধিক পজিশনিং সেট আলাদা করুন।
chxp=
  <axis_1_index>,<label_1_position>,...,<label_n_position>
    |...|
  <axis_m_index>,<label_1_position>,...,<label_n_position>
- <axis_index>
- যে অক্ষের জন্য আপনি অবস্থান নির্দিষ্ট করছেন। এটি
chxtপ্যারামিটার অ্যারের একটি সূচক। উদাহরণস্বরূপ, আপনার যদিchxt=x,x,y,yথাকে তাহলে সূচক 0 হবে প্রথম x-অক্ষ, 1 হবে দ্বিতীয় x-অক্ষ, ইত্যাদি। - < label_1_position >,...,< label_n_position >
- অক্ষ বরাবর লেবেলের অবস্থান। এটি সাংখ্যিক মানগুলির একটি কমা দ্বারা পৃথক করা তালিকা, যেখানে প্রতিটি মান
chxlঅ্যারেতে সংশ্লিষ্ট লেবেলের অবস্থান নির্ধারণ করে: প্রথম এন্ট্রিটি প্রথম লেবেলে প্রযোজ্য, এবং আরও অনেক কিছু। অবস্থান হল সেই অক্ষের পরিসরের একটি মান। মনে রাখবেন যে এটি সর্বদা 0-100 হবে যদি না আপনিchxrব্যবহার করে একটি কাস্টম পরিসর নির্দিষ্ট না করেন। আপনার কাছে সেই অক্ষের জন্য যতগুলি লেবেল আছে ততগুলি অবস্থান থাকতে হবে৷
উদাহরণ
| বর্ণনা | উদাহরণ |
|---|---|
এই উদাহরণে চার্টে নির্দিষ্ট অবস্থানে r-অক্ষ লেবেল অন্তর্ভুক্ত রয়েছে। লেবেল পাঠ্যটি | |
এই উদাহরণটি ডিফল্ট লেবেল মানগুলি প্রদর্শন করে, তবে শুধুমাত্র নির্দিষ্ট স্থানে। | chxt=x,y chxt=x,ychxp নির্দিষ্ট করা নেই |


অক্ষ লেবেল শৈলী chxs
আপনি কাস্টম লেবেল এবং ডিফল্ট লেবেল মান উভয় অক্ষ লেবেলের জন্য ফন্টের আকার, রঙ এবং প্রান্তিককরণ নির্দিষ্ট করতে পারেন। একই অক্ষের সমস্ত লেবেলের বিন্যাস একই। আপনার যদি একটি অক্ষের একাধিক কপি থাকে তবে আপনি প্রতিটিকে আলাদাভাবে বিন্যাস করতে পারেন। আপনি একটি লেবেল স্ট্রিং এর বিন্যাসও নির্দিষ্ট করতে পারেন, উদাহরণস্বরূপ মুদ্রার প্রতীক বা ট্রেলিং শূন্য দেখানোর জন্য।
ডিফল্টরূপে, উপরের এবং নীচের অক্ষগুলি মান দ্বারা টিক চিহ্ন দেখায় না, যখন বাম এবং ডান অক্ষগুলি সেগুলি দেখায়।
বাক্য গঠন
একাধিক অক্ষের মান একটি পাইপ অক্ষর ( | ) ব্যবহার করে আলাদা করা উচিত।
chxs=
 <axis_index><opt_format_string>,<opt_label_color>,<opt_font_size>,<opt_alignment>,<opt_axis_or_tick>,<opt_tick_color>,<opt_axis_color>
   |...|
 <axis_index><opt_format_string>,<opt_label_color>,<opt_font_size>,<opt_alignment>,<opt_axis_or_tick>,<opt_tick_color>,<opt_axis_color>
- < axis_index >
- যে অক্ষে এটি প্রযোজ্য। এটি
chxtপ্যারামিটারে একটি শূন্য-ভিত্তিক সূচক। - < opt_format_string >
- [ ঐচ্ছিক ] এটি একটি ঐচ্ছিক বিন্যাস স্ট্রিং যেটি ব্যবহার করা হলে, অক্ষ সূচক নম্বরের পরপরই একটি ইন্টারভেনিং কমা ছাড়াই অনুসরণ করে। এটি একটি আক্ষরিক অক্ষর N দিয়ে শুরু হয় এবং নিম্নলিখিত মানগুলি অনুসরণ করে, সমস্ত ঐচ্ছিক:
N< preceding_text >*< number_type >< decimal_places >zs< x or y >*< following_text >
এখানে প্রতিটি উপাদানের অর্থ হল:-
<preceding_text>- প্রতিটি মানের আগে আক্ষরিক পাঠ্য। -
*...*- আক্ষরিক তারকাচিহ্নে মোড়ানো একটি ঐচ্ছিক ব্লক, যেখানে আপনি সংখ্যার জন্য বিন্যাসের বিবরণ নির্দিষ্ট করতে পারেন। নিম্নলিখিত মান সমর্থিত, এবং সব ঐচ্ছিক:-
<number_type>- সংখ্যার বিন্যাস, সাংখ্যিক মানের জন্য। নিচের কোনো একটি পছন্দ কর:-
f- [ ডিফল্ট ] ফ্লোটিং পয়েন্ট ফরম্যাট। < decimal_places > মান সহ নির্ভুলতা উল্লেখ করার কথা বিবেচনা করুন। -
p- শতাংশ বিন্যাস। একটি % চিহ্ন স্বয়ংক্রিয়ভাবে যুক্ত হয়। দ্রষ্টব্য: এই বিন্যাসটি ব্যবহার করার সময়, ডেটা মান 0.0 — 1.0 মানচিত্র থেকে 0 — 100% পর্যন্ত (উদাহরণস্বরূপ, 0.43 43% হিসাবে দেখানো হবে)। -
e- বৈজ্ঞানিক স্বরলিপি বিন্যাস। -
c< CUR >- উপযুক্ত মুদ্রা চিহ্নিতকারীর সাথে নির্দিষ্ট মুদ্রায় নম্বর ফর্ম্যাট করুন। একটি তিন-অক্ষরের মুদ্রা কোড দিয়ে< CUR >প্রতিস্থাপন করুন। উদাহরণ: ইউরোর জন্যcEUR। আপনি ISO ওয়েব সাইটে কোডগুলির একটি তালিকা খুঁজে পেতে পারেন, যদিও সমস্ত প্রতীক সমর্থিত নয়।
-
-
<decimal_places>- একটি পূর্ণসংখ্যা নির্দিষ্ট করে যে কত দশমিক স্থান দেখাতে হবে। এই দৈর্ঘ্যের মানটি বৃত্তাকার (ছাঁটা নয়)। ডিফল্ট হল 2। -
z- পিছনের শূন্য প্রদর্শন করুন। ডিফল্ট না . -
s- প্রদর্শন গ্রুপ বিভাজক. ডিফল্ট না . -
xবাy-নির্দিষ্ট হিসাবে x- বা y- স্থানাঙ্ক থেকে ডেটা প্রদর্শন করুন। x ডেটার অর্থ চার্টের ধরন অনুসারে পরিবর্তিত হয়: এর অর্থ কী তা নির্ধারণ করতে আপনার চার্ট নিয়ে পরীক্ষা করুন। ডিফল্ট হল 'y' ।
-
-
< following_text >- প্রতিটি মান অনুসরণ করার জন্য আক্ষরিক পাঠ্য।
-
- < opt_label_color >
- RRGGBB হেক্সাডেসিমেল বিন্যাসে অক্ষ পাঠে (কিন্তু অক্ষরেখা নয়) প্রয়োগ করার জন্য রঙ। অক্ষরেখার রঙ opt_axis_color ব্যবহার করে আলাদাভাবে নির্দিষ্ট করা হয়েছে। ডিফল্ট ধূসর।
- < opt_font_size >
- [ ঐচ্ছিক ] পিক্সেলে ফন্টের আকার নির্দিষ্ট করে। এই পরামিতি ঐচ্ছিক।
- < opt_alignment >
- [ ঐচ্ছিক ] লেবেল প্রান্তিককরণ। উপরের বা নীচের অক্ষের জন্য, এটি বর্ণনা করে কিভাবে লেবেলটি উপরে বা নীচে টিক চিহ্নের সাথে সারিবদ্ধ হয়; বাম বা ডান অক্ষের জন্য, এটি বর্ণনা করে যে কীভাবে তার আবদ্ধ বাক্সের ভিতরে সারিবদ্ধ হয়, যা অক্ষকে স্পর্শ করে। নিম্নলিখিত সংখ্যাগুলির মধ্যে একটি নির্দিষ্ট করুন:
-
-1- উপরে বা নীচে : লেবেলগুলি টিক্সের ডানদিকে থাকে; বাম বা ডান : লেবেলগুলি তাদের এলাকায় বাম-সারিবদ্ধ। r-অক্ষ লেবেলের জন্য ডিফল্ট। -
0- উপরে বা নীচে : লেবেলগুলি টিক্সের উপর কেন্দ্রীভূত হয়; বাম বা ডান : লেবেলগুলি তাদের এলাকায় কেন্দ্রীভূত। x- এবং t-অক্ষ লেবেলের জন্য ডিফল্ট। -
1- উপরে বা নীচে : লেবেলগুলি টিক্সের বাম দিকে রয়েছে; বাম বা ডান : লেবেলগুলি তাদের এলাকায় ডান-সারিবদ্ধ। y-অক্ষ লেবেলের জন্য ডিফল্ট।
-
- < opt_axis_or_tick >
- [ ঐচ্ছিক; Google-o-meter-এ সমর্থিত নয় ] এই অক্ষের জন্য টিক চিহ্ন এবং/বা অক্ষরেখা দেখাতে হবে কিনা। টিক চিহ্ন এবং অক্ষ রেখাগুলি কেবলমাত্র ভিতরের অক্ষের জন্য উপলব্ধ (উদাহরণস্বরূপ, তারা দুটি x-অক্ষের বাইরের জন্য সমর্থিত নয়)। নিম্নলিখিত মানগুলির মধ্যে একটি ব্যবহার করুন:
-
l(ছোট হাতের 'L') - শুধুমাত্র অক্ষরেখা আঁকুন। -
t- শুধুমাত্র টিক চিহ্ন আঁকুন। টিক চিহ্ন হল অক্ষ লেবেলের পাশের ছোট লাইন। -
lt- [ ডিফল্ট ] সমস্ত লেবেলের জন্য একটি অক্ষরেখা এবং টিক চিহ্ন উভয়ই আঁকুন। -
_- (আন্ডারস্কোর) অক্ষরেখা বা টিক চিহ্ন আঁকুন না। আপনি একটি অক্ষ রেখা লুকাতে চান, এই মান ব্যবহার করুন.
-
- < টিক_রং >
- [ ঐচ্ছিক ; Google-o-meter-এ সমর্থিত নয় ] RRGGBB হেক্সাডেসিমেল বিন্যাসে টিক চিহ্নের রঙ। ডিফল্ট ধূসর।
- < opt_axis_color >
- [ ঐচ্ছিক ] এই অক্ষ রেখার রঙ, RRGGBB হেক্সাডেসিমেল বিন্যাসে । ডিফল্ট ধূসর।
উদাহরণ
| বর্ণনা | উদাহরণ |
|---|---|
হরফের আকার এবং রঙ দ্বিতীয় x-অক্ষের জন্য নির্দিষ্ট করা হয়েছে (জান, ফেব্রুয়ারি, মার্চ)। |
|
Font size, color, and alignment are specified for the right y-axis. Tick marks, but no axis line, are drawn. |
|
This chart includes three data sets, and shows three sets of axis labels, one per series. Each set of labels is formatted using a custom formatting string, as described here:
The axis label ranges are set using the |  chd=s: |


Axis Tick Mark Styles chxtc
You can specify long tick marks for specific axes. Typically this is used to extend a tick mark across the length of a chart. Use the chxs parameter to change the tick mark color.
Values for multiple axes should be separated using a pipe character ( | ). Values within a series should be separated by a comma.
বাক্য গঠন
chxtc=
  <axis_index_1>,<tick_length_1>,...,<tick_length_n>
    |...|
<axis_index_m>,<tick_length_1>,...,<tick_length_n>- < axis_index >
- The axis to which this applies. This is a zero-based index into the
chxtparameter. Separate values for different axes using a bar delimiter. - < tick_length_1 >,...,< tick_length_n >
- Length of the tick marks on that axis, in pixels. If a single value is given, it will apply to all values; if more than one value is given, the axis tick marks will cycle through the list of values for that axis. Positive values are drawn outside the chart area and cropped by the chart borders. The maximum positive value is 25. Negative values are drawn inside the chart area and cropped by the chart area borders.
উদাহরণ
| বর্ণনা | উদাহরণ |
|---|---|
Example of using
|
|
This chart demonstrates alternating tick lengths. chxtc specifies two tick length values for the y-axis (5 and 15), and the ticks drawn on the chart alternate between the two values. |  chxt=x,y |

Background Fills chf [ All charts ]
You can specify fill colors and styles for the chart data area and/or the whole chart background. Fill types include solid fills, striped fills, and gradients. You can specify different fills for different areas (for example, the whole chart area, or just the data area). The chart area fill overwrites the background fill. All fills are specified using the chf parameter, and you can mix different fill types (solids, stripes, gradients) in the same chart by separating values with pipe character ( | ). Chart area fills overwrite chart background fills.
Solid Fills chf [ All Charts ]
You can specify a solid fill for the background and/or chart area, or assign a transparency value to the whole chart. You can specify multiple fills using the pipe character ( | ). (Maps: background only).
বাক্য গঠন
chf=<fill_type>,s,<color>|...
- < fill_type >
- The part of the chart being filled. নিম্নলিখিত মানগুলির মধ্যে একটি নির্দিষ্ট করুন:
-
bg- Background fill -
c- Chart area fill. Not supported for map charts. -
a- Make the whole chart (including backgrounds) transparent. The first six digits of< color >are ignored, and only the last two (the transparency value) are applied to the whole chart and all fills. -
b <index>- Bar solid fills (bar charts only). Replace < index > with the series index of the bars to fill with a solid color. The effect is similar to specifyingchcoin a bar chart. See Bar Chart Series Colors for an example.
-
- s
- Indicates a solid or transparency fill.
- < color >
- The fill color, in RRGGBB hexadecimal format . For transparencies, the first six digits are ignored, but must be included anyway.
উদাহরণ
| বর্ণনা | উদাহরণ |
|---|---|
This example fills the chart background with pale gray ( |
|
This example fills the chart background with pale gray ( |
|
| This example applies a 50% transparency to the whole chart (80 in hexadecimal is 128, or about 50% transparency). Notice the table cell background showing through the chart. |
|


Gradient Fills chf [ Line, Bar, Google-o-meter, Radar, Scatter,Venn ]
You can apply one or more gradient fills to chart areas or backgrounds. Gradient fills are fades from a one color to another color. (Pie, Google-o-meter charts: background only.)
Each gradient fill specifies an angle, and then two or more colors anchored to a specified location. The color varies as it moves from one anchor to another. You must have at least two colors with different < color_centerpoint > values, so that one can fade into the other. Each additional gradient is specified by a < color >,< color_centerpoint > pair.
বাক্য গঠন
chf=<fill_type>,lg,<angle>,<color_1>,<color_centerpoint_1>
    ,...,
  <color_n>,<color_centerpoint_n>
- < fill_type >
- The chart area to fill. One of the following:
-
bg- Background fill -
c- Chart area fill. -
b <index>- Bar gradient fills (bar charts only). Replace < index > with the series index of the bars to fill with a gradient. See Bar Chart Series Colors for an example.
-
- এলজি
- Specifies a gradient fill.
- < angle >
- A number specifying the angle of the gradient from 0 (horizontal) to 90 (vertical).
- < color >
- The color of the fill, in RRGGBB hexadecimal format .
- < color_centerpoint >
- Specifies the anchor point for the color. The color will start to fade from this point as it approaches another anchor. The value range is from 0.0 (bottom or left edge) to 1.0 (top or right edge), tilted at the angle specified by < angle >.
উদাহরণ
| বর্ণনা | উদাহরণ |
|---|---|
Chart area has a horizontal linear gradient, specified with an angle of zero degrees ( The colors are peach ( The chart background is drawn in gray ( |
|
Chart area has a diagonal (bottom left to top right) linear gradient, specified with an angle of forty-five degrees ( Peach ( Blue ( The chart background is drawn in gray ( |
|
Chart area has a vertical (top to bottom) linear gradient, specified with an angle of ninety degrees ( Blue ( Peach ( The chart background is drawn in gray ( |
|


Striped fills chf [ Line, Bar, Google-o-meter, Radar, Scatter, Venn ]
You can specify a striped background fill for your chart area, or the whole chart. (Pie, Google-o-meter charts: background only.)
বাক্য গঠন
chf=
  <fill_type>,ls,<angle>,<color_1>,<width_1>
    ,...,
  <color_n>,<width_n>
- < fill_type >
- The chart area to fill. One of the following:
-
bg- Background fill -
c- Chart area fill -
b <index>- Bar striped fills (bar charts only). Replace < index > with the series index of the bars to fill with stripes. See Bar Chart Series Colors for an example.
-
- ls
- Specifies linear stripe fill.
- < angle >
- The angle of all stripes, relative to the y-axis. Use
0for vertical stripes or90for horizontal stripes. - < color >
- The color for this stripe, in RRGGBB hexadecimal format . Repeat < color > and < width > for each additional stripe. You must have at least two stripes. Stripes alternate until the chart is filled.
- < width >
- The width of this stripe, from
0to1, where1is the full width of the chart. Stripes are repeated until the chart is filled. Repeat < color > and < width > for each additional stripe. You must have at least two stripes. Stripes alternate until the chart is filled.
উদাহরণ
| বর্ণনা | উদাহরণ |
|---|---|
|  chf= |
|  chf= |
Grid Lines chg [ Line, Bar, Radar, Scatter ]
You can specify solid or dotted grid lines on your chart using the chg parameter.
This parameter doesn't let you specify the thickness or color of the lines. For more ways to make lines across your chart, see shape markers ( chm type h, H, v, or V), range markers ( chm ), and axis tick marks ( chxtc ).
বাক্য গঠন
chg=
  <x_axis_step_size>,<y_axis_step_size>,<opt_dash_length>,<opt_space_length>,<opt_x_offset>,<opt_y_offset>
- < x_axis_step_size >, < y_axis_step_size >
- Used to calculate how many x or y grid lines to show on the chart. 100 / step_size = how many grid lines on the chart. So: 20,25 would mean 5 vertical grid lines and 4 horizontal grid lines.
- < opt_dash_length >, < opt_space_length >
- [ Optional ] Used to define dashed grid lines. The first parameter is the length of each line dash, in pixels. The second parameter is the spacing between dashes, in pixels. Specify 0 for < opt_space_length> for a solid line. Default values are 4,1.
- < opt_x_offset >,< opt_y_offset >
- [ Optional ] The number of units, according to the chart scale, to offset the x and y grid lines, respectively. Can be positive or negative values. If you specify this value, you must also specify all preceding values. Default values are 0,0.
উদাহরণ
| বর্ণনা | উদাহরণ |
|---|---|
These examples use only the |  chg=20,50 chg=20,50 |
This example uses larger spaces to display lighter grid lines ( |  |
To display solid grid lines, specify zero ( This chart also specifies an x-axis offset of 10. |  chg=20,50,1,0,10 |
This chart demonstrates an x-axis offset of 10, and ay axis offset of 20. |  chg=20,50,3,3,10,20 |
Dynamic Icon Markers chem [ Bar, Line, Radar, Scatter ]
Create your chart, and specify one or more dynamic icons as chem values. The syntax of chem is as follows. All semicolon-delimited items in purple are optional, and any one can be omitted entirely in your URL. You can include multiple markers by including multiple syntax strings delimited by a | চরিত্র You can read more about dynamic icons on the dynamic icon page .
You can also embed a chart inside another chart as a dynamic icon. See the Embedded Charts subsection below.
chem=
  y;s=<icon_string_constant>;d=<marker_data_string>;ds=<which_series>;dp=<which_points>;py=<opt_z_order>;po=<x,y>;of=<x_offset,y_offset>
   |...|
  y;s=<icon_string_constant>;d=<marker_data_string>;ds=<which_series>;dp=<which_points>;py=<opt_z_order>;po=<x,y>;of=<x_offset,y_offset>
- s=< icon_string_constant >
- A string marker constant for a dynamic icon, from the dynamic icon page . This constant is almost the same as the
chstparameter for freestanding icons. But where the freestanding icon string starts with "d_", you should remove that prefix to get the equivalent dynamic icon marker. Example: freestanding icon:d_bubble_icon_text_small; equivalent dynamic icon marker:bubble_icon_text_small. - d=< marker_data_string >
- The data required for this particular marker type. This holds the same string that would be used in a
chldparameter for an equivalent freestanding icon, except that all | delimiters should be replaced by commas (remember to use commas instead of pipe markers for multiline text!). Note that within the data string, you must also escape the following characters with a @ mark: pipe ( | ) , at ( @ ) , equals ( = ), comma ( , ), semicolon ( ; ). Examples:hello@,+world,5@@10+cents+each. - ds=< which_series >
- [ Optional ] The zero-based index of the data series that this marker belongs to. Default value is 0.
- dp=< which_points >
- [ Optional ] Specifies which data points are used to draw markers. Default value is 0 (first point in the series) . নিম্নলিখিত ফর্ম্যাটগুলির মধ্যে একটি ব্যবহার করুন:
-
nd- Which data point to draw the marker on, where nd is the zero-based index in the series. If you specify a non-integer value, then the fraction indicates a calculated intermediate point. For example, 3.5 means halfway between point 3 and point 4. -
range,< start >,< end >,< step >- Draw a marker on every step data point in a range from start to end , inclusive. start and end are index values, and can be floating point numbers to indicate intermediate values. All values are optional; defaults are: start=0, end=last item, step=1. If you skip a value, you must still include any intermediate commas, but you don't have to include empty trailing commas. Examples:dp=range,0,4draws a marker on elements 0 through 4;dp=range,5,10,2draws a marker on elements 5, 7, and 9;dp=range,2draws points on the third point and later;dp=range,3,,1.5draws markers on every 1.5 data points from the fourth item to the last. -
all- Draw a marker on every element. This is equivalent torange,0, end_index. Example:dp=all -
every,n- Draw a marker on every n th marker. Example:dp=every,2draws a marker on items 0, 2, and 4.
-
- py=< z_order >
- [ Optional ] The layer on which to draw the marker, compared to other markers and all other chart elements. This is a floating point number from -1.0 to 1.0, inclusive, where -1.0 is the bottom and 1.0 is the top. Chart elements (lines and bars) are just below zero. If two markers have the same value, they are drawn in the order given by the URL. Default value is 0.0 (just above the chart elements).
- po=< x,y >
- [ Optional ] An absolute position on the chart at which to draw the marker. x and y are two floating point numbers, where 0.0,0.0 is the bottom left corner and 1.0,1.0 is the top right corner.
- of=< x_offset,y_offset >
- [ Optional ] A number of pixels to offset the icon from its normal position. x_offset and y_offset are positive or negative integers. It is important to specify this value in an embedded dynamic icon, because the marker will be centered vertically and horizontally over the point, which means that the point probably won't line up with the data marker. A good offset for an upright pin is
of=0,22; a good offset for a slanted pin is eitherof=-12,20orof=12,20depending on the direction of the slant, but you might have to experiment. Default value is 0,0.
উদাহরণ
| বর্ণনা | উদাহরণ |
|---|---|
| Here are examples of the same dynamic icon created as a free-standing image, and used as a marker in a line chart. Chart 1: Chart 2: |
|
Note that a dynamic icon marker will be centered on the point horizontally and vertically. So if you use a dynamic icon with a tail, the tail won't be on the chart point; the marker center will be. The first chart centers the mark on data point 3, which actually puts the tail a bit to the right of the mark on the line. The second chart uses the |  chem=y;chem=y; |
To include multiple dynamic icons, repeat the syntax string, delimited by a | চরিত্র This example shows a range, as well as two individual markers. Note how the vertical pins are offset by of 0,22, and the slanted pin has an offset of 12,20 to make the pin points line up with the series that they describe. |  chem= |
This demonstrates a multiline text marker. The marker must be offset after adding the text, because the bubble resizes to fit the text, causing it to be re-centered on the chart. Note how newlines in the text are indicated by commas in the d data string. |  chem=y; |


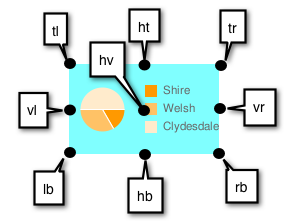
Embedded Charts
You can embed one chart inside another using the dynamic icon syntax.
There are two styles of embedded chart markers: embedded charts in a bubble, and embedded charts with no bubble. Here are examples of both:
 |  |
Chart with bubble | Chart without bubble |
Here are the specifics of the s=< icon_string_constant >;d=< marker_data_string > parameters, both for non-bubble and bubble-embedded charts (parameters covered above aren't described again here):
বাক্য গঠন
Non-bubble:
  chem=y;s=ec;d=<alignment_string>,<chart_data>;ds=<which_series>;dp=<which_points>;py=<z_order>;po=<x,y>;of=<x_offset,y_offset>

Bubble:
  chem=y;s=ecb;d=<frame_type>,<padding>,<frame_color>,<fill_color>,<chart_data>;ds=<which_series>;dp=<which_points>;py=<z_order>;po=<x,y>;of=<x_offset,y_offset>
- alignment_string
- [ Non-bubble only ] Which part of the bubble-less embedded chart is pinned to the data point. Choose one of the two-letter string constants in the following diagram:
- chart_data
- The data for the embedded chart. This is everything after
https://chart.googleapis.com/chart?in the URL of the chart to embed. Use the tool below, or follow the rules listed below the tool. - frame_type
- [ Bubble only ] One of the dynamic icon frame style constants .
- প্যাডিং
- [ Bubble only ] Padding inside the bubble, in pixels.
- frame_color
- [ Bubble only ] Color of the frame, as a six-digit HTML color string without the # mark. Example:
FF00FF. - fill_color
- [ Bubble only ] Bubble fill color, as a six-digit HTML color string without the # mark. Example:
FF00FF.
Embedded chart data
Use the following conversion tool to help generate your chart string, or else generate the chart string manually following the rules given after the tool.
Rules for manual conversion
1. First replace all the following characters in the parameter and value pairs with the following values, in the order shown:
| প্রতিস্থাপন করুন | এর সাথে |
|---|---|
%7C or %7c | | |
@ | @@ |
% | %25 |
, | @, |
| | @| |
; | @; |
এবং | %26 |
= | %3D |
2. Then replace all the & and = values in the parameter1=value1¶meter2=value2... pairs with commas.
Shape Markers chm [ Bar, Line, Radar, Scatter ]
You can specify graphical markers for all or individual data points on a chart. If two or more markers occupy the same point, the markers are drawn in the order in which they appear in the chm parameter. You can also create text markers on data points, which is covered in Data Point Markers .
You can combine shape markers with any other chm parameters using a pipe character ( | ) to separate the chm parameters.
বাক্য গঠন
Specify one set of the following parameters for each series that should be marked. To mark multiple series, create additional parameter sets, delimited by a pipe character. You do not need to mark up all series. If you do not assign markers to a data series, it will not get any markers.
Shape markers behave slightly differently in scatter charts . See that documentation for more information.
chm=
  [@]<marker_type>,<color>,<series_index>,<opt_which_points>,<size>,<opt_z_order>,<opt_offset>
    |...|
  [@]<marker_type>,<color>,<series_index>,<opt_which_points>,<size>,<opt_z_order>,<opt_offset>
- @
- [ Optional ] If you precede the marker type with the optional @ character, then < opt_which_points > should use the x:y format.
- <marker_type>
- The type of marker to use. Specify one of the following types:
-
a- Arrow -
c- Cross -
C- Rectangle. If a rectangle marker, you must have at least two data series, where series 0 specifies the bottom edge and series 1 specifies the top edge. < size > specifies the width of the rectangle, in pixels. -
d- Diamond -
E- Error-bar marker ( ) This marker requires two data series to create, one value for the bottom, and the corresponding point in the second series for the top. It also exposes an extended < size > syntax: line_thickness [: top_and_bottom_width ] where top_and_bottom_width is optional. নীচের উদাহরণ দেখুন.
 -
h- Horizontal line across the chart at a specified height. ( The only valid format for < opt_which_points > parameter is nd . ) -
H- Horizontal line through the specified data marker. This supports an extended < size > syntax that lets you specify an exact line length: line_thickness [: length ] where : length is optional, and defaults to the full chart area width. -
o- Circle -
s- Square -
v- Vertical line from the x-axis to the data point -
V- Vertical line of adjustable length. This supports an extended < size > value syntax that lets you specify an exact line length: line_thickness [: length ] where : length is optional, and defaults to the full chart area height. The marker is centered on the data point. -
x- An X
-
- < color >
- The color of the markers for this series, in RRGGBB hexadecimal format .
- < series_index >
- The zero-based index of the data series on which to draw the markers. Ignored for
hmarkers and markers that specify location by x/y position (start with the @ character). You can use hidden data series as a source for markers; see Compound Charts for more information. Grouped vertical bar charts support a special extended syntax to align markers with specific bars. - < opt_which_points >
- [ Optional ] Which point(s) to draw markers on. Default is all markers. নিম্নলিখিত মানগুলির মধ্যে একটি ব্যবহার করুন:
-
nd- Where to draw the marker. The meaning depends on the marker type:- All types except h - Which data point to draw the marker on, where nd is the zero-based index in the series. If you specify a non-integer value, then the fraction indicates a calculated intermediate point. For example, 3.5 means halfway between point 3 and point 4.
-
h- A number from 0.0 to 1.0, where 0.0 is the bottom of the chart, and 1.0 is the top of the chart.
-
-1- Draw a marker on all data points. You can also leave this parameter empty to draw on all data points. -
- n- Draw a marker on every n -th data point. Floating point value; if n is less than 1 the chart will calculate additional intermediary points for you. For example, -0.5 will put twice as many markers as data points. -
start:end:n- Draw a marker on every n -th data point in a range, from start to end index values, inclusive. All parameters are optional (may be absent), so 3::1 would be from the fourth element to the last, step 1, and omitting this parameter entirely would default to first : last :1. All values can be floating point numbers. start and end can be negative, to count backward from the last value. If both start and end are negative, be sure that they are listed in increasing value (for example, -6:-1:1). If the n step value is less than 1, it will calculate additional data points by interpolating the data values given. Default values are first:last:1 -
x : y- Draw a marker at a specific x/y point on the chart. This point does not have to be on a line. Add the @ character before the marker type to use this option. Specify the coordinates as floating point values, where0:0is the bottom left corner of the chart and1:1is the top right corner of the chart. For example, to add a red, 15-pixel diamond to the center of a chart, use@d,FF0000,0,0.5:0.5,15.
-
- < size >
- The size of the marker, in pixels. Most take a single number value for this parameter; the V, H, and S markers support the syntax < size >[: width ] where the optional second part specifies the line or marker length.
- < opt_z_order >
- [ Optional ] The layer on which to draw the marker, compared to other markers and all other chart elements. This is a floating point number from -1.0 to 1.0, inclusive, where -1.0 is the bottom and 1.0 is the top. Chart elements (lines and bars) are just lower than zero. If two markers have the same value, they are drawn in the order given by the URL. Default value is 0.0 (just above the chart elements).
- < opt_offset >
- [ Optional ] Let you specify horizontal and vertical offsets from the specified location. Here is the syntax, which uses a : delimiter:
reserved :< horizontal_offset >:< vertical_offset >. If specified, you can include an empty ,, value in thechmparameter string for < opt_z_order >. Examples:o,FF9900,0,4,12,, :10 o,FF9900,0,4,12.0,, :-10:20 o,FF9900,0,4,12,1, ::20- reserved - Leave blank.
-
< horizontal_offset >- A positive or negative number specifying the horizontal offset, in pixels. ঐচ্ছিক; leave blank if not used. -
< vertical_offset >- A positive or negative number specifying the vertical offset, in pixels. ঐচ্ছিক; leave blank if not used.
উদাহরণ
| বর্ণনা | উদাহরণ |
|---|---|
Here's an example of several of the shape and line markers.
|  chm= |
Here's an example using diamonds for one data series, and circles for the other data series. If two or more markers occupy the same point, the markers are drawn in the order in which they appear in the |  chm= |
Here's a line chart with a marker on every second data point (-2 means every other point). |  chd=t: |
| Here's a line chart with twice as many markers as data points (-0.5 means every half point). |  chd=t: |
This example shows how to use h and v markers to create grid lines with custom colors and thickness. The z-order value (the last value) is set to -1 so that the grid lines are drawn beneath the data line. |  chm= |
This chart adds vertical fill lines to a line chart:
|  chm= |
| This example adds an arrow and text marker to the chart using exact coordinates. The first D marker is the trace line under the bars. The second marker is the arrow, and the third marker is the arrow text. |  chm= |
A horizontal line fixed to a specific data point ( H ) can be useful for showing relative values, or emphasizing the height of a data value on a chart. |  chm=H,FF0000,0,18,1 |
This graph demonstrates the markers that can specify line thickness and length in the < size > parameter.
| title="cht=lc&chd=s:2gounjqLaCf,jqLaCf2goun&chco=008000,00008033&chls=2.0,4.0,1.0&chs=250x150&chm=H,990066,1,2,5:50%7CV,3399CC,0,8,3:50%7CE,000000,0,6,1:20" src="/chart/image/images/chart_95.png" />chm= |
Text and Data Value Markers chm [ Bar, Line, Radar, Scatter ]
You can label specific points on your chart with custom text, or with formatted versions of the data at that point.
You can combine any chm markers using a pipe character ( | ) to separate the chm parameter sets.
A note on string values: Only URL-safe characters are permitted in label strings. To be safe, you should URL-encode any strings containing characters not in the character set 0-9a-zA-Z . You can find a URL encoder in the Google Visualization Documentation .
বাক্য গঠন
Specify one set of the following parameters for each series that should be marked. To mark multiple series, create additional parameter sets, delimited by a pipe character. You do not need to mark up all series. If you do not assign markers to a data series, it will not get any markers.
chm=
  <marker_type>,<color>,<series_index>,<opt_which_points>,<size>,<opt_z_order>,<opt_placement>
    |...|
  <marker_type>,<color>,<series_index>,<opt_which_points>,<size>,<opt_z_order>,<opt_placement>
- <marker_type>
- The type of marker to use. You can choose from the following types:
-
f<text>- A flag containing text. Specify the character 'f', followed by custom URL-encoded text. To escape commas in text markers, precede the comma by a \ mark. Example:fHello\,+World! -
t<text>- A simple text marker. Specify the character 't' followed by custom URL-encoded text. To escape commas in text markers, precede the comma by a \ mark. Example:tHello\,+World! -
A< text >- An annotation marker. This is similar to a flag marker, but markers will coordinate their position so that they do not overlap. The only valid format for < opt_which_points > is nd , to signify the index of a point in the series. -
N< formatting_string >- The value of the data at this point, with optional formatting. If you do not use thechdsparameter (custom scaling) it gives the exact encoded value; if you do use that parameter with any format type the value will be scaled to the range that you specify. See an example ofchdswith numeric markers below. With this marker type in a stacked bar chart , if you specify -1 for < series_index > you will get a marker that shows the sum of all values in this stacked bar. The formatting string syntax is as follows:
< preceding_text >*< number_type >< decimal_places >zs< x or y >*< following_text >.
All of these elements are optional. Here is the meaning of each element:-
<preceding_text>- Text to precede each value. -
*...*- An optional block wrapped in literal asterisks, in which you can specify formatting details for numbers. The following values are supported, and are all optional:-
<number_type>- The number format, for numeric values. নিচের কোনো একটি পছন্দ কর:-
f- [ Default ] Floating point format. Consider specifying precision as well with the < decimal_places > value. -
p- Percentage format. A % sign is appended automatically. Note: When using this format, data values from 0.0 — 1.0 map to 0 — 100% (for example, 0.43 will be shown as 43%). -
e- Scientific notation format. -
c< CUR >- Format the number in the currency specified, with the appropriate currency marker. Replace< CUR >with a three-letter currency code. Example:cEURfor Euros. You can find a list of codes on the ISO web site , although not all symbols are supported.
-
-
<decimal_places>- An integer specifying how many decimal places to show. The value is rounded (not truncated) to this length. Default is 2. -
z- Display trailing zeros. Default is no . -
s- Display group separators. Default is no . -
xory-Display the data from the x- or y-coordinate, as specified. The meaning of x data varies by chart type: experiment with your chart to determine what it means. Default is 'y' .
-
-
< following_text >- Text to follow each value.
-
-
- < color >
- The color of the markers for this set, in RRGGBB hexadecimal format .
- < series_index >
- The zero-based index of the data series on which to draw the markers. If this is a stacked bar chart and the marker type is N (data point values), you can specify -1 to create a summed value marker for each stack of bars. একটি উদাহরণ জন্য নিচে দেখুন।
- < opt_which_points >
- [ Optional ] Which point(s) to draw markers on. Default is all markers. নিম্নলিখিত মানগুলির মধ্যে একটি ব্যবহার করুন:
-
nd- Which data point to draw the marker on, where nd is the zero-based index in the series. If you specify a non-integer value, then the fraction indicates a calculated intermediate point. For example, 3.5 means halfway between point 3 and point 4. -
-1- Draw a marker on all data points. You can also leave this parameter empty to draw on all data points. -
-n- Draw a marker on every n -th data point. -
start : end : n- Draw a marker on every n -th data point in a range, from start to end index values, inclusive. All parameters are optional (may be absent), so 3::1 would be from the fourth element to the last, step 1, and omitting this parameter entirely would default to first : last :1. All values can be floating point numbers. start and end can be negative, to count backward from the last value. If both start and end are negative, be sure that they are listed in increasing value (for example, -6:-1:1). If the n step value is less than 1, it will calculate additional data points by interpolating the data values given. Default values are first:last:1 -
x : y- [ Not supported for N-type markers ] Draw a marker at a specific x/y point on the chart. This point does not have to be on a line. Add the at character (@) before the marker type to use this option. Specify the coordinates as floating point values, where0:0is the bottom left corner of the chart,0.5:0.5is the center of the chart, and1:1is the top right corner of the chart. For example, to add a red, 15-pixel diamond to the center of a chart, use@d,FF0000,0,0.5:0.5,15.
-
- < size >
- The size of the marker in pixels. If this is a scatter chart with a third data series (used to specify point sizes), this value will be scaled by the data range. So if the data range is 0—100 and < size > is 30, a data value of 100 would be 30 pixels wide, a data value of 50 would be 15 pixels wide, and so on.
- < opt_z_order >
- [ Optional ] The layer on which to draw the marker, compared to other markers and all other chart elements. This is a floating point number from -1.0 to 1.0, inclusive, where -1.0 is the bottom and 1.0 is the top. Chart elements (lines and bars) are just lower than zero. If two markers have the same value, they are drawn in the order given by the URL. Default value is 0.0 (just above the chart elements).
- < opt_placement >
- [ Optional ] Additional placement details describing where to put this marker, in relation to the data point. You can specify horizontal and/or vertical relative positioning, as well as offsets. Placement syntax is a string with : delimiters as shown here. All elements are optional:
< horizontal_and_vertical_justification >:< horizontal_offset >:< vertical_offset >. If specified, you can include an empty ,, value in thechmparameter string for < opt_z_order >. Examples:N,000000,0,1,10,,bandN,000000,0,1,10,,lvandN,000000,0,1,10,,r::10.- horizontal_and_vertical_justification
- The anchor point of the marker. This behaves opposite to justification, so a left anchor actually puts the marker to the right of the data point. You can choose a horizontal and/or vertical justifier from the following list:
- Horizontal placement : 'l', 'h', or 'r' - Left, center, or right-anchored, horizontally. Default is 'l'.
- Vertical placement : 'b', 'v', 't' - Bottom, middle, or top-anchored, vertically. Default is 'b'.
- Bar-relative placement [ Bar charts only] : 's', 'c', 'e' - Base, center, or top of a bar. For stacked charts, this is relative to the section of the bar for each series, not for the whole bar. If the series index given is -1 (stack total) it is in relation to the whole bar. This can be combined with vertical placement values: for example, 'be' or 'vs'. Default value is 'e'.
- horizontal_offset
- A horizontal offset for this marker, in pixels. Default is 0.
- vertical_offset
- A vertical offset for this marker, in pixels. Non-bar chart default: 15; bar chart chart default: 2 .
| বর্ণনা | উদাহরণ | |
|---|---|---|
Here's an example of value labels on a bar chart. The first chart ( The second chart ( |
| |
You can use the This example shows a chart with simple-encoded values of 46, 39, 29, 30, 43, 41. Simple encoding range is 0—61 . The |  chd=s:underp | |
Here's an example of a chart with a text label at the minimum point and a flag label at the maximum point. |
| |
| This example shows a stacked chart with values for individual series, plus the series total. To show the stacked series values, we must use the 'c' positioning option; if we did not, the top bar value would overlap the sum value at the top of each bar. |  chm= | |
| Some more demonstrations of how vertical and horizontal placement work. This example demonstrates various combinations of anchor values for bar charts (which use s, c,and e for vertical placement). Note how a right anchor moves a marker left, and a top anchor moves a marker down, and vice-versa. The red dots show the base, center, and top of each bar. The number is the data value, fixed using different anchor values for each bar. |  chm= | |
Annotation markers automatically adjust the label position so that they don't overlap. The first chm value is for the line fill, the following values are all annotation markers. |  chm=B,C5D4B5BB,0,0,0 | |
| Another annotation marker example demonstrating city altitudes in Switzerland. |  | |


Range Markers chm [ Bar, Candlestick, Line, Radar, Scatter ]
You can color horizontal or vertical bands of background fill to highlight specific areas of a chart.
You can combine any chm markers using a pipe character ( | ) to separate the chm parameter sets.
বাক্য গঠন
Specify one set of the following parameters for each band to draw. To draw multiple bands, create additional parameter sets, delimited by a pipe character. Ranges are drawn in the order specified, so the last range drawn will be drawn on top of previous ranges.
chm=
  <direction>,<color>,0,<start_point>,<end_point>
    |...|
  <direction>,<color>,0,<start_point>,<end_point>
- <direction>
- Specifies horizontal or vertical shading. Use
rfor a horizontal range andRfor a vertical range. - < color >
- The range color as an RRGGBB format hexadecimal number .
- 0
- Reserved — must be zero.
- < start_point >
- The start position of the range.
- For horizontal range markers, this is a position on the y-axis, where
0.00is the bottom of the chart, and1.00is the top of the chart. - For vertical range markers, this is a position on the x-axis, where
0.00is the left of the chart, and1.00is the right of the chart.
- < end_point >
- The end position of the range.
- For horizontal range markers, this is a position on the y-axis, where
0.00is the bottom of the chart, and1.00is the top of the chart. - For vertical range markers, this is a position on the x-axis, where
0.00is the left of the chart, and1.00is the right of the chart.
উদাহরণ
| বর্ণনা | উদাহরণ |
|---|---|
Range markers can be a thin line or a band of color.
|  |
This example shows the vertical range markers. The first marker is a red line ( |  |
Markers are drawn in the order specified. In this example, you can see that the vertical red marker was drawn before the pale blue horizontal marker. |  chm= |
Here's an example of a line chart that uses range markers to draw faint horizontal lines across the chart at the zero line, midpoint line, and top. |  |
Line Markers chm=D [ Bar, Candlestick, Line, Radar, Scatter ]
You can add a line that traces data in your chart. Most often, this is used in compound charts .
To add multiple lines (or combine this with any other chm markers), separate the chm parameter sets using a pipe ( | ) delimiter. You cannot make a dashed line marker with this parameter.
বাক্য গঠন
chm=
  D,<color>,<series_index>,<which_points>,<width>,<opt_z_order>
- ডি
- Indicates that this is a line marker.
- < color >
- The color of the line, in RRGGBB hexadecimal format .
- < series_index >
- The index of the data series used to draw the line. The data series index is
0for the first data series,1for the second data series, and so on. - < which_points >
- Which points in a series to use to draw the line. নিম্নলিখিত মানগুলির মধ্যে একটি ব্যবহার করুন:
-
0- Use all the points in the series. -
start:end- Use a specific range of points in the series, from the start to end , inclusive (zero-based index). You can also use floating point values to specify intermediate points, or leave start or end blank to indicate the first or last data point, respectively. start and end can be negative, as a reverse index from the last value. If both start and end are negative, be sure to write them in increasing value (for example, -6:-1).
-
- < size >
- The width of the line in pixels.
- < opt_z_order >
- [ Optional ] The layer on which to draw the marker, compared to other markers and all other chart elements. This is a floating point number from -1.0 to 1.0, inclusive, where -1.0 is the bottom and 1.0 is the top. Chart elements (lines and bars) are just lower than zero. If two markers have the same value, they are drawn in the order given by the URL. Default value is 0.0 (just above the chart elements).
উদাহরণ
| বর্ণনা | উদাহরণ |
|---|---|
This is an example of drawing a marker line on a bar chart. The z-order is set to |  chm=D,0033FF,0,0,5,1 |
This is the same bar chart, but with an additional data series just for the line. This is an example of a compound chart. Compound charts are drawn by adding additional data series to the See Compound Charts for more information. |  chm=D,0033FF,1,0,5,1 |
Data Functions chfd [ All chd charts ]
You can specify a custom function to run over chart data using muParser function syntax . The data used in the function can come from one of two sources:
- A data series from
chd- The data is pulled from the specified series inchd. - A range of values declared in the
chfdparameter itself - You declare a start, stop, and step value for an arbitrary data range.
It is important to note that in all cases you must assign the output to an existing series in chd ; that series will be overwritten by the function output. The chart is rendered only after all functions have been processes, so if you assign multiple functions to output to the same data series, the functions will be run in the order given, but only the output of the final function will be plotted on the chart. Note that you can chain functions, so that one function can take as input a series that was output by a previous function.
To assign colors or chm markers to a function line, assign the colors or markers to the function's series index. Note that markers are placed according to the data after it has been manipulated by the function.
বাক্য গঠন
chfd=
  <output_series_index>,<function_data>,<function_string>
    |...|
<output_series_index>,<function_data>,<function_string>- < output_series_index >
- Zero-based index of a data series in
chdto which the function output will be written. Any existing data will be completely overwritten by the function output. If a series is not being used as input for a function, best practice is to assign a single dummy value to that series. - < function_data >
- The variables and data to plot. The data can be from a range that you define, or from one of the
chddata series. You can specify multiple variables for each function, using a ; (semicolon) delimiter for multiple variables. Note that if you define multiple variables for a single function, and these variables have a different number of points, the function will stop when it reaches the first endpoint. For example, if a function defines both x=1—5 step 1 and y=1—10 step 1, the function will end when it reaches the fifth point.
< variable_name >,< input_series_index >বা
< variable_name >,< start >,< end >,< step >- variable_name - An arbitrary string name for the variable. Use this in the function defined by function_string .
- input_series_index - The index of a
chddata series to use as input data. - start - The numeric start value of a range.
- end - The numeric end value of a range.
- step - The numeric step value from start to end . Can be positive or negative, but cannot be zero.
x,0,100,1declares a variable namedxwith values 0, 1, 2, ... 100.x,0,100,1;r,0,3.1,.1declares the samexvariable plus a variable namedrwith values 0, 0.1, 0.2, ..., 3.0, 3.1.x,0declares a variable named x that uses the data from the firstchdseries. These variables will be used by function_string . They will not be plotted on the graph unless you specify them in function_string . The smaller the step, the smoother your graph. - < function_string >
- Your function, written in the muParser syntax . The function is applied to the variables and data specified in variable_data . You can only reference the variables declared in this local function set, not in another piped set of
chfdparameters. Summary muParser functions are not supported (min, max sum, avg). IMPORTANT: Remember to use%2Binstead of+in your functions!
উদাহরণ
| বর্ণনা | উদাহরণ |
|---|---|
A simple sine wave. Some things to notice:
| *50%2b50&chxt=x,y") cht=lc |
This line uses data from the chd parameter. |  chd=t:5,10 |
A mix of function and non-function lines. Notice how the colors are specified by the series color parameter Notice the placement of markers on the function output; the data points are calculated from start , end , and step , so if your range is 0—11 step 0.1, point 0 is 0, point 1 is 0.1 and so on, until point 110, which has a value of 11. | *50%2B50&chxt=x,y&chm=c,00A5C6,0,110,10|a,00A5C6,0,60,10") chd=t: |
To define a function in two dimensions, use an
| *50%2B50|1,y,0,10,0.1,cos(y)*50%2B50") cht=lxy |
The Try clicking these images to open and play with them in the chart playground; you'll get hooked! | |


*(exp(cos(t))-2.0*cos(4.0*t)-sin(t/12.0)^5)*20|1,t,0,100,.05,cos(t)*(exp(cos(t))-2.0*cos(4.0*t)-sin(t/12.0)^5.0)*20-10&chf=c,lg,90,FFE7C6,0,76A4FB,1|bg,s,EFEFEF&chxt=x,y&chxs=0,000000,0,0,_|1,000000,0,0,_")
*50%2b50|1,y,0,360,.1,cos(y)*50%2b50&chco=FFFF10&chf=bg,lg,90,000000,0,FFFFFF,.5,000000,1")
*40%2b50|1,y,0,180,1.4,cos(3*y)*40%2b50")
*40%2b50|1,y,0,360,1.9,cos(6*y)*40%2b50&chf=c,lg,90,FFFF00,0,FF9933,1&chco=006699")