
Google Cloud Logging provides extensive log-based metrics that you can use to gain insights into your Google Maps Platform Last Mile Fleet Solution apps. Log-based metrics are based on the content of log entries. For example, the metrics can record the number of log entries containing particular messages, or they can extract latency information reported in log entries. You can use log-based metrics in Cloud Monitoring charts and alerting policies.
System-defined log-based metrics provided by Cloud Logging are calculated from logs that have been ingested by Logging. If a log has been explicitly excluded from ingestion by Logging, it isn't included in these metrics.
This document provides information on how to drill down into logs to gain insights on your Deliveries API implementation, including:
Using the Logs Explorer
You can use the Logs Explorer to filter logs in various ways to help you gain insights into how your Google Maps Platform Last Mile Fleet Solution apps are performing. For example, you can filter logs in the following ways:
- By delivery vehicle ID
- By task ID
- For a vehicle over a specific time period
For more information, see Using the Logs Explorer.
Using alerts
You can also create alerts to notify customers when a metric falls out of a certain threshold, and specify notification channels for alerts.
Creating a notification channel
You can create a notification channel that will indicate who should be notified of an alert and how. Notification channels can include mobile devices, pagers, Slack, email, Pub/Sub, and other channels.
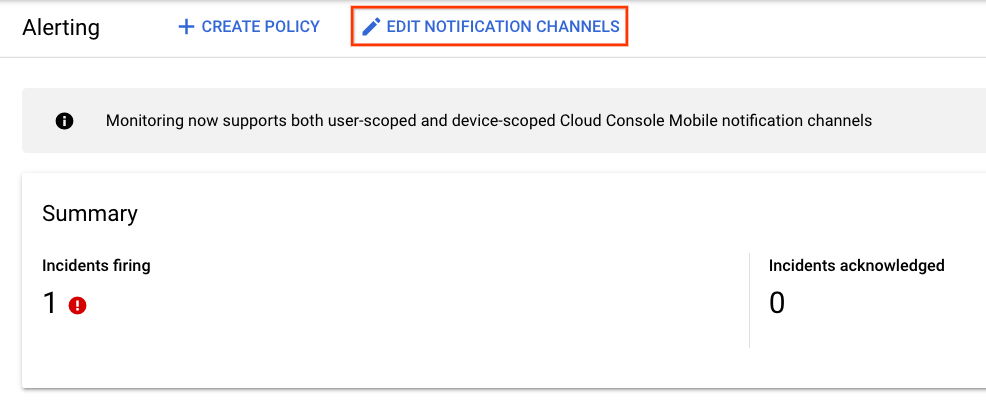
To create a notification channel, select Monitoring and then Alerting in the Cloud Console to open the Alerting page. Then select Edit Notification Channels near the top of the page.
For more information, see Managing notification channels.
Creating an alert example
The following example shows how to create an alert when the billable_tasks metric created in the previous example falls below a specified threshold.
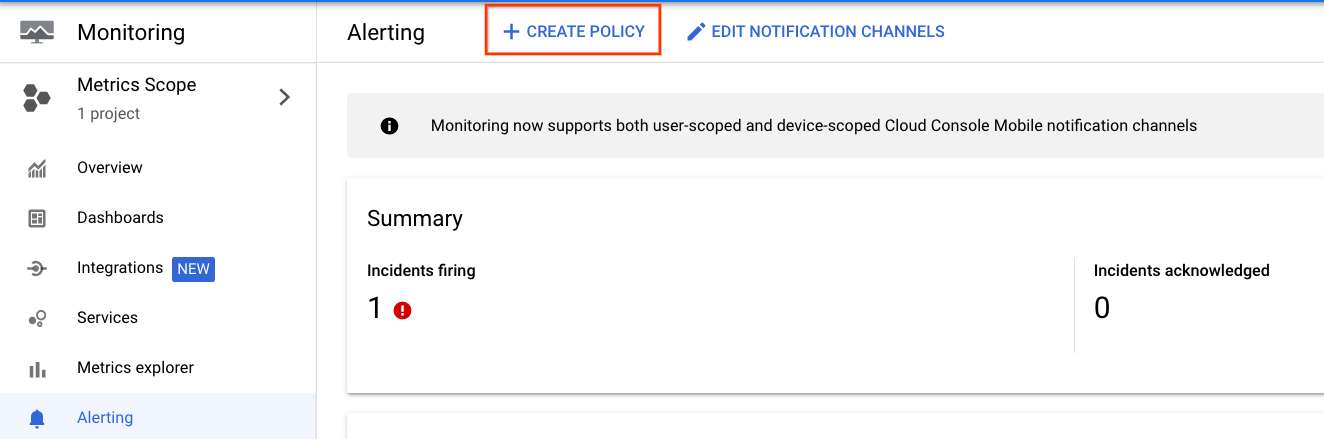
In the Cloud Console, select Monitoring and then Alerting to open the Alerting page. Then select Create Policy near the top of the page.
On the Create alert policy page, select Add Condition.
In the Add Condition dialog:
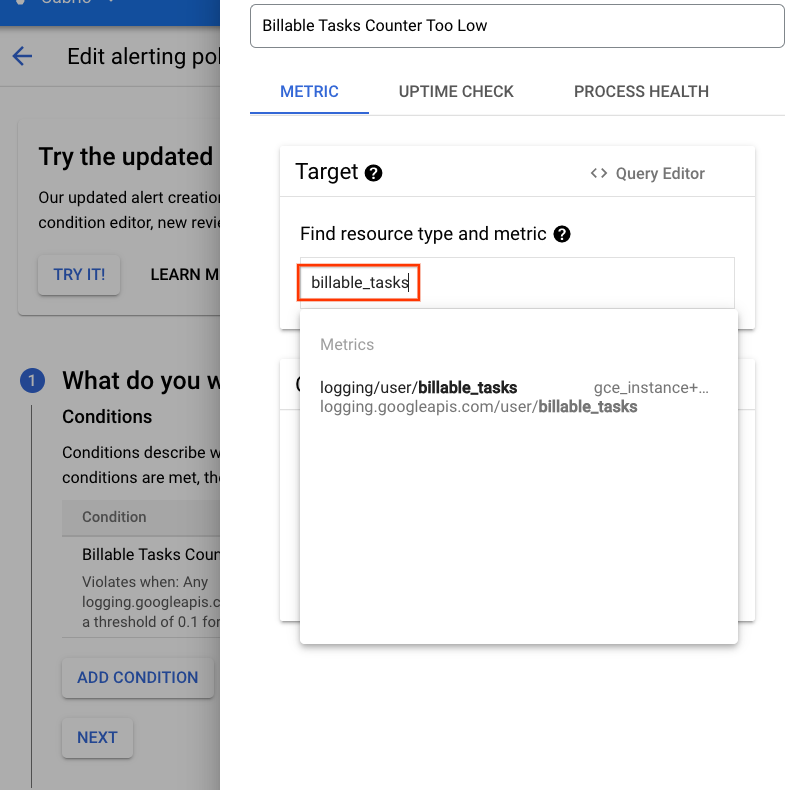
- Specify an alert name (for example, Billable Tasks Counter Too Low).
For a Target, start typing billable_tasks. It should auto-complete to the Logs-based metric created in the previous example. Select the metric from the drop-down. (The full metric name is logging/user/billable_tasks.)
The Metric Target information should populate and you should see the metric graph on the right.
Scroll down to the Configuration section on the left and set the alert parameters. (for example set
Conditionto is below,Thresholdto 0.1, andForto 5 minutes.) When you set the threshold, a red line should appear on the metric chart showing the alert threshold relative to the current value.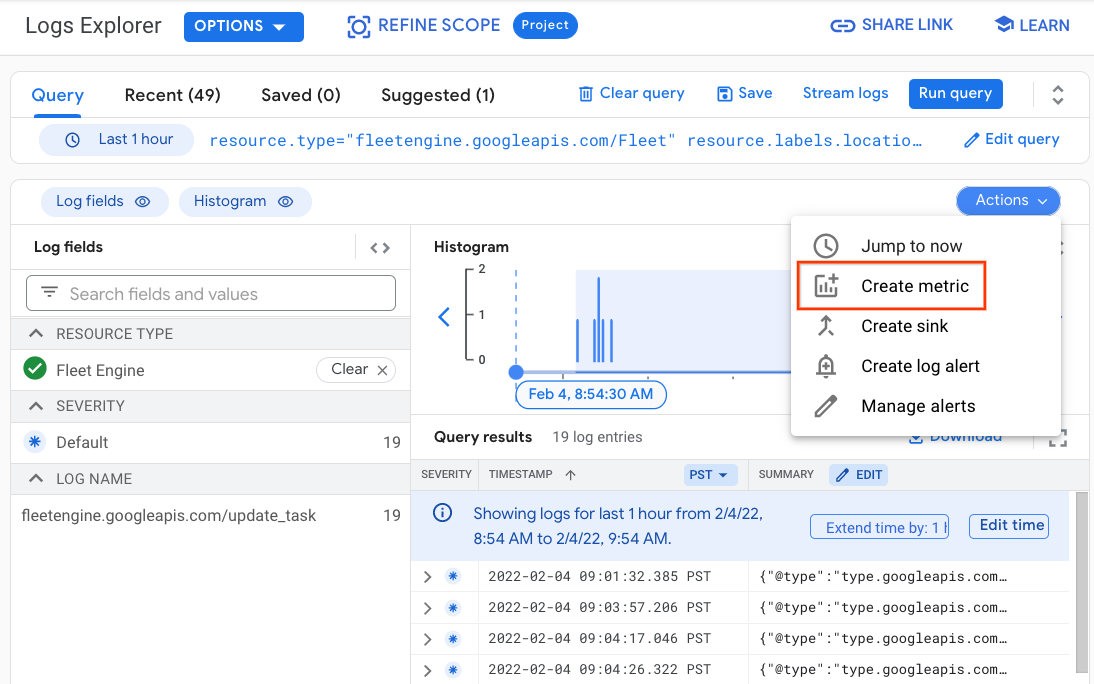
Click the Add button.
Return to the Creating alert policy page and select Next.
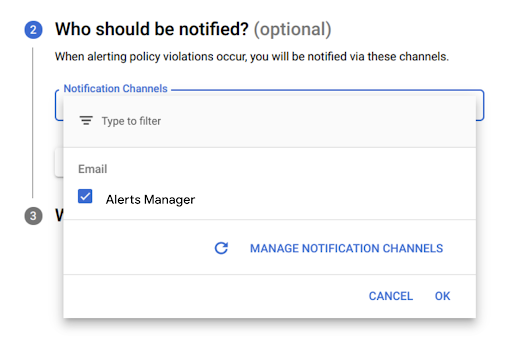
Optionally, set the notification channel contact when the alert is triggered. Then select Next.
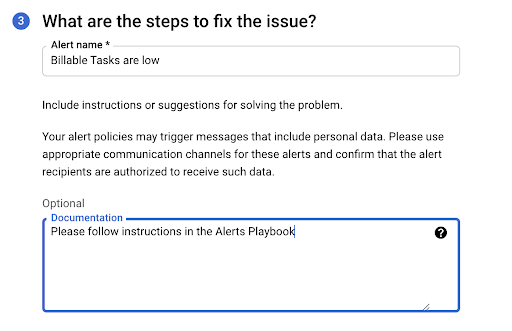
Add instructions for how to fix the issue. The instructions will be included in the body of the alert notification. Then click Save.
Your alert should now be live. If it triggers, it will appear on the Alerting page.
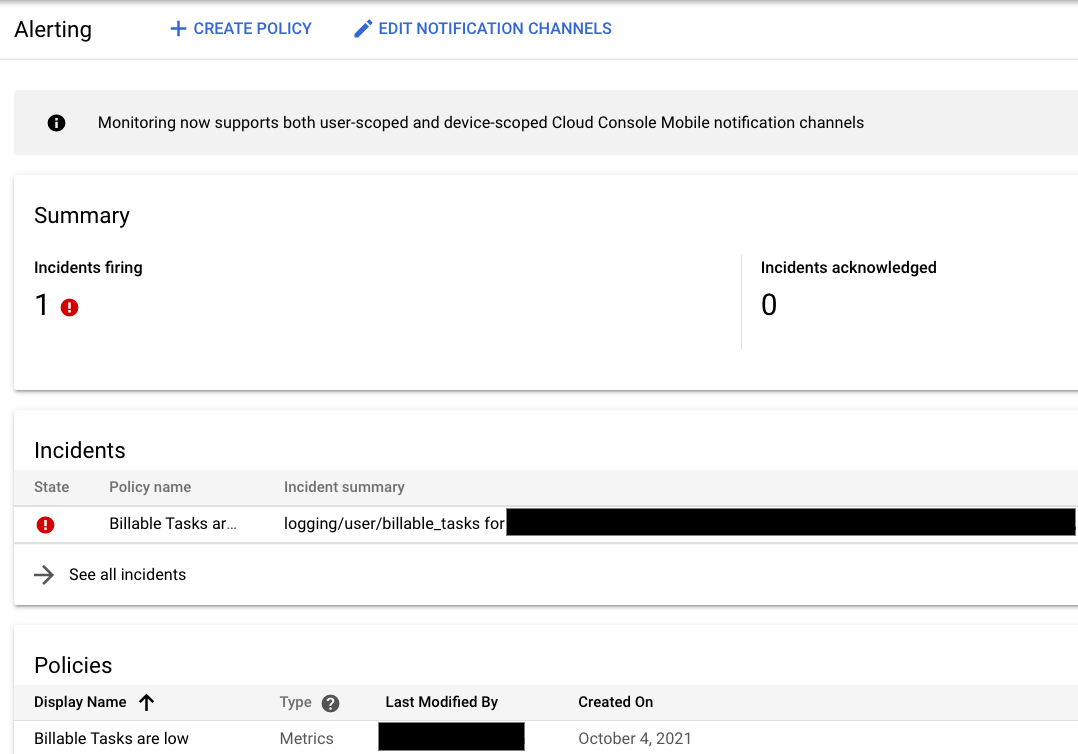
If a notification channel was selected, it will be notified.
Using BigQuery
BigQuery is a powerful tool for performing analytics. It can be used to store longer-term logs and to perform ad-hoc SQL-like queries against the data.
For example, you can create:
- A query that counts the number of CreateTasks logs, and groups them by hour.
- A query that counts the number of stops per vehicle per hour.
- A query that shows the first delivery success rate.
For more information, see Using BigQuery.