Troubleshoot worklets and observe Protected Audience API events.
From Chrome Canary 98.0.4718.0, it's possible to debug the Protected Audience API and Protected Audience API worklets in Chrome DevTools.
Read the developer guide for the full life cycle of the Protected Audience API. Not a developer? Refer to the Protected Audience API overview.
Protected Audience API worklets
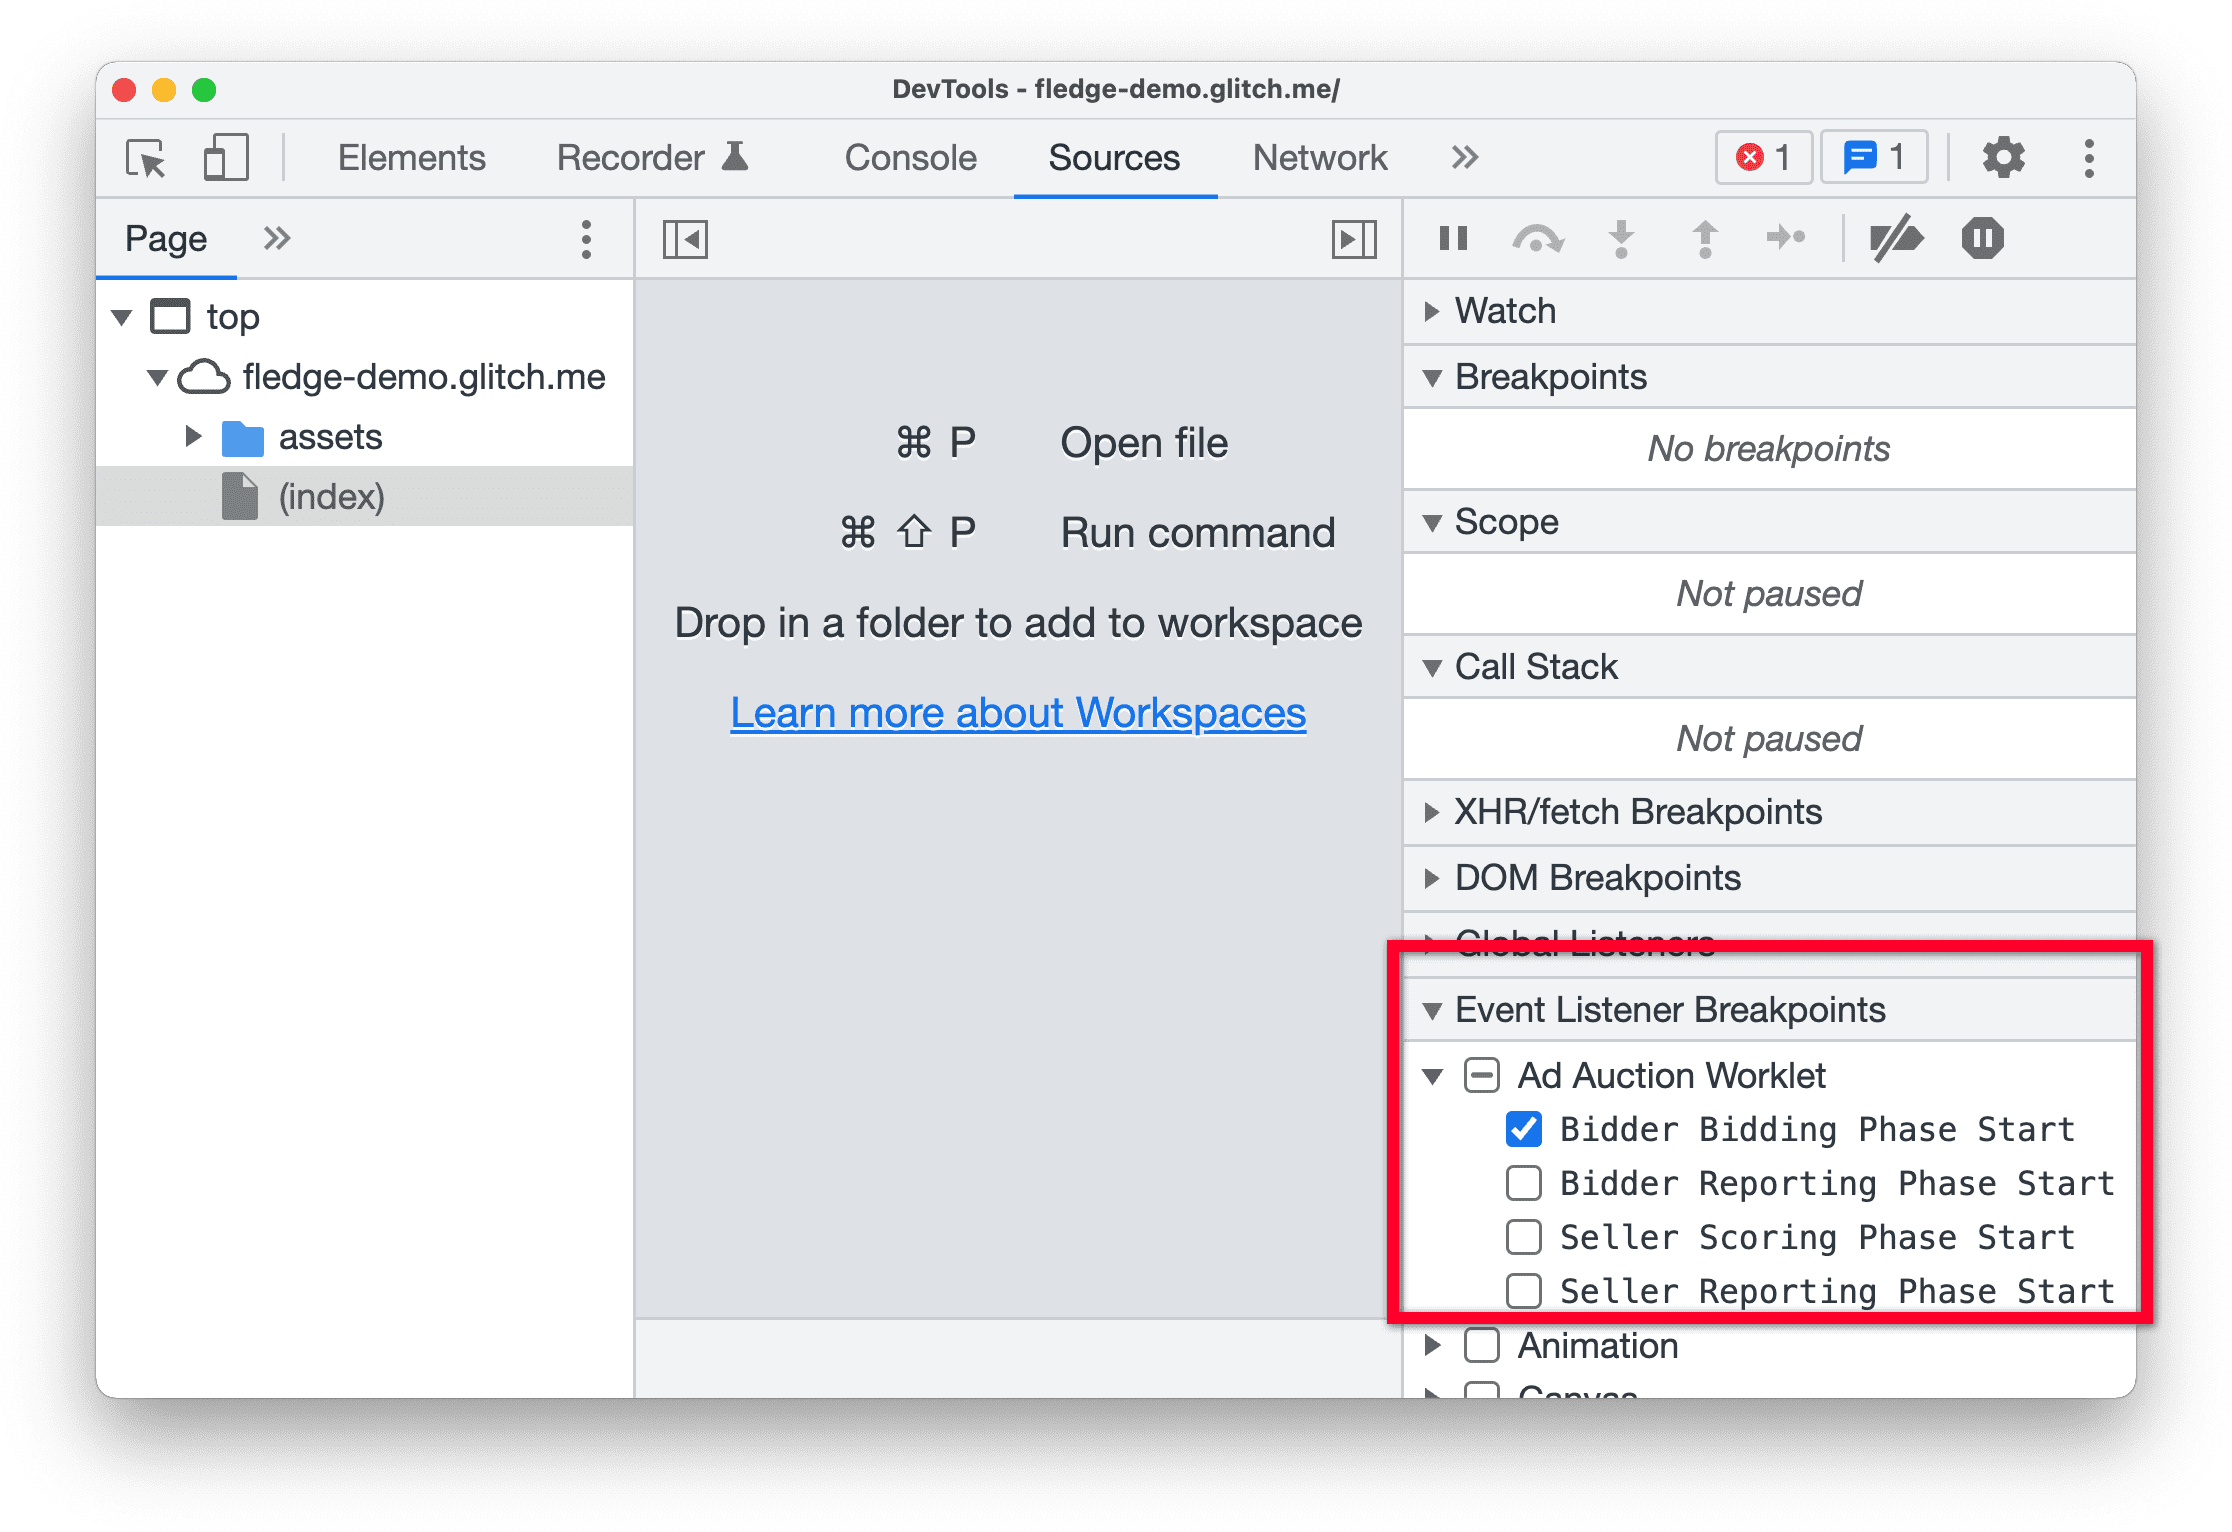
The first step is to set breakpoints via a new category in the Event Listener Breakpoints pane in the Sources panel.

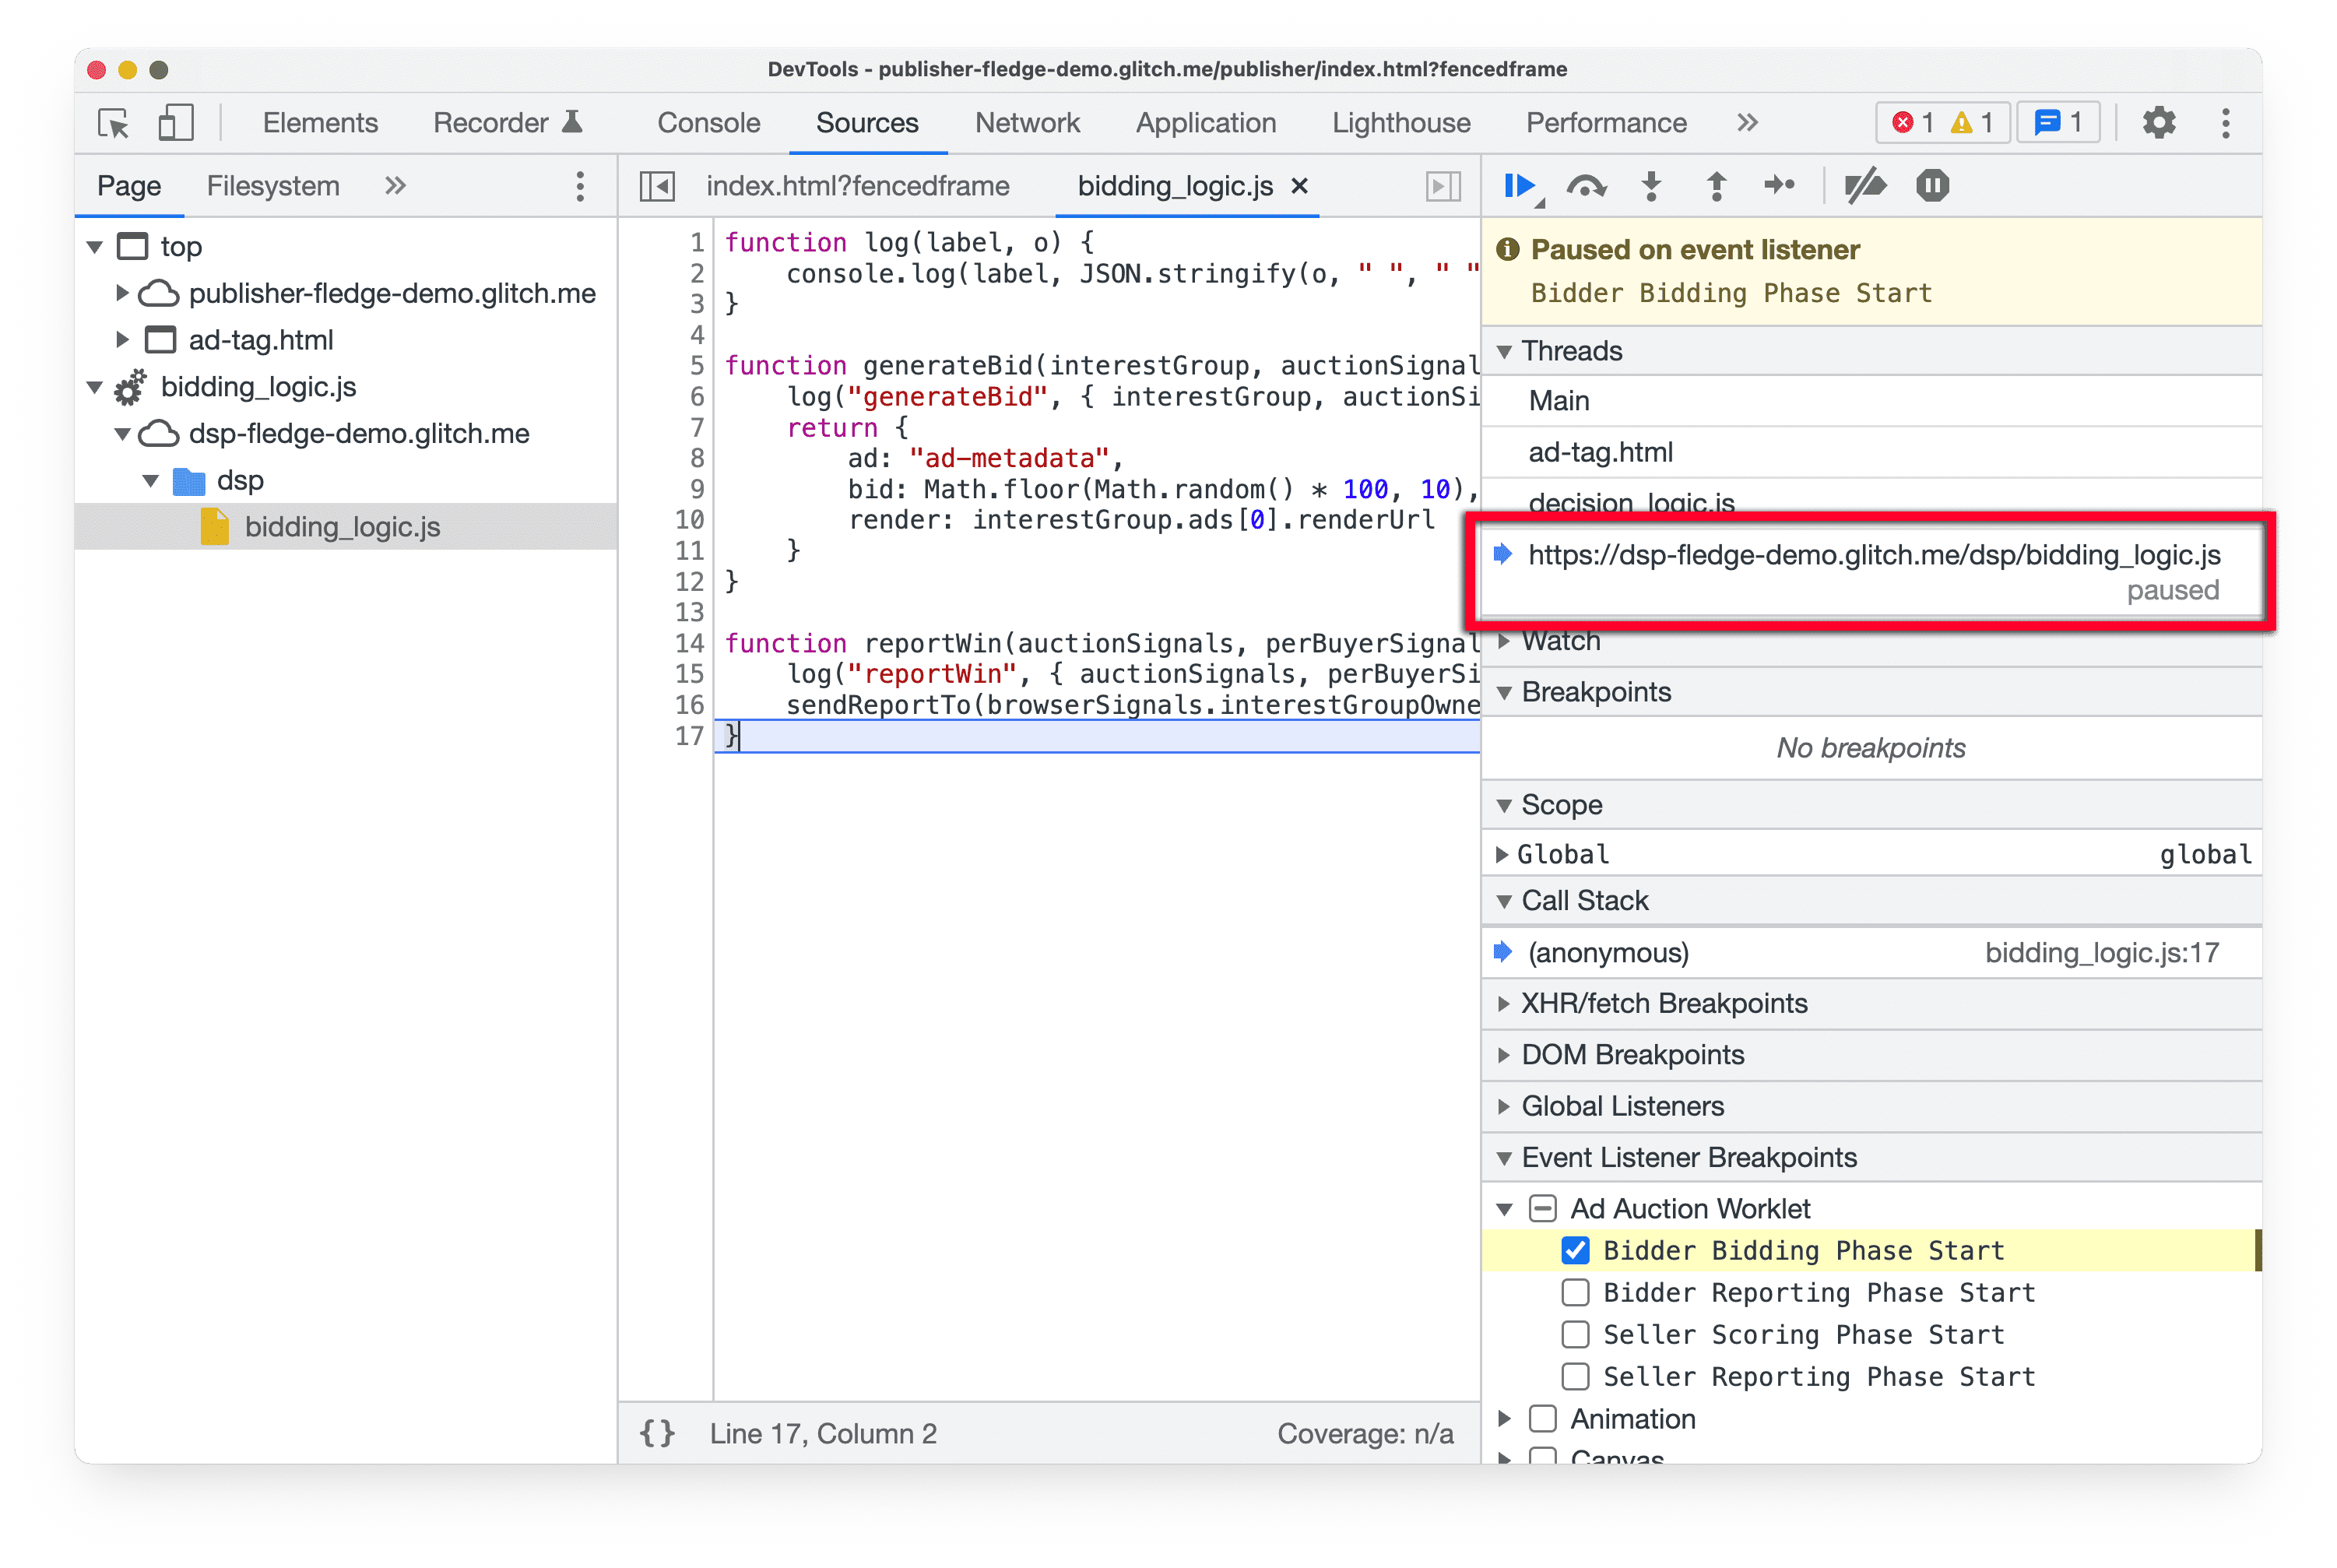
When a breakpoint triggers, execution is paused before the first statement at the top-level of the worklet script. You can use regular breakpoints or step commands to get to the bidding/scoring/reporting function itself.
Live worklet scripts will also show up under the Threads panel.

Since some worklets may run in parallel, multiple threads may end up in the "paused" state. You can use the thread list to switch between threads, and resume or inspect them more closely as appropriate.
Observe events
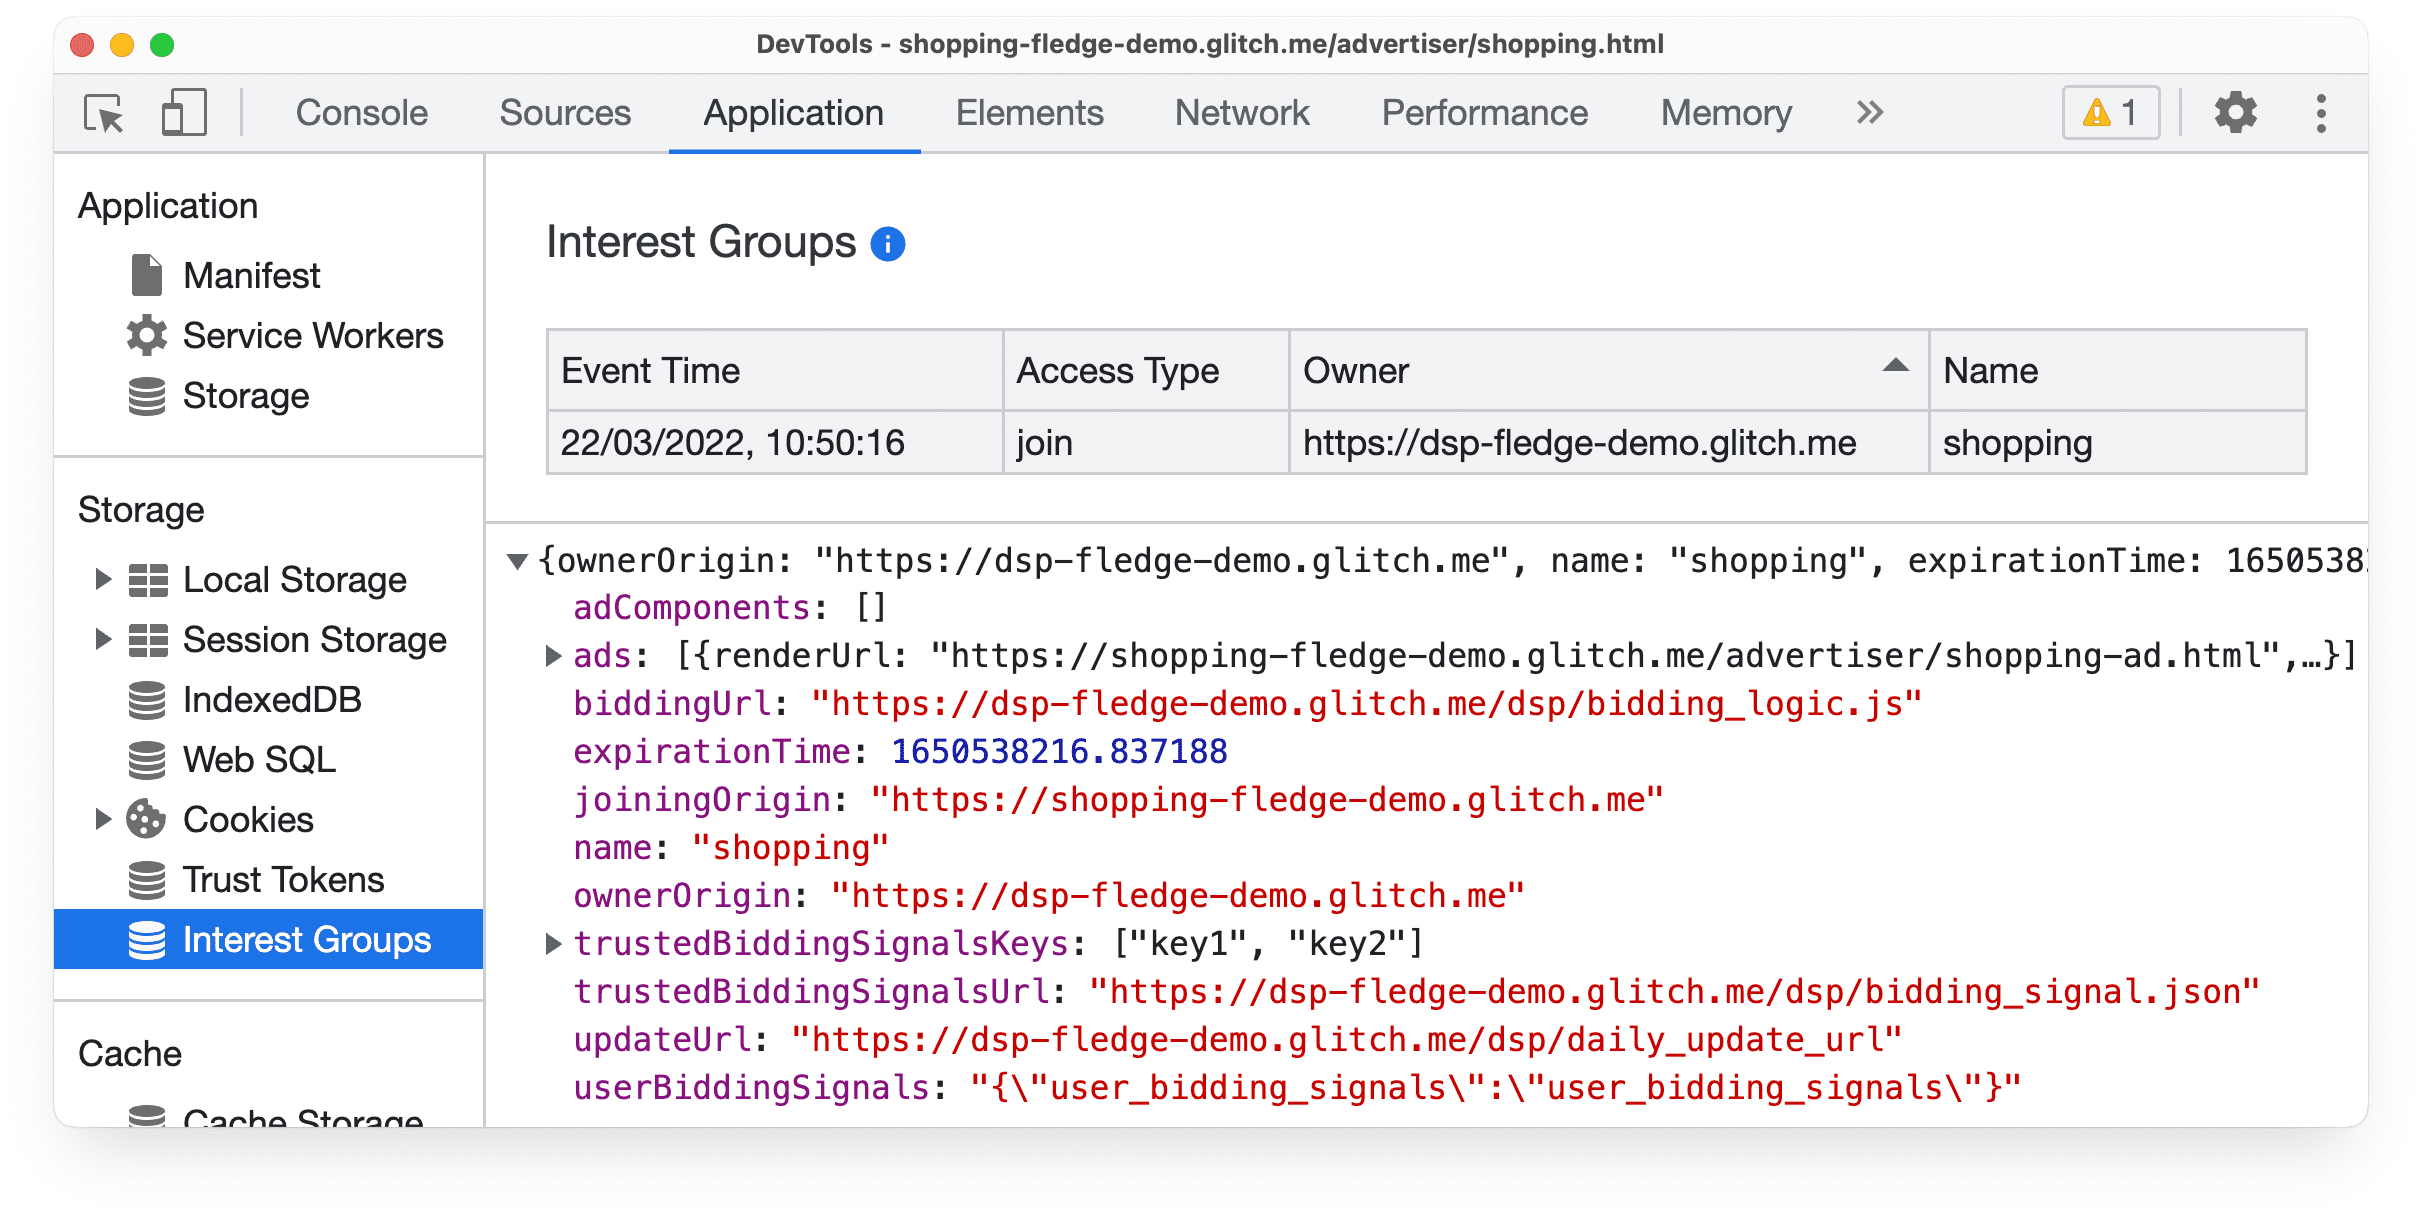
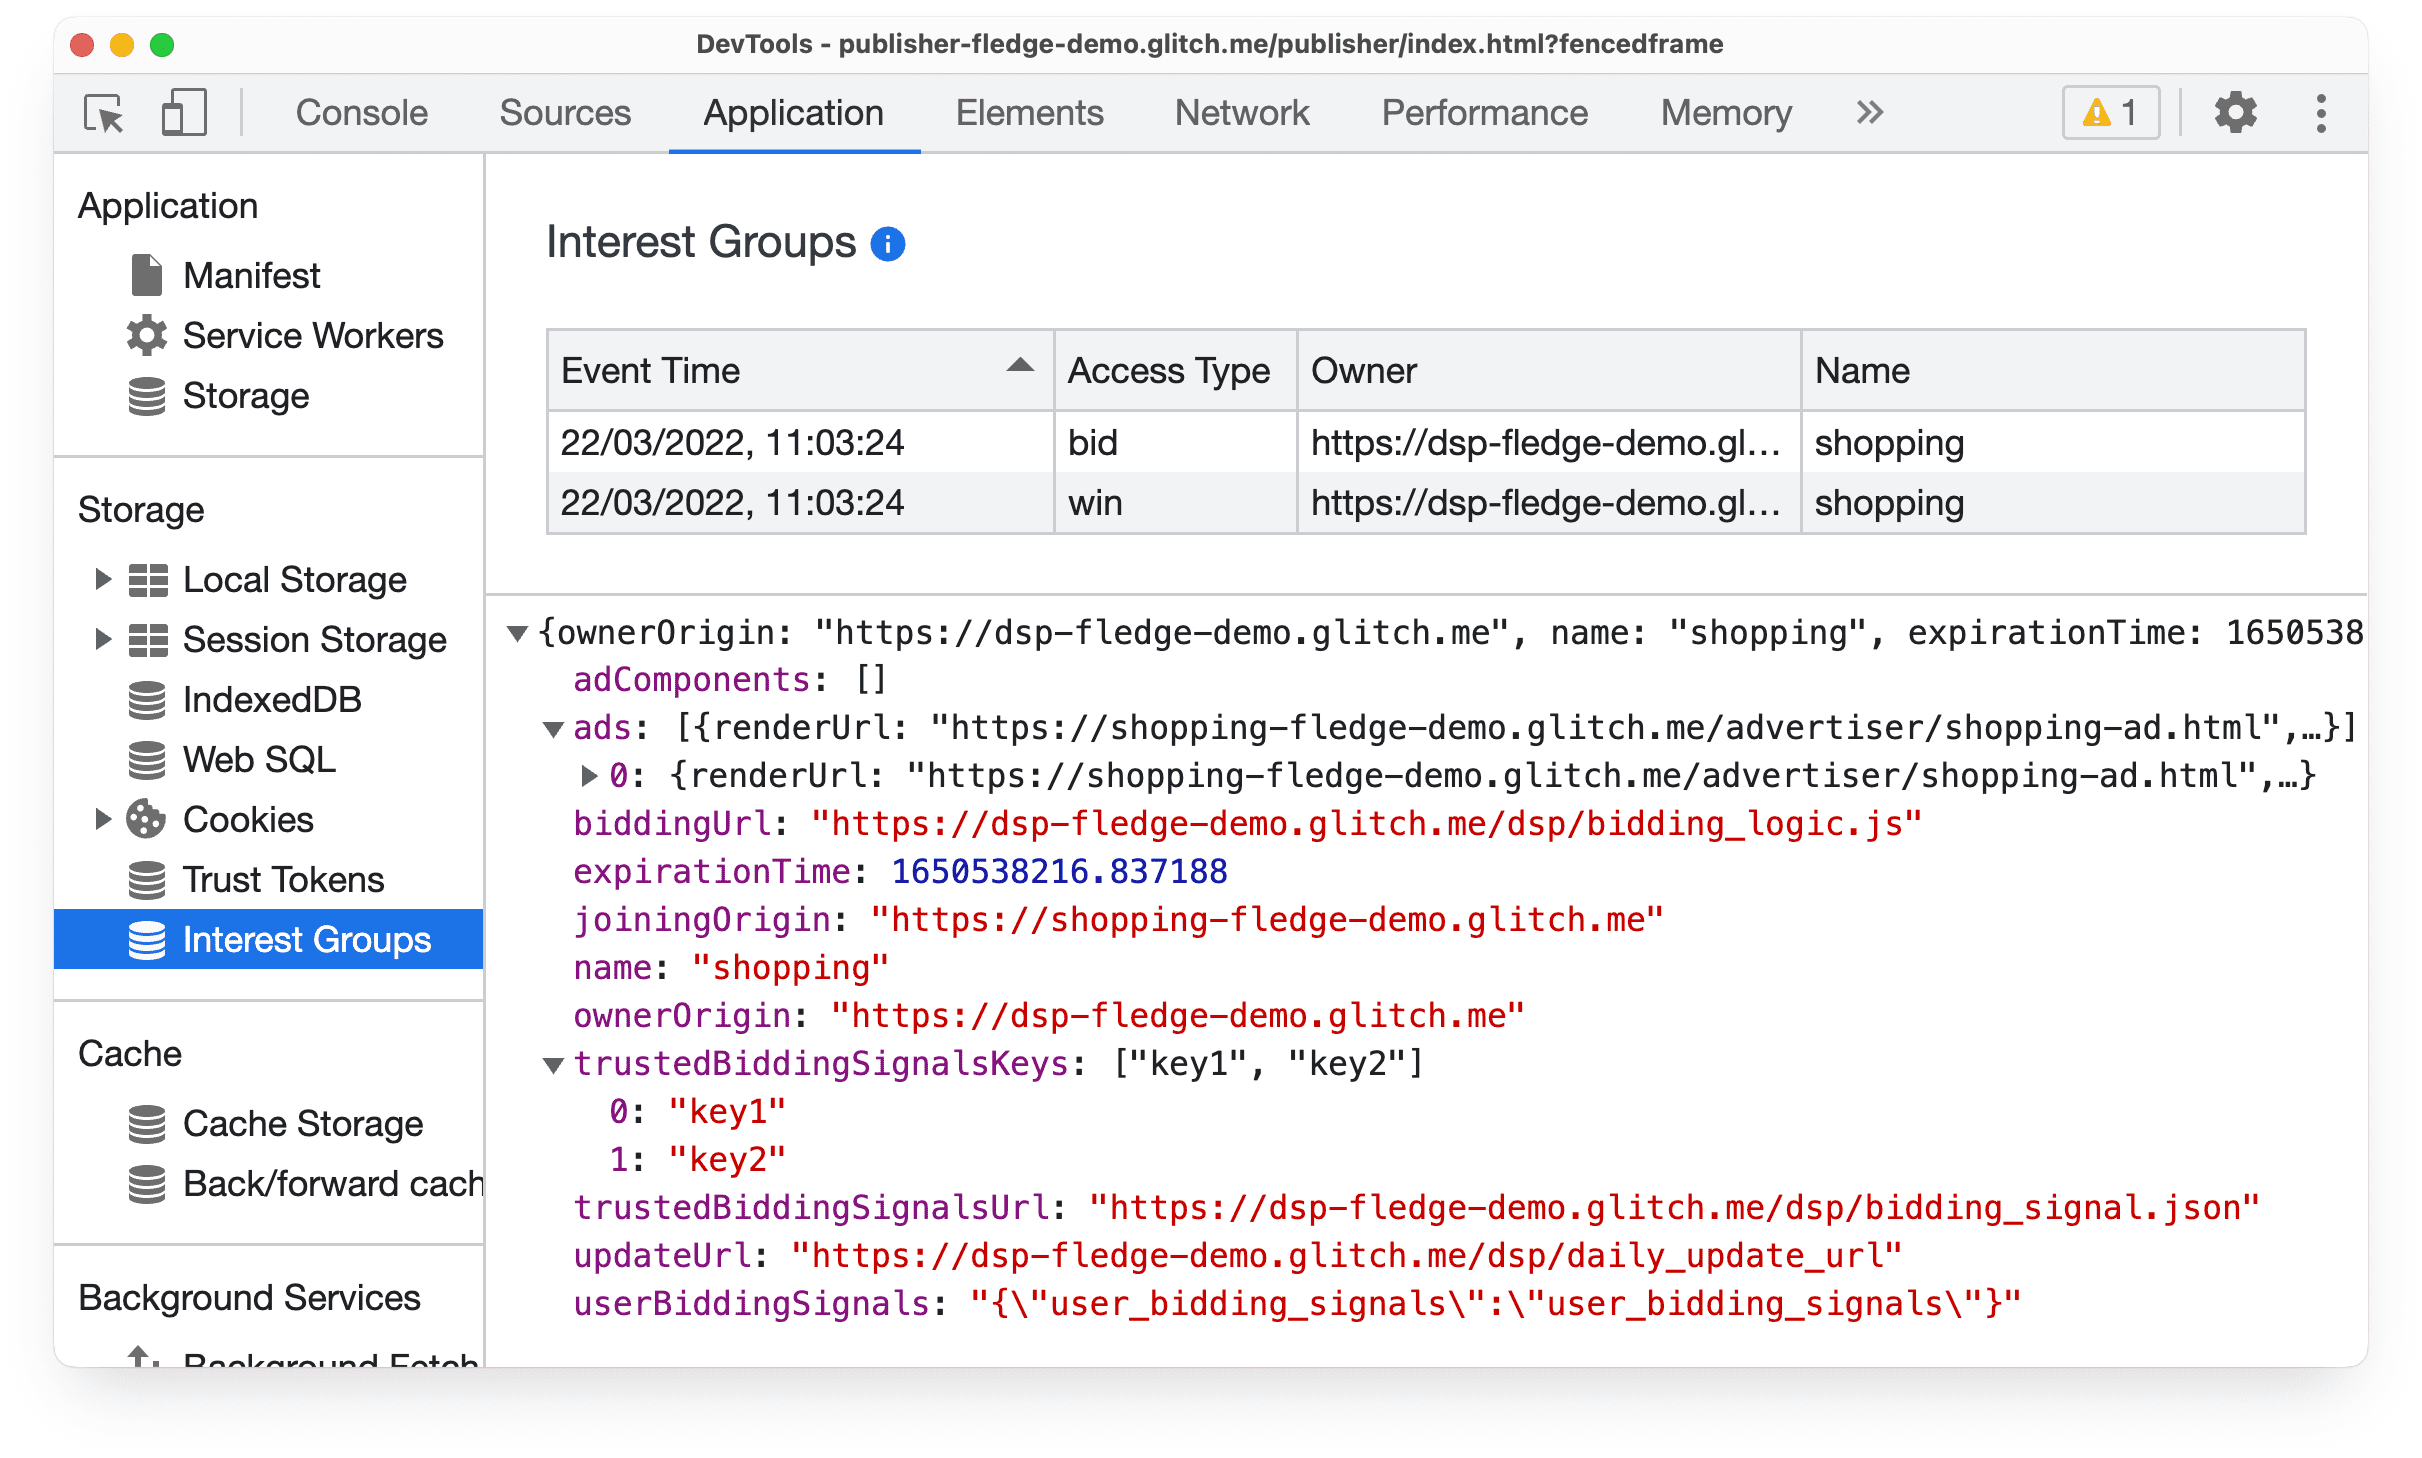
From the Application panel in Chrome DevTools, you can observe Protected Audience API interest group and auction events.
If you visit the Protected Audience API demo advertiser site
in a browser with the Protected Audience API enabled, DevTools will display information about the join event.

Now, if you visit the
Protected Audience API demo publisher site
in a browser with the Protected Audience API enabled, DevTools displays information about the bid
and win events.

All Protected Audience API references
What's next?
We want to engage in conversations with you to ensure we build an API that works for everyone.
Discuss the API
Like other Privacy Sandbox APIs, this API is documented and discussed publicly.
Experiment with the API
You can experiment and participate in conversation about the Protected Audience API.
