Analytics
קל לארגן דפים בעזרת אוספים
אפשר לשמור ולסווג תוכן על סמך ההעדפות שלך.
בדף הניתוח של מסוף Admin תוכלו לראות תצוגה מפורטת של התנועה באתר שלכם. תוכלו להשתמש בתרשימים האינטראקטיביים כדי לבחון את תנועת הגולשים בכל שבוע נתון במהלך 90 הימים האחרונים. לחלופין, אפשר להוריד את הנתונים בפורמט CSV.
reCAPTCHA גרסה 2

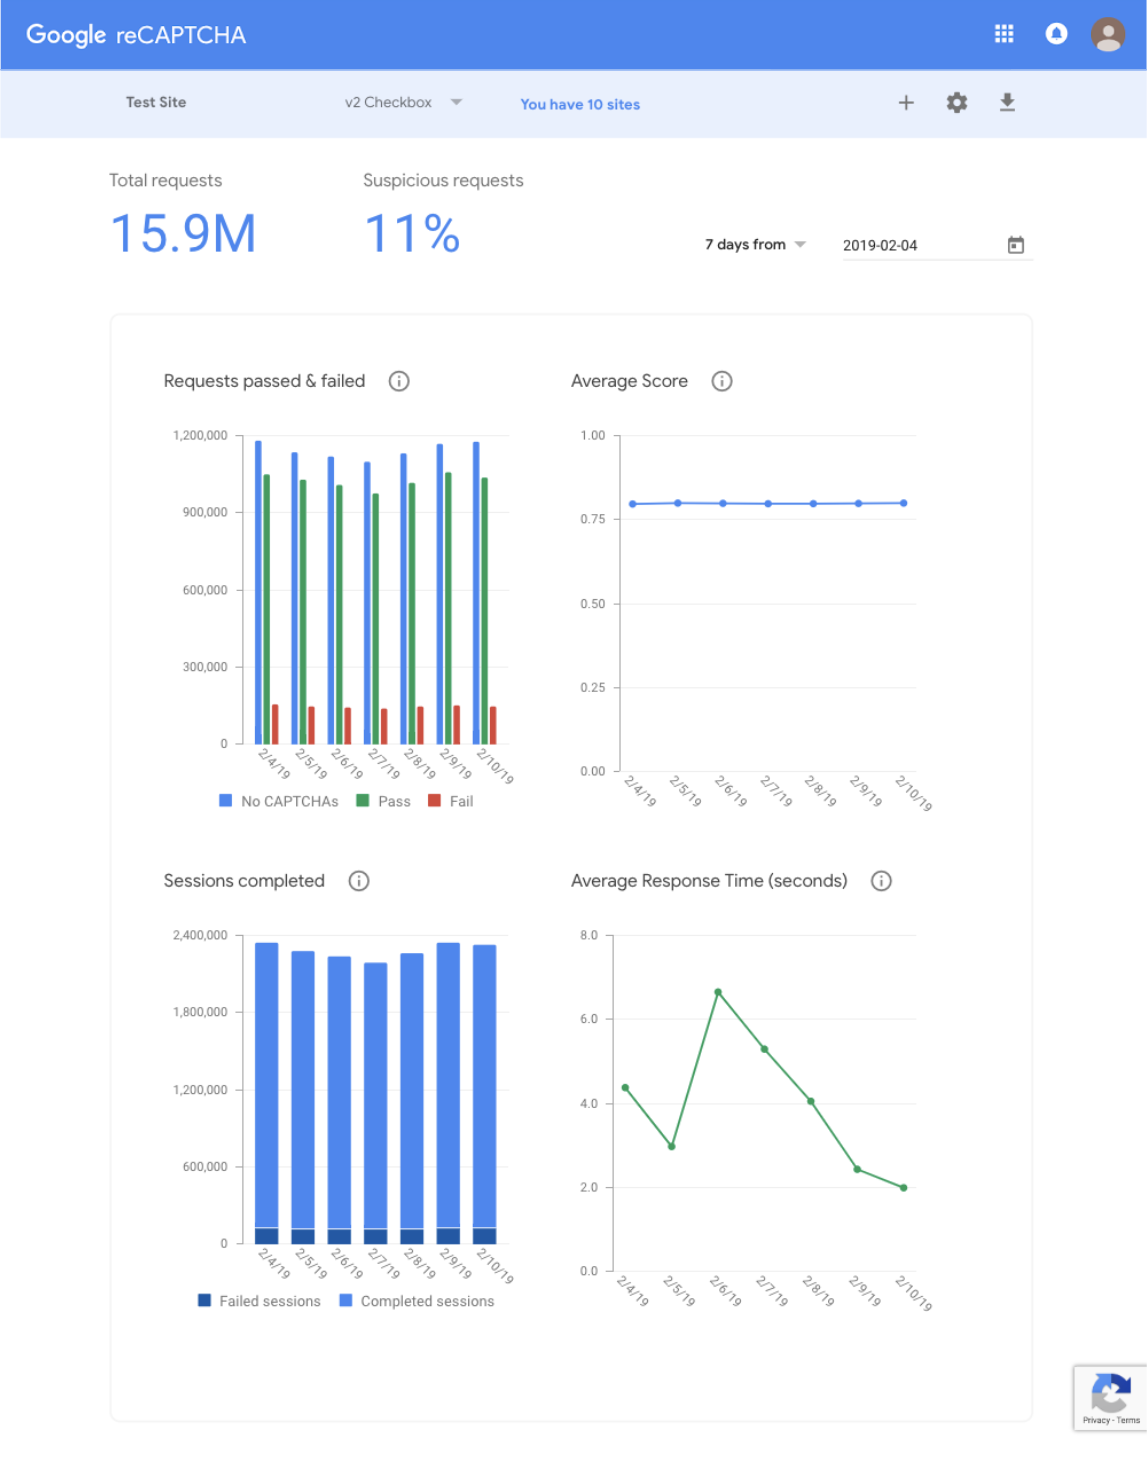
יש 4 תרשימים זמינים לסוג האתר reCAPTCHA v2. יכול להיות שחלק מהתרשימים לא יוצגו לפני שיש מספיק תנועה לאתר.
תרשים |
סוג האתר |
תיאור |
עבר ונכשל |
תיבת סימון, Android, בלתי נראה |
בתרשים הזה רואים כמה פעמים משתמש או בוט עברו או נכשלו באתגר CAPTCHA מסוים,
באתר שלך בכל יום. המשמעות של מספר הפעמים שנכשלה היא בהכרח שהמשתמש לא
פתר את האתגר בסופו של דבר. כמו כן, אפשר לראות כמה פעמים לא הוצג CAPTCHA בגלל
ש-reCAPTCHA היה בטוח שהבקשה לגיטימית. |
ציון ממוצע |
תיבת סימון, Android, בלתי נראה |
בתרשים הזה מוצג הציון הממוצע באתר, שנועד לעזור לכם לזהות מגמות.
הציונים נעים בין 0.0 ל-1.0, כאשר 0.0 מציין תנועה פוגענית ו-1.0 מציין תנועה
טובה. כדאי להירשם לשירות
reCAPTCHA v3
כדי לקבל תובנות נוספות לגבי תנועת הגולשים. |
סשנים שהושלמו |
תיבת סימון, Android |
בתרשים הזה אפשר לראות כמה פעמים משתמש או בוט ביצעו אינטראקציה עם reCAPTCHA והשלימו
אימות באמצעות reCAPTCHA. |
זמן תגובה ממוצע |
תיבת סימון, Android |
בתרשים הזה מוצג הזמן הממוצע שלקח לאנשים ולבוטים להשלים סשן reCAPTCHA,
כולל ניסיונות שנכשלו וטעינות מחדש. |
reCAPTCHA גרסה 3

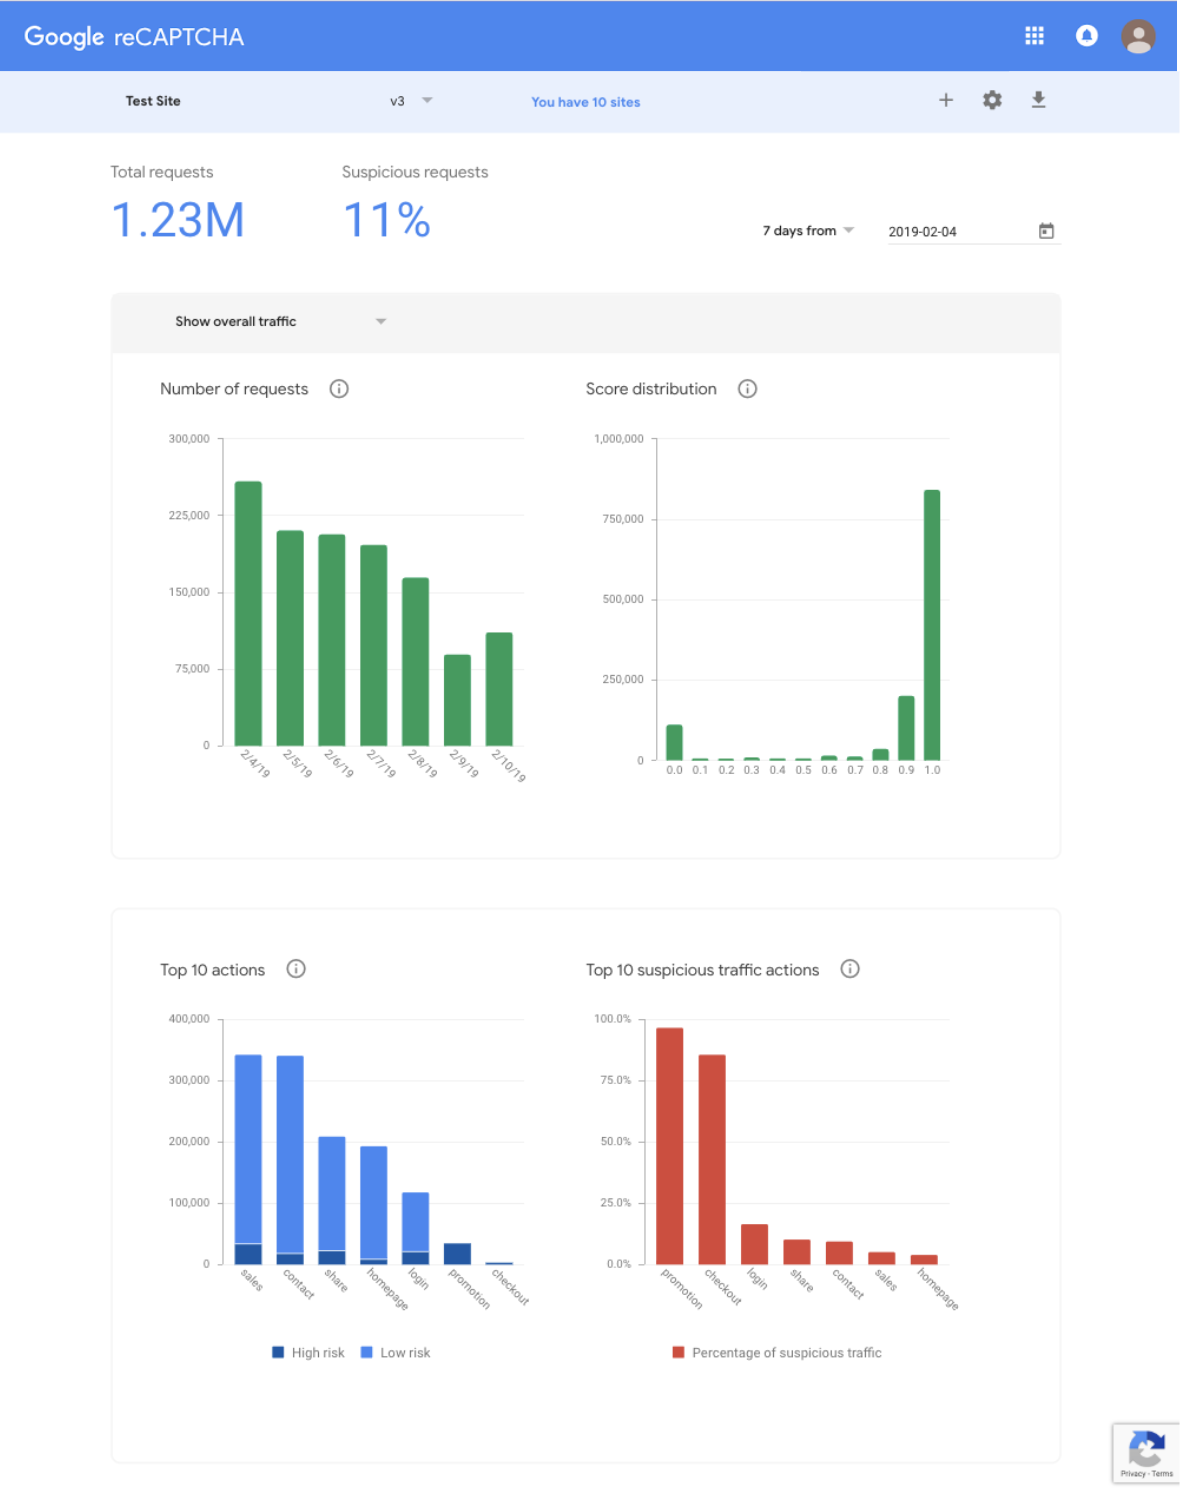
יש 4 תרשימים זמינים לסוג האתר reCAPTCHA v3. שימו לב שיכול להיות שהציונים לא יהיו מדויקים לפני שתתחילו לצבור מספיק תנועה בזמן אמת.
תרשים |
תיאור |
מספר הבקשות |
בתרשים הזה מוצג מספר הבקשות שהתקבלו reCAPTCHA מהאתר שלך לגבי
שם הפעולה שצוין. |
התפלגות הציון |
בתרשים הזה מוצגת התפלגות הציונים לאתר שלך עבור שם הפעולה שצוין.
הציונים נעים בין 0.0 ל-1.0, כאשר 0.0 מציין תנועה פוגענית ו-1.0 מציין תנועה
טובה. |
10 הפעולות המובילות |
בתרשים הזה מוצגות 10 הפעולות המובילות (לפי תנועת הגולשים הכוללת) באתר. כדי לשפר
את ניתוח הסיכונים המותאם עבור האתר שלך וכדי לראות פירוט רב יותר של תנועת הגולשים,
צריך לציין שם פעולה בכל מקום שבו מבצעים אימות באמצעות reCAPTCHA. |
10 הפעולות החשודות המובילות |
בתרשים הזה מוצגות 10 הפעולות המובילות (בסדר יורד של אחוז התנועה החשודה) באתר. כדי לשפר את ניתוח הסיכונים המותאם עבור האתר שלך וכדי לראות פירוט
מפורט יותר של תנועת הגולשים, צריך לציין שם פעולה בכל מקום שבו מבצעים
אימות באמצעות reCAPTCHA. |
אלא אם צוין אחרת, התוכן של דף זה הוא ברישיון Creative Commons Attribution 4.0 ודוגמאות הקוד הן ברישיון Apache 2.0. לפרטים, ניתן לעיין במדיניות האתר Google Developers. Java הוא סימן מסחרי רשום של חברת Oracle ו/או של השותפים העצמאיים שלה.
עדכון אחרון: 2025-07-25 (שעון UTC).
[null,null,["עדכון אחרון: 2025-07-25 (שעון UTC)."],[[["\u003cp\u003eThe Admin Console analytics page offers insights into website traffic using interactive charts and downloadable CSV data for the past 90 days.\u003c/p\u003e\n"],["\u003cp\u003ereCAPTCHA v2 analytics include charts for pass/fail rates, average score, sessions completed, and average response time, varying by site type.\u003c/p\u003e\n"],["\u003cp\u003ereCAPTCHA v3 analytics provide data on request numbers, score distribution, and top actions based on overall and suspicious traffic, requiring specific action names for detailed analysis.\u003c/p\u003e\n"],["\u003cp\u003eCharts might not display accurate data or be available until sufficient traffic has been processed by reCAPTCHA.\u003c/p\u003e\n"]]],["The Admin Console's analytics page provides traffic insights, allowing users to view data through interactive charts for the past 90 days or download it in CSV format. For reCAPTCHA v2, charts display passed/failed CAPTCHA challenges, average scores, completed sessions, and average response times. For reCAPTCHA v3, charts detail request numbers, score distribution, top 10 actions, and top 10 suspicious traffic actions. Specifying action names improves adaptive risk analysis.\n"],null,["# Analytics\n\nThe Admin Console analytics page provides a detailed view into traffic on your\nsite. You can use the interactive charts to look at your traffic in any given\nweek over the past 90 days. Alternatively, you can download the data in a CSV\nformat.\n\nreCAPTCHA v2\n------------\n\nThere are 4 charts available for the reCAPTCHA v2 site type. Some of the charts\nmight not be shown before there is sufficient traffic to your site.\n\n| Chart | Site type | Description |\n|-----------------------|------------------------------|---------------------------------------------------------------------------------------------------------------------------------------------------------------------------------------------------------------------------------------------------------------------------------------------------------------------------------------|\n| Passed and Failed | Checkbox, Android, Invisible | This chart shows how many times a user or bot passed or failed an individual CAPTCHA challenge on your site each day. The failed number does not necessarily mean the user did not eventually solve the challenge. It also shows how many times no CAPTCHA was shown because reCAPTCHA was confident that the request was legitimate. |\n| Average Score | Checkbox, Android, Invisible | This chart shows the average score on your site, which is designed to help you spot trends. Scores range from 0.0 to 1.0, with 0.0 indicating abusive traffic and 1.0 indicating good traffic. Sign up for [reCAPTCHA v3](/recaptcha/docs/v3) to gain more insights about your traffic. |\n| Sessions Completed | Checkbox, Android | This chart shows how many times a user or bot interacted with reCAPTCHA and completed reCAPTCHA verification. |\n| Average Response Time | Checkbox, Android | This chart shows the average time it took humans and bots to complete a reCAPTCHA session, including failed attempts and reloads. |\n\nreCAPTCHA v3\n------------\n\nThere are 4 charts available for the reCAPTCHA v3 site type. Note that the\nscores may not be accurate before running with sufficient live traffic.\n\n| Chart | Description |\n|-----------------------------------|-------------------------------------------------------------------------------------------------------------------------------------------------------------------------------------------------------------------------------------------------------------------------------------------------------|\n| Number of Requests | This chart shows the number of requests that reCAPTCHA received from your site for the specified action name. |\n| Score Distribution | This chart shows the distribution of scores for your site for the specified action name. Scores range from 0.0 to 1.0, with 0.0 indicating abusive traffic and 1.0 indicating good traffic. |\n| Top 10 Actions | This chart shows the top 10 actions (by overall traffic) for your site. To improve the adaptive risk analysis for your site and to view a more detailed breakdown of your traffic, specify an action name in each place that you execute reCAPTCHA verification. |\n| Top 10 Suspicious Traffic Actions | This chart shows the top 10 actions (in descending order of percentage of suspicious traffic) for your site. To improve the adaptive risk analysis for your site and to view a more detailed breakdown of your traffic, specify an action name in each place that you execute reCAPTCHA verification. |"]]