
如果您的 Actions 项目失败或似乎无法正常运行,问题的原因可能不明显。在 Actions 控制台中,您可以查看项目的详细日志,以便深入了解相关情况。
查看项目日志
您可以通过 Analytics(分析)下的 Actions 控制台访问项目的日志:
- 在 Actions 控制台中,针对您的项目从顶部菜单中选择 Analytics。
- 选择页面顶部附近的运行状况标签页。
- 在错误下,选择右上角的查看日志链接:
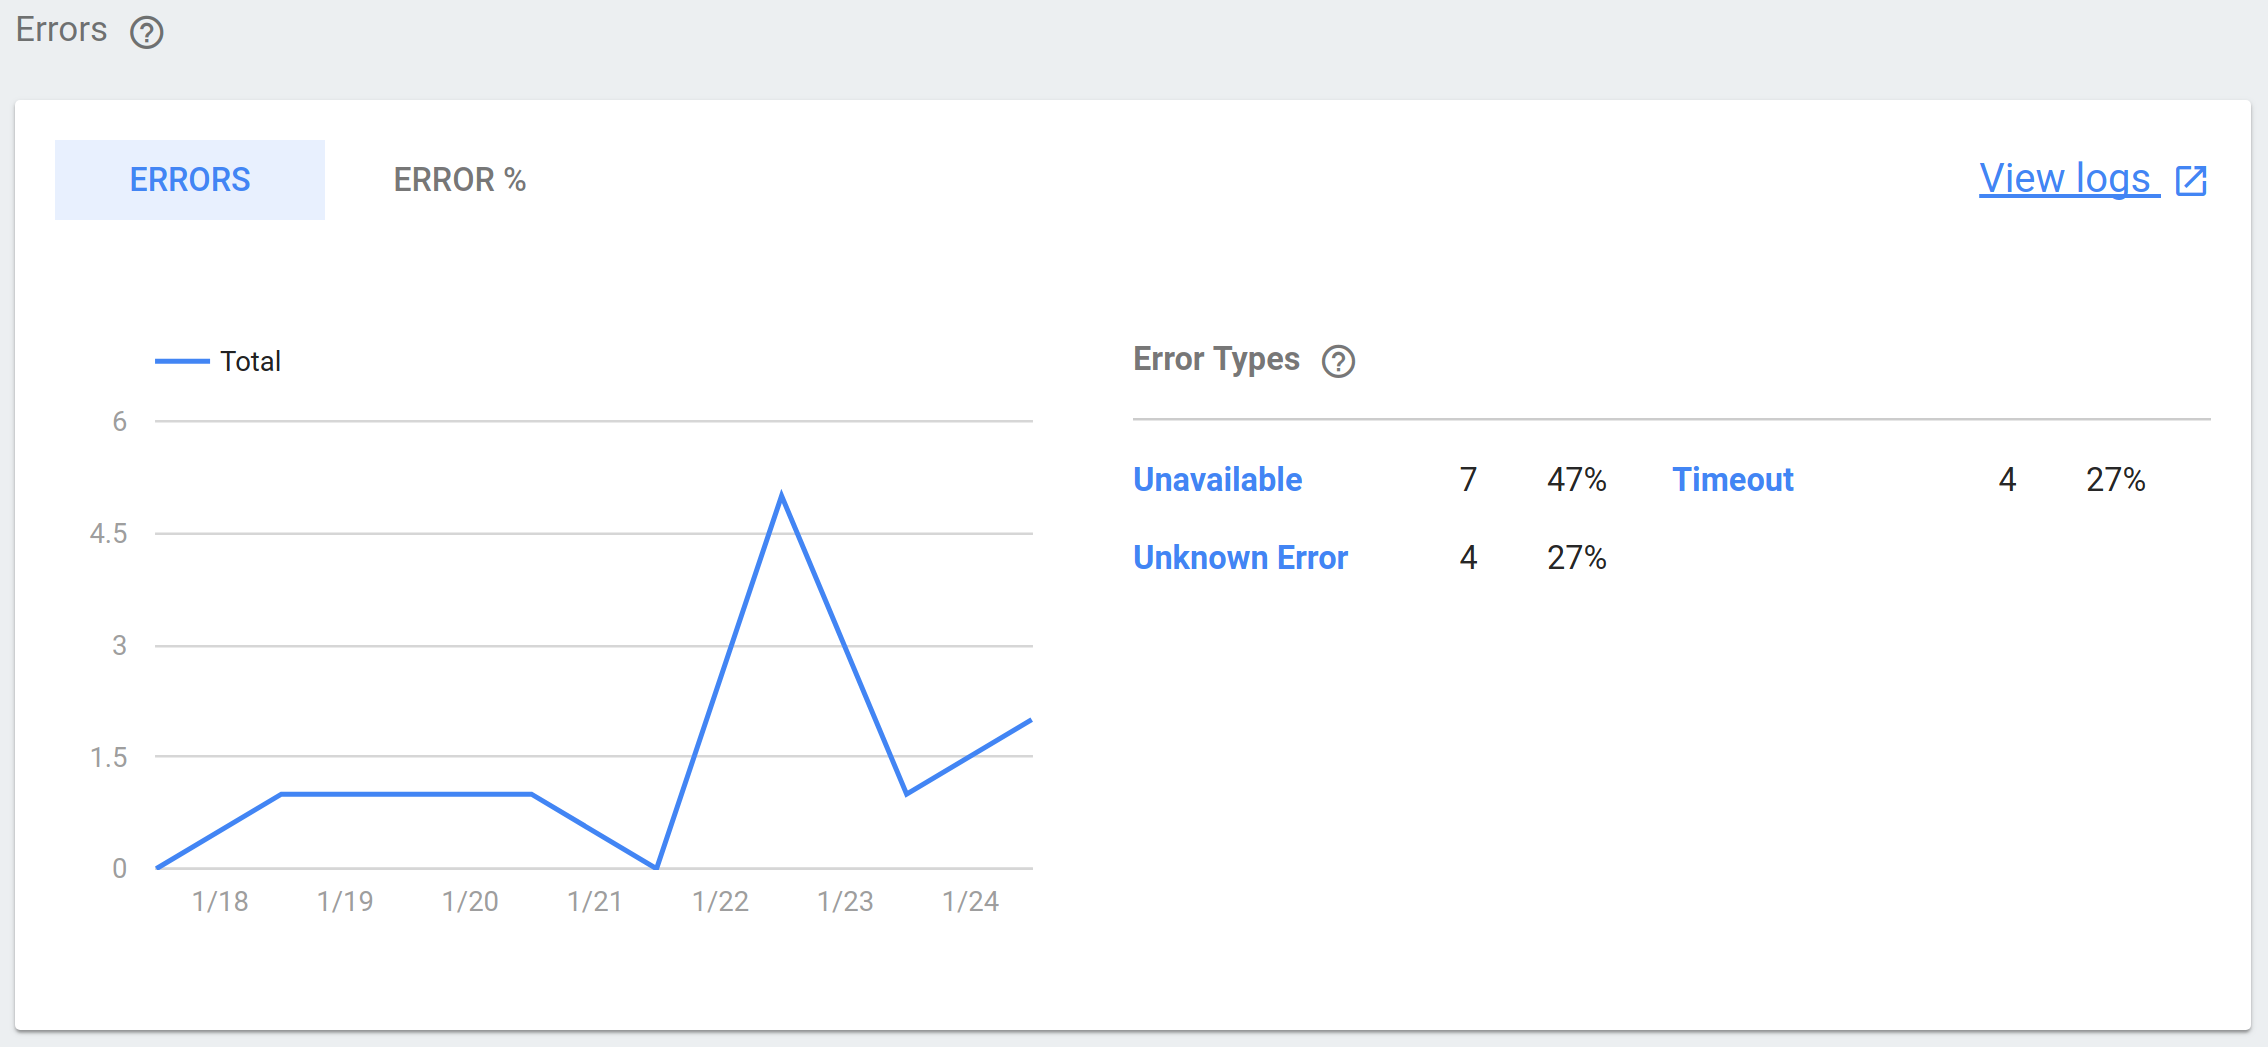
此链接会将您转到项目在 Google Cloud Platform 中的日志,您可以在其中过滤、展开和分析收集的日志数据。
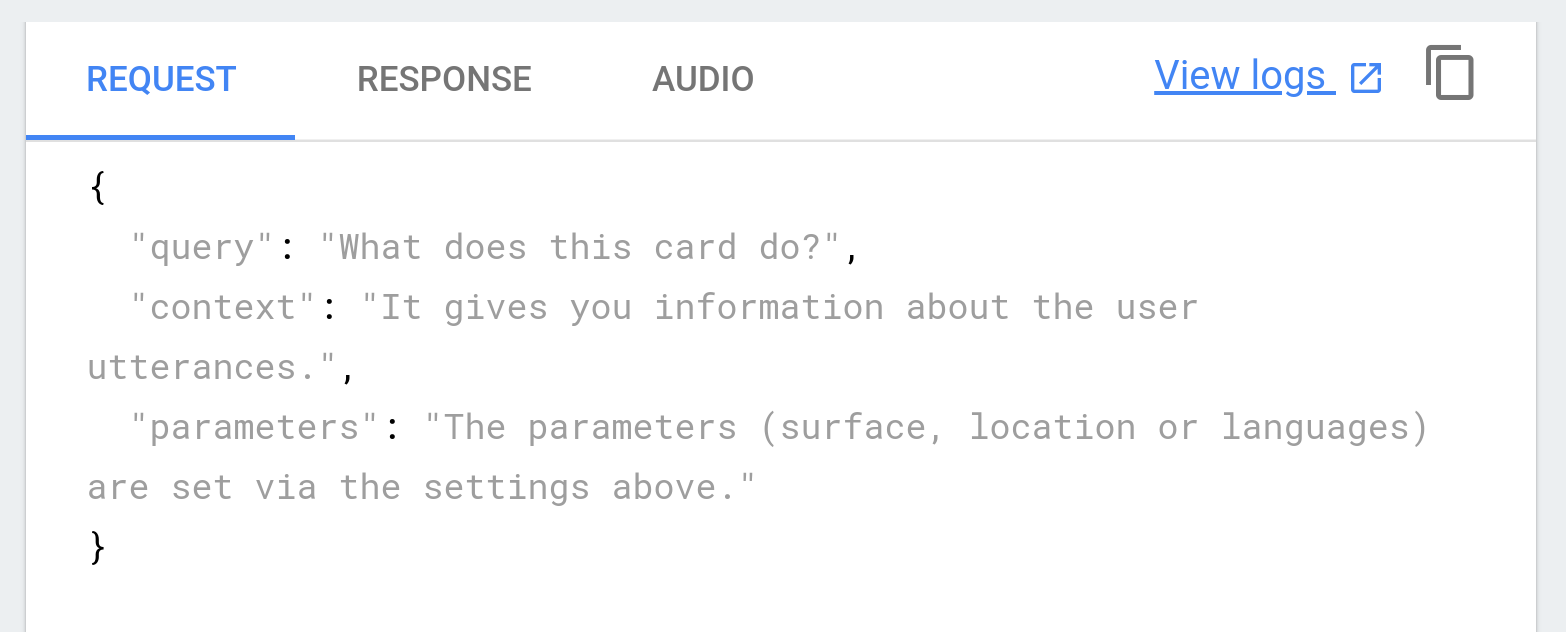
如果您使用 Actions 模拟器测试您的 Action,可以点击 Actions Simulator 页面右上角的查看日志链接来快速访问特定于您的测试的日志。
问题排查
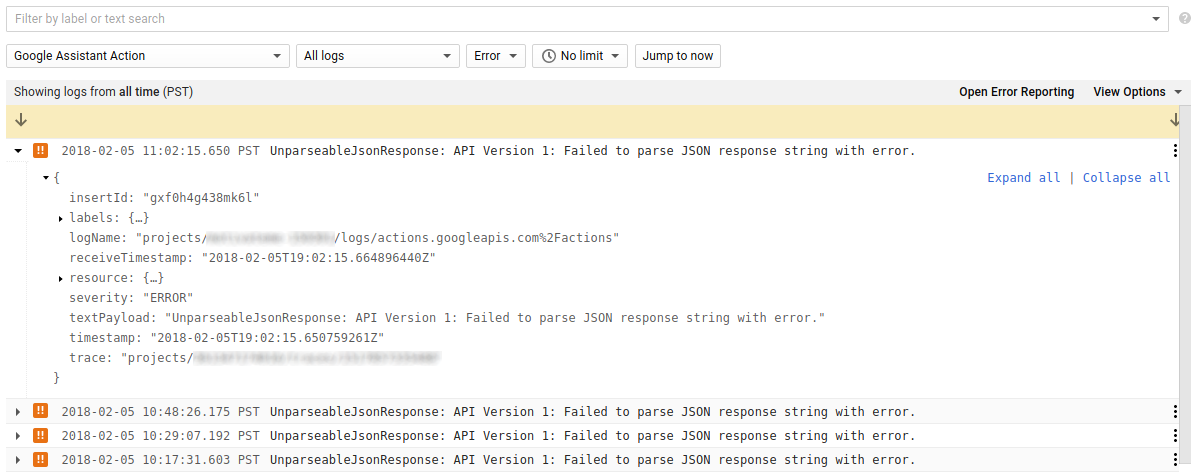
日志条目使用表示紧急程度的等级进行标记。如果您正在排查 Actions 项目的问题,您可能需要先过滤严重、错误和警告事件:

每个日志条目都有一个摘要,其中包含事件的时间戳和简短说明。您可以将项目的行为与这些日志时间戳相关联,以确定它们是否相关,并参考说明来缩小原因的范围。
以下示例返回了 UnparseableJsonResponse 错误,原因可能是从 webhook 接收此 JSON 响应时出现语法或超时错误:
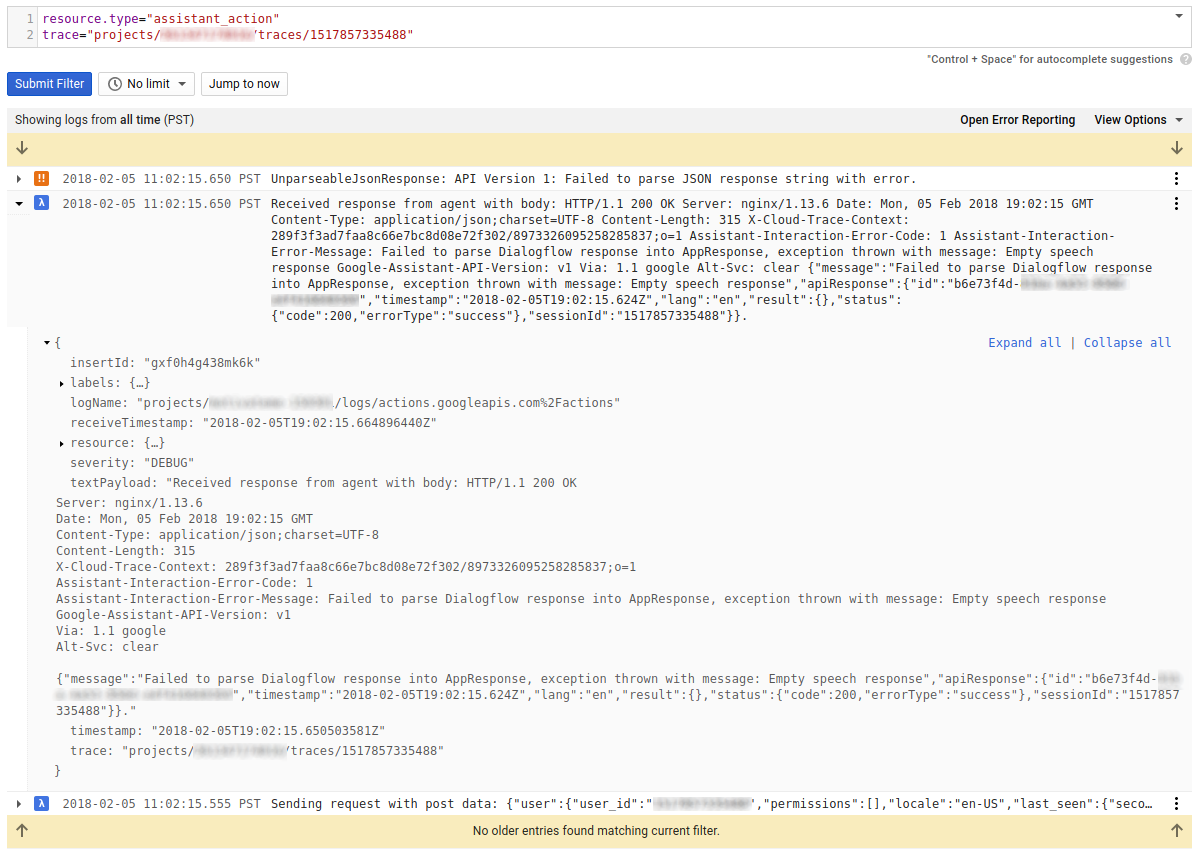
您可能还需要查找具有类似时间戳的 Debug 事件,因为它们可能包含有关其他事件的更多信息。展开错误日志并按 trace 字段过滤后,生成的列表将显示与初始错误关联的所有事件:

在以下示例中,与原始错误相关的调试消息为我们提供了有关该问题的更多信息,包括详细的错误说明和导致问题的具体 JSON 响应:
停用日志类型
由于项目的日志很全面,因此您可能会发现在日志中默认排除某些事件类型(例如,包含个人身份信息的事件或您认为杂乱无章的事件)会很有价值。您可以在项目的日志页面上创建排除项,方法是找到左侧导航栏中的资源使用情况,然后选择排除项标签页:

如需详细了解如何排除不同的日志事件,请参阅 Stackdriver 文档中的排除日志。