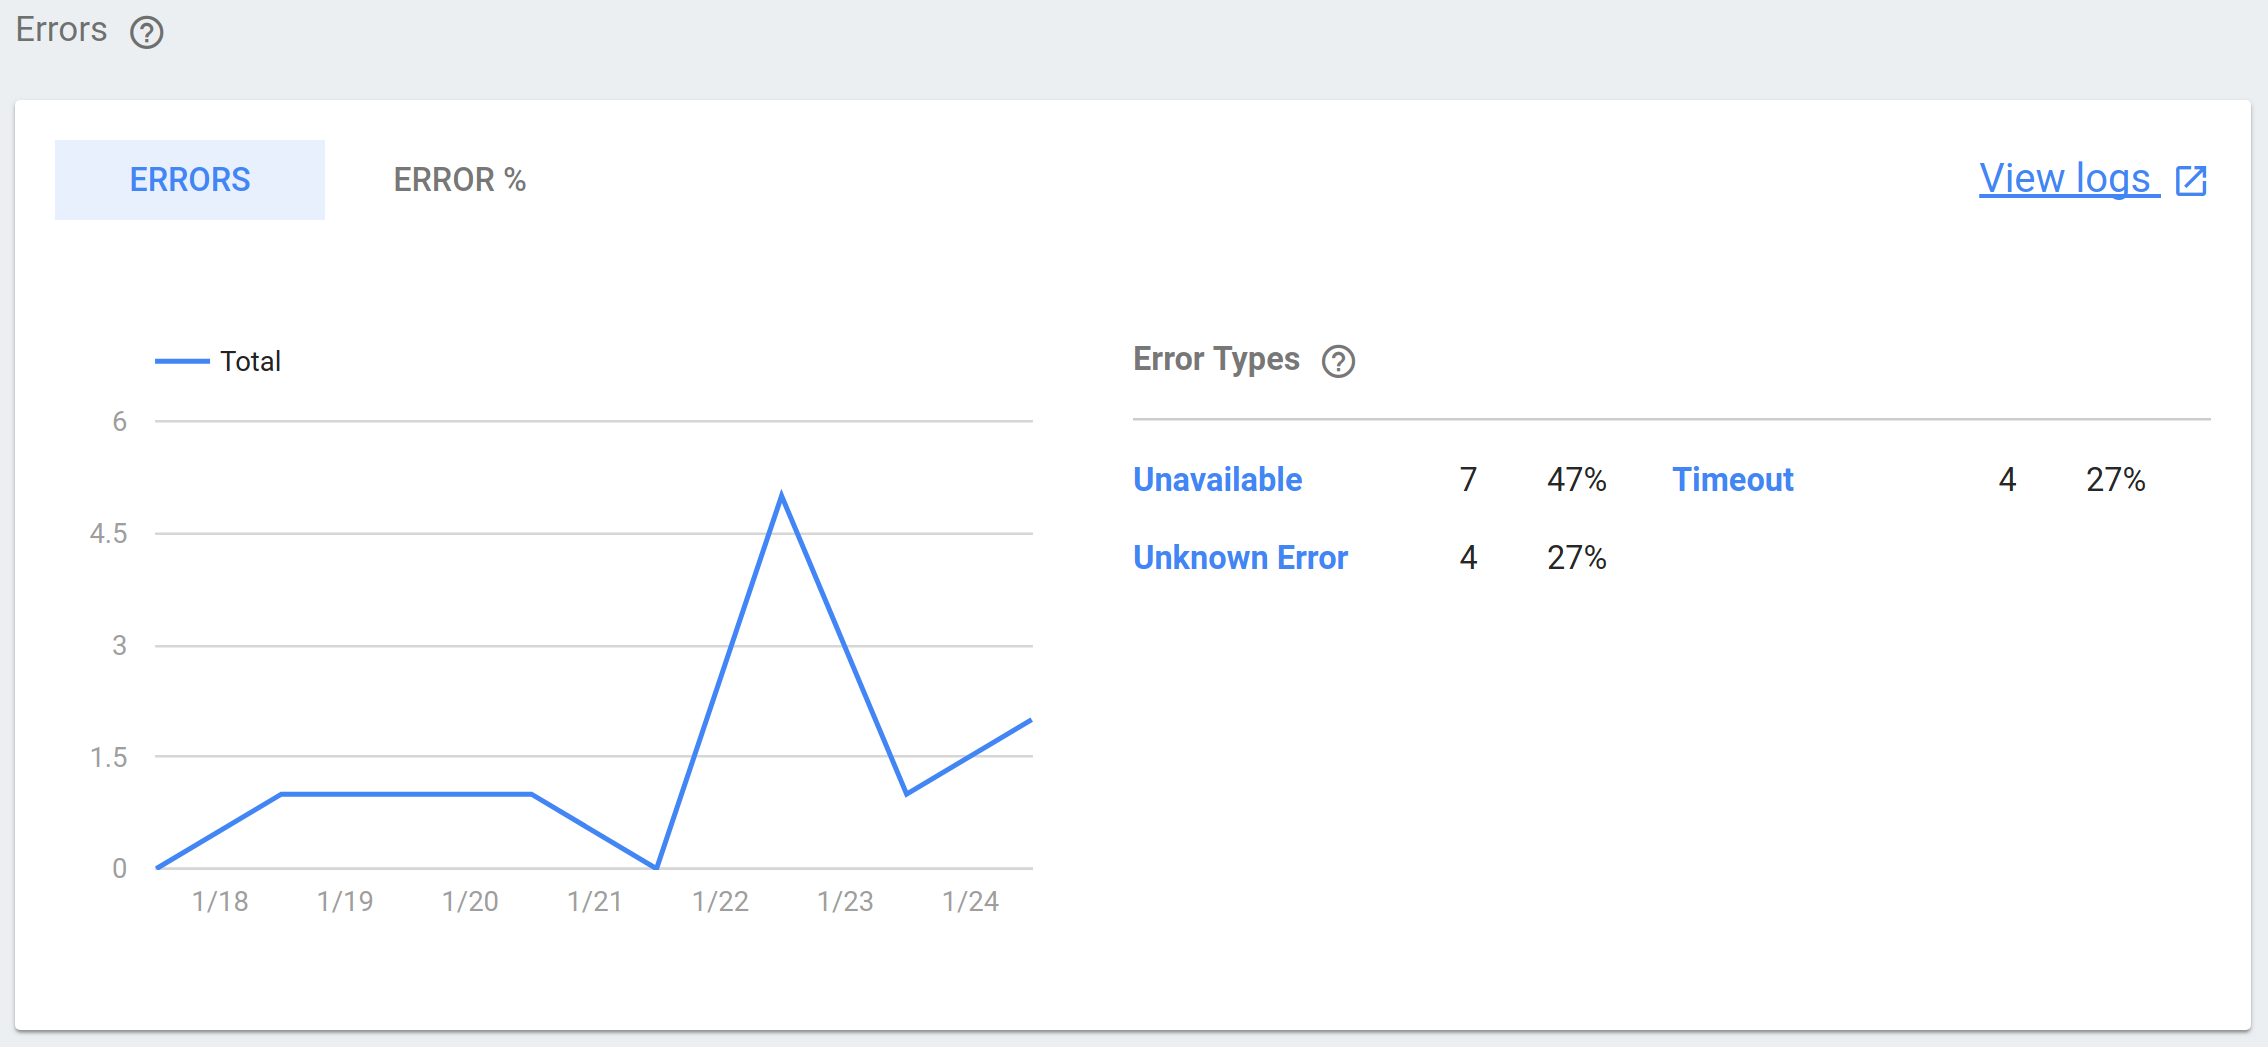
이 링크를 클릭하면 Google Cloud Platform의 프로젝트 로그로 이동하여 수집된 로그 데이터를 필터링, 확장, 분석할 수 있습니다.
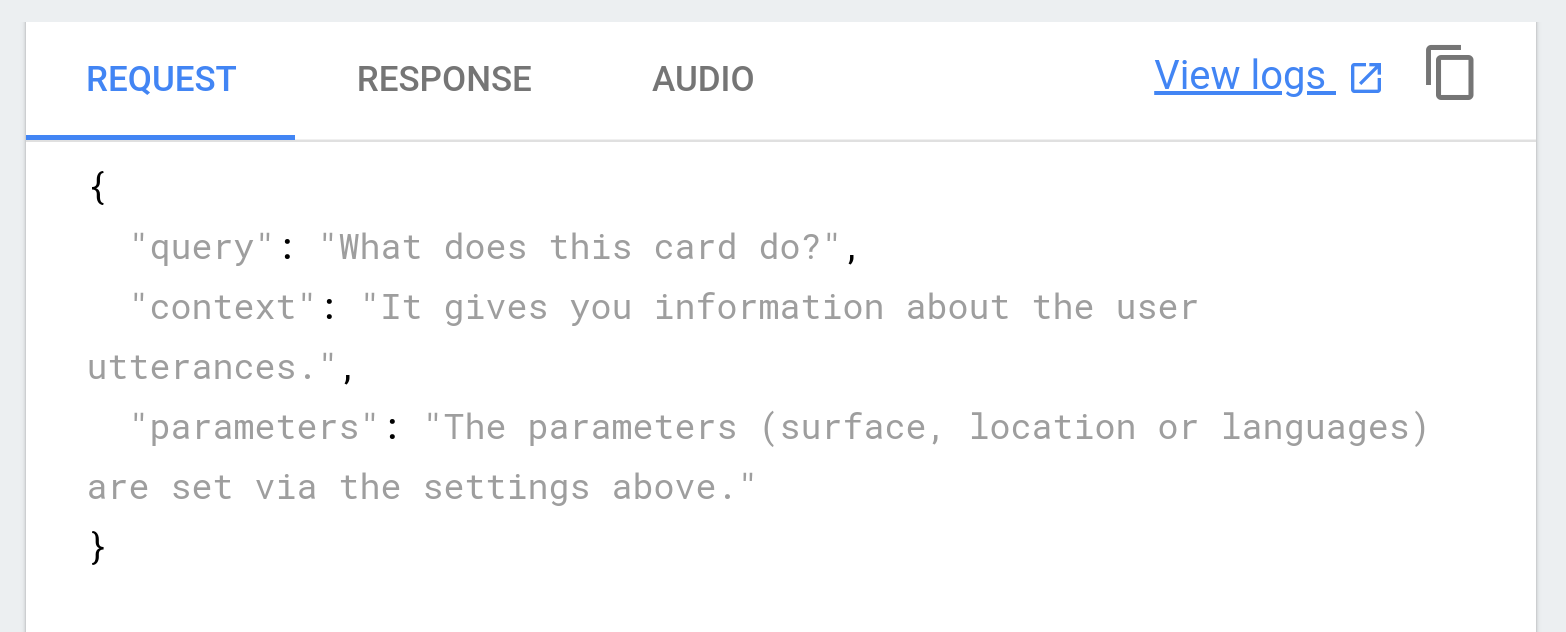
작업 시뮬레이터를 사용하여 작업을 테스트하는 경우 작업 시뮬레이터 페이지의 오른쪽 상단에 있는 로그 보기 링크를 클릭하여 테스트 관련 로그에 빠르게 액세스할 수 있습니다.
문제 해결
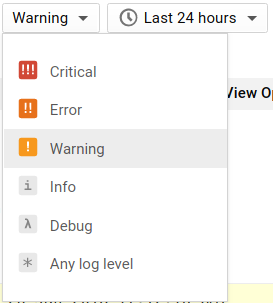
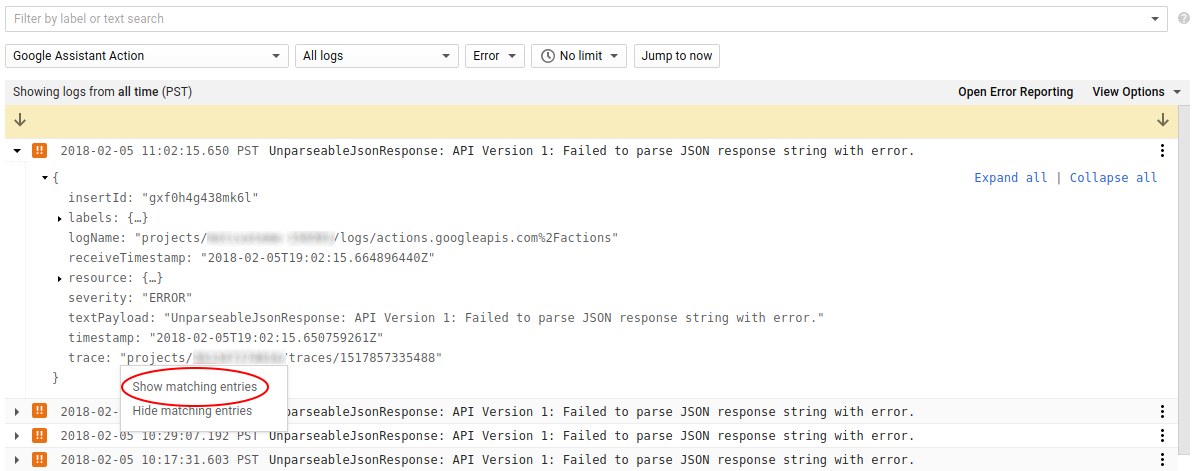
로그 항목에는 긴급함을 나타내는 수준이 표시됩니다. 작업 프로젝트의
문제를 해결하는 경우 먼저 심각, 오류, 경고 이벤트를
필터링하여 시작하는 것이 좋습니다.
모든 로그 항목에는 타임스탬프와 이벤트에 관한 간단한 설명이 포함된 요약이 있습니다. 프로젝트의 동작을 이러한 로그 타임스탬프와 연결하여 서로 관련이 있는지 확인하고 설명을 참조하여 원인을 좁힐 수 있습니다.
아래 예시에서는 웹훅에서 이 JSON 응답을 수신할 때 구문 또는 시간 제한 오류의 결과로 UnparseableJsonResponse 오류가 반환되었습니다.
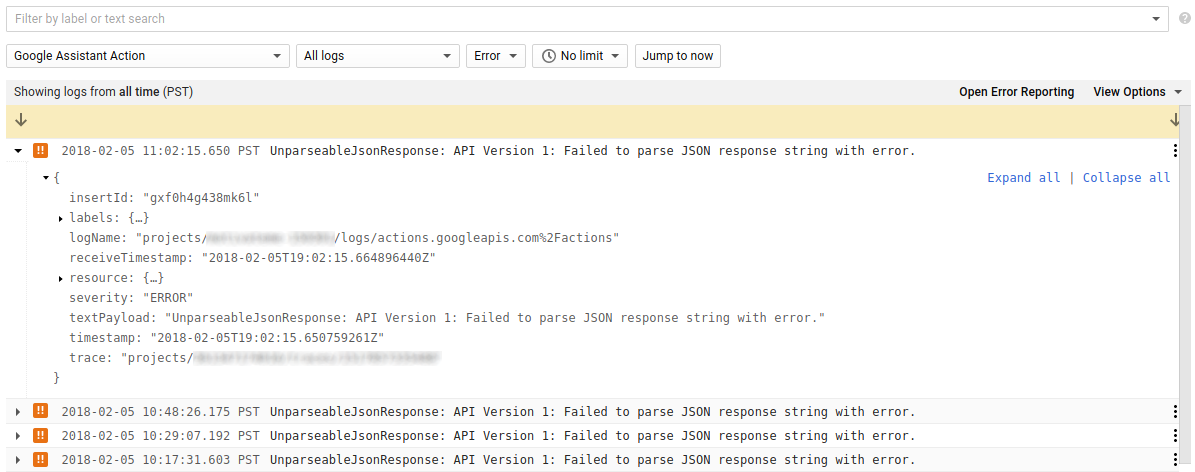
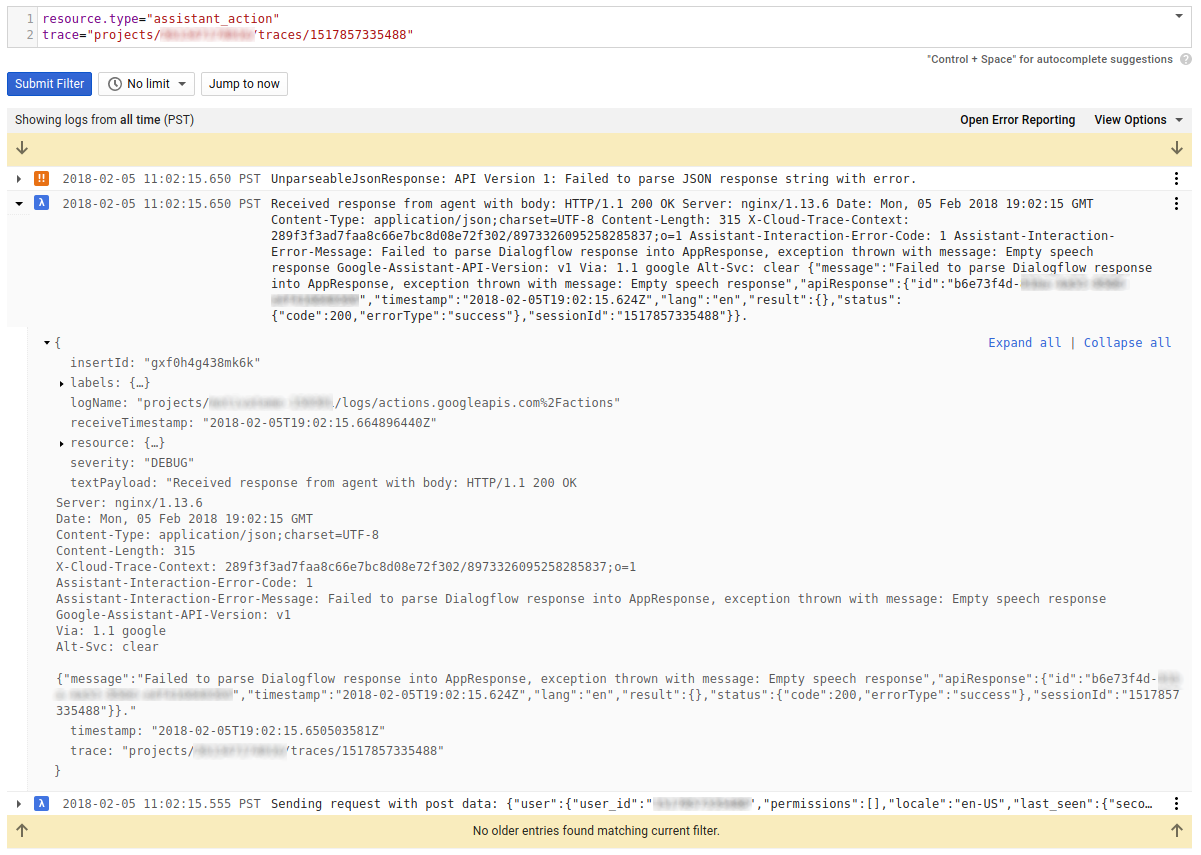
유사한 타임스탬프의 Debug 이벤트를 찾을 수도 있습니다. 이러한 이벤트에 다른 이벤트에 대한 추가 정보가 포함될 수 있기 때문입니다. 오류 로그를 확장하고 trace 필드로 필터링하면 결과 목록에 초기 오류와 관련된 모든 이벤트가 표시됩니다.
아래 예에서 원본 오류와 관련된 디버그 메시지는 자세한 오류 설명, 문제를 일으킨 특정 JSON 응답 등 문제에 관한 추가 정보를 제공합니다.
로그 유형 사용 중지
프로젝트의 로그는 포괄적이므로 특정 이벤트 유형 (예: PII가 있는 이벤트 또는 복잡하다고 생각되는 이벤트)이 기본적으로 로그에 표시되지 않도록 제외하는 것이 유용할 수 있습니다. 왼쪽 탐색 메뉴의 리소스 사용량으로 이동하여 제외 탭을 선택하여 프로젝트의 로그 페이지에서 제외를 만들 수 있습니다.
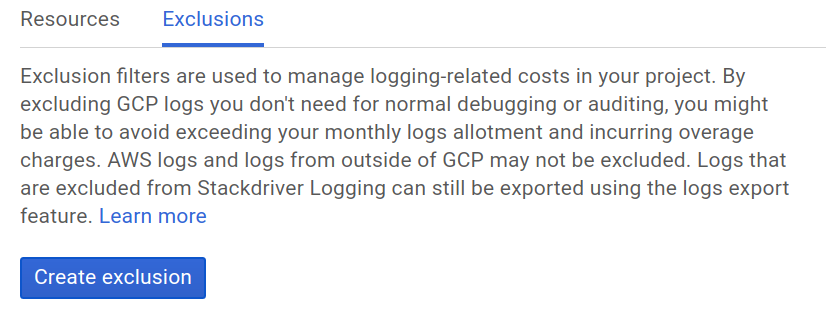
여러 로그 이벤트를 제외하는 방법을 자세히 알아보려면 Stackdriver 문서의 로그 제외를 참조하세요.
[null,null,["최종 업데이트: 2025-07-26(UTC)"],[[["\u003cp\u003eView detailed logs for your Actions project in the Actions Console to gain insight into potential issues.\u003c/p\u003e\n"],["\u003cp\u003eAccess project logs through the \u003cstrong\u003eHealth\u003c/strong\u003e tab in \u003cstrong\u003eAnalytics\u003c/strong\u003e, which redirects to Google Cloud Platform for analysis.\u003c/p\u003e\n"],["\u003cp\u003eUtilize log levels (Critical, Error, Warning) and timestamps to identify and troubleshoot problems within your project.\u003c/p\u003e\n"],["\u003cp\u003eFilter logs using the \u003ccode\u003etrace\u003c/code\u003e field to view associated events for a more comprehensive understanding of errors.\u003c/p\u003e\n"],["\u003cp\u003eCustomize log visibility by creating exclusions to remove specific event types, like those containing sensitive information.\u003c/p\u003e\n"]]],[],null,["# Troubleshooting your Actions\n\nIn the event that your Actions project fails or seems to be working poorly, the cause of\nthe issue may not be obvious. From the [Actions\nconsole](https://console.actions.google.com), you can view detailed logs for\nyour project that can give you more insight into what's going on.\n\nView your project's logs\n------------------------\n\nYour project's logs can be accessed via the Actions Console under Analytics:\n\n1. On your project in the [Actions\n console](https://console.actions.google.com), select **Analytics** in the top menu.\n2. Select the **Health** tab near the top of the page.\n3. Under **Errors** , select the **View Logs** link on the upper-right corner:\n\nThis link will take you to your project's logs in the Google Cloud Platform,\nwhere you can filter, expand, and analyze the log data that has been collected.\n| **Note:** The logs for your Actions on Google project are generated using Stackdriver Logging, which offers log management and analytics. You can learn more about how to navigate your project's logs at [Viewing\n| Logs](https://cloud.google.com/logging/docs/view/overview) on the Stackdriver documentation. Note that not every filter described in those docs are currently available for Actions on Google projects.\n\nIf you're using the [Actions Simulator](/assistant/console/simulator) to test your\nActions, you can quickly access logs specific to your tests by clicking the **View\nLogs** link on the upper-right corner of the Actions Simulator page.\n\nTroubleshooting\n---------------\n\nLog entries are marked with levels that indicate urgency. If you're\ntroubleshooting a problem with your Actions project, you will probably\nwant to start by filtering for *Critical* , *Error* , and *Warning* events:\n\nEvery log entry has a summary that includes a timestamp and short description\nof the event. You can correlate your project's behavior with these log timestamps\nto determine if they are related, and reference the description to narrow down\nthe cause.\n\nIn the example below, an `UnparseableJsonResponse` error was returned, likely\nas the result of a syntax or timeout error when recieving this JSON response\nfrom the webhook:\n\nYou may also want to look for *Debug* events with a similar timestamp, as they\ncan include additional information about other events. By expanding an error log\nand filtering by the `trace` field, the resulting list will show you all\nevents associated with the initial error:\n\n| **Note:** If the resulting trace filter doesn't show any additional results beyond the initial log, see if there is a *severity* line in the filter and try removing it.\n\nIn the example below, the debug messages associated with the original\nerror give us additional information about the issue, including a detailed\nerror description and the specific JSON response that caused the issue:\n\nDisabling log types\n-------------------\n\nSince the logs for your project are comprehensive, you may find it valuable to\nexclude certain event types from appearing in your logs by default (such as\nevents with PII or events that you deem to be clutter). You can create\nexclusions on your project's log page by navigating to **Resource usage** on the\nleft navigation bar and selecting the **Exclusions** tab:\n\nYou can learn more about excluding different log events at [Excluding\nLogs](https://cloud.google.com/logging/docs/exclusions) on the Stackdriver\ndocumentation."]]