
การติดตามแบบกระจายมีความสำคัญต่อการรับข้อมูลเชิงลึกและความสามารถในการสังเกตการณ์สถาปัตยกรรมของไมโครเซอร์วิสแบบหลายระดับ เมื่อคุณมีการเรียกใช้บริการแบบลูกโซ่จากบริการหนึ่งไปยังอีกบริการหนึ่ง เช่น จากบริการ A ไปยังบริการ B และไปยังบริการ C คุณควรทราบว่าการเรียกใช้สำเร็จหรือไม่ และมีเวลาในการตอบสนองในแต่ละขั้นตอนเท่าใด
ใน Spring Boot คุณสามารถใช้ Spring Cloud Sleuth เพื่อเพิ่มการตรวจสอบการติดตามแบบกระจายไปยังแอปพลิเคชันได้อย่างราบรื่น โดยค่าเริ่มต้น จะส่งต่อข้อมูลการติดตามไปยัง Zipkin ได้
Google Cloud Platform มี Stackdriver Trace ซึ่งเป็นบริการที่มีการจัดการที่ช่วยให้คุณจัดเก็บข้อมูลการติดตามได้โดยไม่ต้องจัดการอินสแตนซ์หรือพื้นที่เก็บข้อมูล Zipkin ของคุณเอง นอกจากนี้ Stackdriver Trace ยังสร้างรายงานการแจกแจงเวลาในการตอบสนองและตรวจหาการถดถอยของประสิทธิภาพโดยอัตโนมัติได้ด้วย
คุณมี 2 ตัวเลือกในการใช้ Stackdriver Trace จากแอปพลิเคชัน Spring Boot ดังนี้
- ใช้ Stackdriver Trace Zipkin Proxy และกำหนดค่า Spring Cloud Sleuth ให้ใช้พร็อกซีนี้เป็นปลายทาง Zipkin
- หรือใช้ Spring Cloud GCP Trace ซึ่งผสานรวมกับ Spring Cloud Sleuth ได้อย่างราบรื่นและส่งต่อข้อมูลการติดตามไปยัง Stackdriver Trace โดยตรง
ใน Codelab นี้ คุณจะได้เรียนรู้วิธีสร้างแอปพลิเคชัน Spring Boot ใหม่และใช้ Spring Cloud GCP Trace สำหรับการติดตามแบบกระจาย
สิ่งที่คุณจะได้เรียนรู้
- วิธีสร้างแอปพลิเคชัน Java ของ Spring Boot และกำหนดค่า Stackdriver Trace
สิ่งที่ต้องมี
- โปรเจ็กต์ Google Cloud Platform
- เบราว์เซอร์ เช่น Chrome หรือ Firefox
- มีความคุ้นเคยกับโปรแกรมแก้ไขข้อความมาตรฐานของ Linux เช่น Vim, EMAC หรือ Nano
คุณจะใช้บทแนะนำนี้อย่างไร
คุณจะให้คะแนนประสบการณ์ในการสร้างเว็บแอป HTML/CSS เท่าใด
คุณจะให้คะแนนประสบการณ์การใช้บริการ Google Cloud Platform เท่าใด
การตั้งค่าสภาพแวดล้อมแบบเรียนรู้ด้วยตนเอง
หากยังไม่มีบัญชี Google (Gmail หรือ Google Apps) คุณต้องสร้างบัญชี ลงชื่อเข้าใช้คอนโซล Google Cloud Platform (console.cloud.google.com) แล้วสร้างโปรเจ็กต์ใหม่โดยทำดังนี้


โปรดจดจำรหัสโปรเจ็กต์ ซึ่งเป็นชื่อที่ไม่ซ้ำกันในโปรเจ็กต์ Google Cloud ทั้งหมด (ชื่อด้านบนถูกใช้ไปแล้วและจะใช้ไม่ได้ ขออภัย) ซึ่งจะเรียกว่า PROJECT_ID ในภายหลังใน Codelab นี้
จากนั้นคุณจะต้องเปิดใช้การเรียกเก็บเงินใน Cloud Console เพื่อใช้ทรัพยากร Google Cloud
การทำ Codelab นี้ไม่ควรมีค่าใช้จ่ายเกิน 2-3 ดอลลาร์ แต่ก็อาจมีค่าใช้จ่ายมากกว่านี้หากคุณตัดสินใจใช้ทรัพยากรเพิ่มเติมหรือปล่อยให้ทรัพยากรทำงานต่อไป (ดูส่วน "การล้างข้อมูล" ที่ท้ายเอกสารนี้)
ผู้ใช้ใหม่ของ Google Cloud Platform มีสิทธิ์ทดลองใช้ฟรี$300
Google Cloud Shell
แม้ว่าคุณจะใช้งาน Google Cloud และ Kubernetes จากระยะไกลในแล็ปท็อปได้ แต่ใน Codelab นี้เราจะใช้ Google Cloud Shell ซึ่งเป็นสภาพแวดล้อมบรรทัดคำสั่งที่ทำงานในระบบคลาวด์
เปิดใช้งาน Google Cloud Shell
จาก GCP Console ให้คลิกไอคอน Cloud Shell ในแถบเครื่องมือด้านขวาบน

จากนั้นคลิก "เริ่ม Cloud Shell"

การจัดสรรและเชื่อมต่อกับสภาพแวดล้อมจะใช้เวลาเพียงไม่กี่นาที

เครื่องเสมือนนี้มาพร้อมเครื่องมือพัฒนาทั้งหมดที่คุณต้องการ โดยมีไดเรกทอรีหลักขนาด 5 GB ที่คงอยู่ถาวร และทำงานบน Google Cloud ซึ่งช่วยเพิ่มประสิทธิภาพเครือข่ายและการตรวจสอบสิทธิ์ได้อย่างมาก คุณสามารถทำงานส่วนใหญ่ในแล็บนี้ได้โดยใช้เพียงเบราว์เซอร์หรือ Google Chromebook
เมื่อเชื่อมต่อกับ Cloud Shell แล้ว คุณควรเห็นว่าคุณได้รับการตรวจสอบสิทธิ์แล้วและระบบได้ตั้งค่าโปรเจ็กต์เป็น PROJECT_ID แล้ว
เรียกใช้คำสั่งต่อไปนี้ใน Cloud Shell เพื่อยืนยันว่าคุณได้รับการตรวจสอบสิทธิ์แล้ว
gcloud auth list
เอาต์พุตของคำสั่ง
Credentialed accounts:
 - <myaccount>@<mydomain>.com (active)
gcloud config list project
เอาต์พุตของคำสั่ง
[core]
project = <PROJECT_ID>
หากไม่ได้ตั้งค่าไว้ คุณตั้งค่าได้ด้วยคำสั่งนี้
gcloud config set project <PROJECT_ID>
เอาต์พุตของคำสั่ง
Updated property [core/project].
หลังจากเปิดใช้ Cloud Shell แล้ว คุณจะใช้บรรทัดคำสั่งเพื่อสร้างแอปพลิเคชัน Spring Boot ใหม่ด้วย Spring Initializr ได้โดยทำดังนี้
$ curl https://start.spring.io/starter.tgz -d packaging=jar \
  -d dependencies=web,lombok,cloud-gcp,cloud-starter-sleuth \
  -d baseDir=trace-service-one | tar -xzvf - \
  && cd trace-service-one
สร้างตัวควบคุม REST ใหม่โดยเพิ่มคลาสใหม่
src/main/java/com/example/demo/WorkController.java
package com.example.demo;

import lombok.extern.slf4j.Slf4j;
import org.springframework.web.bind.annotation.GetMapping;
import org.springframework.web.bind.annotation.RestController;

import java.util.Random;

@RestController
@Slf4j
public class WorkController {
  Random r = new Random();

  public void meeting() {
    try {
      log.info("meeting...");
      // Delay for random number of milliseconds.
      Thread.sleep(r.nextInt(500));
    } catch (InterruptedException e) {
    }
  }

  @GetMapping("/")
  public String work() {
    // What is work? Meetings!
    // When you hit this URL, it'll call meetings() 5 times.
    // Each time will have a random delay.
    log.info("starting to work");
    for (int i = 0; i < 5; i++) {
      this.meeting();
    }
    log.info("finished!");
    return "finished work!";
  }
}
คุณสามารถเริ่มแอปพลิเคชัน Spring Boot ได้ตามปกติด้วยปลั๊กอิน Spring Boot มาข้ามการทดสอบสำหรับห้องทดลองนี้กัน
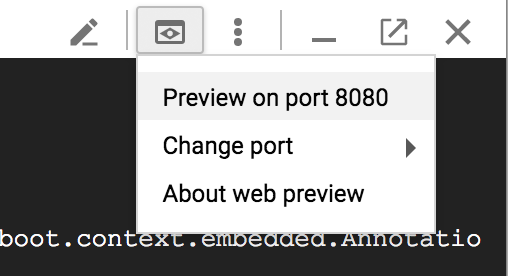
$ ./mvnw -DskipTests spring-boot:runเมื่อแอปพลิเคชันเริ่มทำงานแล้ว ให้คลิกไอคอนแสดงตัวอย่างเว็บ  ในแถบเครื่องมือ Cloud Shell แล้วเลือกแสดงตัวอย่างบนพอร์ต 8080
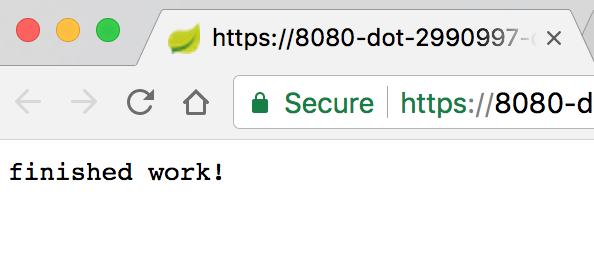
หลังจากรอสักครู่ คุณจะเห็นผลลัพธ์ดังนี้
ใน Cloud Shell คุณควรเห็นข้อความบันทึกที่มีรหัสการติดตามและรหัสช่วงด้วย

เปิดใช้ Stackdriver Trace API
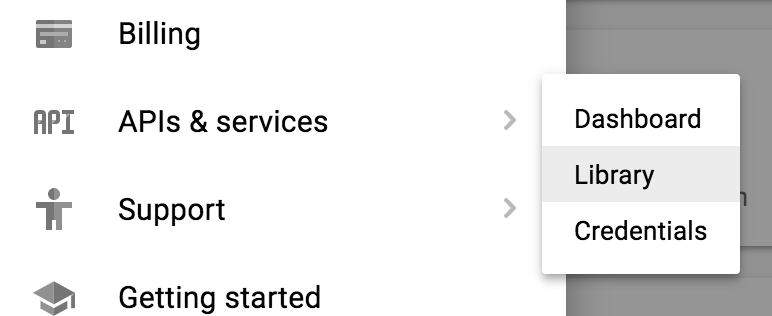
คุณต้องเปิดใช้ Stackdriver Trace API ก่อนจึงจะใช้ Stackdriver Trace เพื่อจัดเก็บข้อมูลการติดตามได้ หากต้องการเปิดใช้ API ให้ไปที่ API Services → Library
ค้นหา Stackdriver Trace
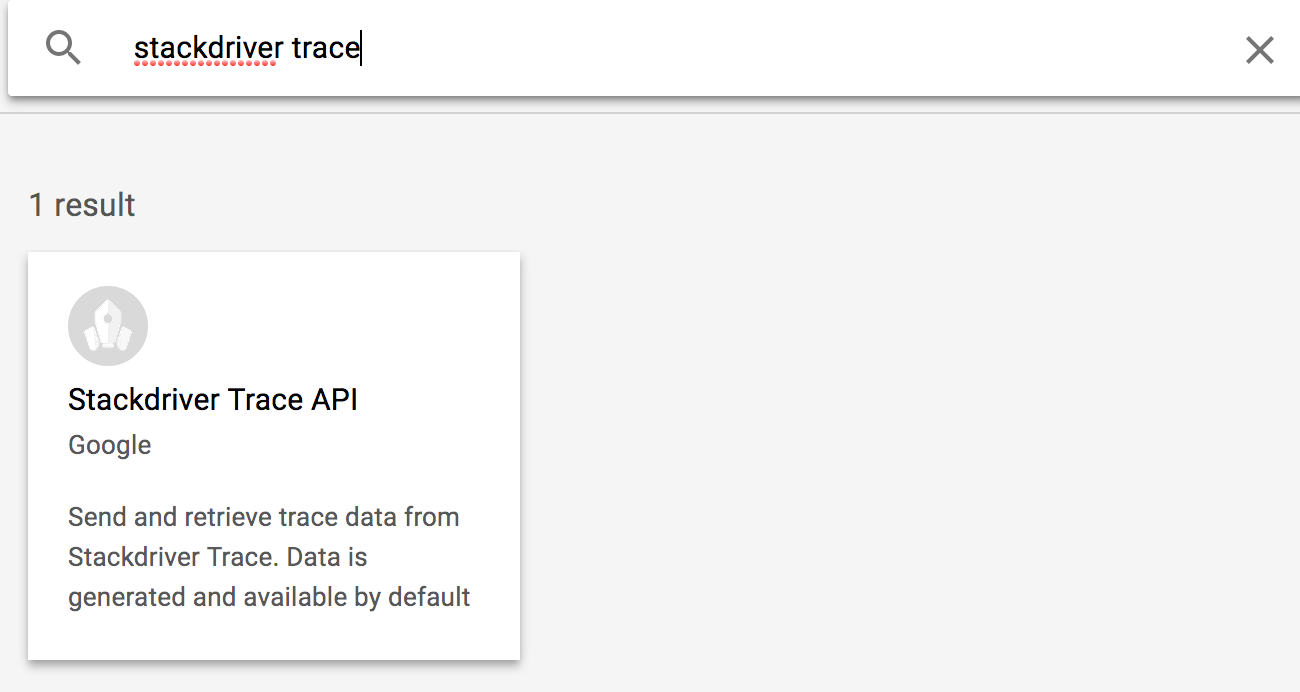
คลิก Stackdriver Trace API แล้วคลิกเปิดใช้หากยังไม่ได้เปิดใช้
ตั้งค่าข้อมูลรับรองเริ่มต้นของแอปพลิเคชัน
สำหรับแล็บนี้ คุณจะต้องกำหนดค่าข้อมูลเข้าสู่ระบบเริ่มต้นของแอปพลิเคชัน Spring Cloud GCP Trace Starter จะเลือกข้อมูลเข้าสู่ระบบนี้โดยอัตโนมัติ
ก่อนอื่น ให้เข้าสู่ระบบโดยทำดังนี้
$ gcloud auth application-default login
You are running on a Google Compute Engine virtual machine.
The service credentials associated with this virtual machine
will automatically be used by Application Default
Credentials, so it is not necessary to use this command.
If you decide to proceed anyway, your user credentials may be visible
to others with access to this virtual machine. Are you sure you want
to authenticate with your personal account?
Do you want to continue (Y/n)? Y

Go to the following link in your browser:
    https://accounts.google.com/o/oauth2/auth...
Enter verification code: ...
คลิกลิงก์เพื่อเปิดแท็บเบราว์เซอร์ใหม่ แล้วคลิกอนุญาต
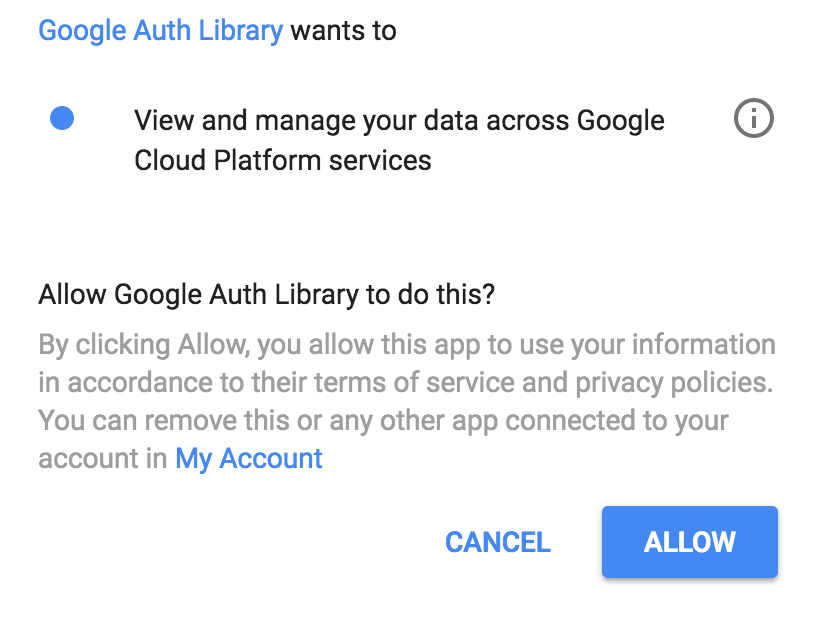
จากนั้นคัดลอกและวางรหัสยืนยันกลับลงใน Cloud Shell แล้วกด Enter คุณควรเห็นข้อมูลต่อไปนี้
Credentials saved to file: [/tmp/tmp.jm9bnQ4R9Q/application_default_credentials.json]
These credentials will be used by any library that requests
Application Default Credentials.
เพิ่ม Spring Cloud GCP Trace
ในบริการนี้ เราใช้ Spring Cloud Sleuth สำหรับการติดตามอยู่แล้ว มาเพิ่มตัวเริ่มต้นของ Spring Cloud GCP Trace เพื่อส่งต่อข้อมูลไปยัง Stackdriver Trace กัน
เพิ่มการอ้างอิง Spring Cloud GCP Trace
pom.xml
<project>
  ...
  <dependencies>
    ...
    <!-- Add Stackdriver Trace Starter -->
    <dependency>
      <groupId>org.springframework.cloud</groupId>
      <artifactId>spring-cloud-gcp-starter-trace</artifactId>
    </dependency>
  </dependencies>
  ...
</project>
โดยค่าเริ่มต้น Spring Cloud Sleuth จะไม่สุ่มตัวอย่างทุกคำขอ เพื่อช่วยให้การทดสอบง่ายขึ้นเล็กน้อย ให้เพิ่มอัตราการสุ่มตัวอย่างเป็น 100% ใน application.properties เพื่อให้เราเห็นข้อมูลการติดตาม รวมถึงละเว้น URL บางรายการที่เราไม่สนใจ
$ echo "
spring.sleuth.sampler.probability=1.0
spring.sleuth.web.skipPattern=(^cleanup.*|.+favicon.*)
" > src/main/resources/application.properties
เรียกใช้แอปพลิเคชันอีกครั้ง แล้วใช้ตัวอย่างเว็บของ Cloud Shell เพื่อดูแอปพลิเคชัน
$ export GOOGLE_CLOUD_PROJECT=`gcloud config list --format 'value(core.project)'`
$ ./mvnw -DskipTests spring-boot:run
โดยค่าเริ่มต้น Spring Cloud GCP Trace จะจัดกลุ่มข้อมูลการติดตามและส่งออกทุกๆ 10 วินาที หรือเมื่อได้รับข้อมูลการติดตามขั้นต่ำ คุณกำหนดค่าได้และดูข้อมูลเพิ่มเติมได้ในเอกสารอ้างอิงการติดตาม Spring Cloud GCP
ส่งคำขอไปยังบริการ
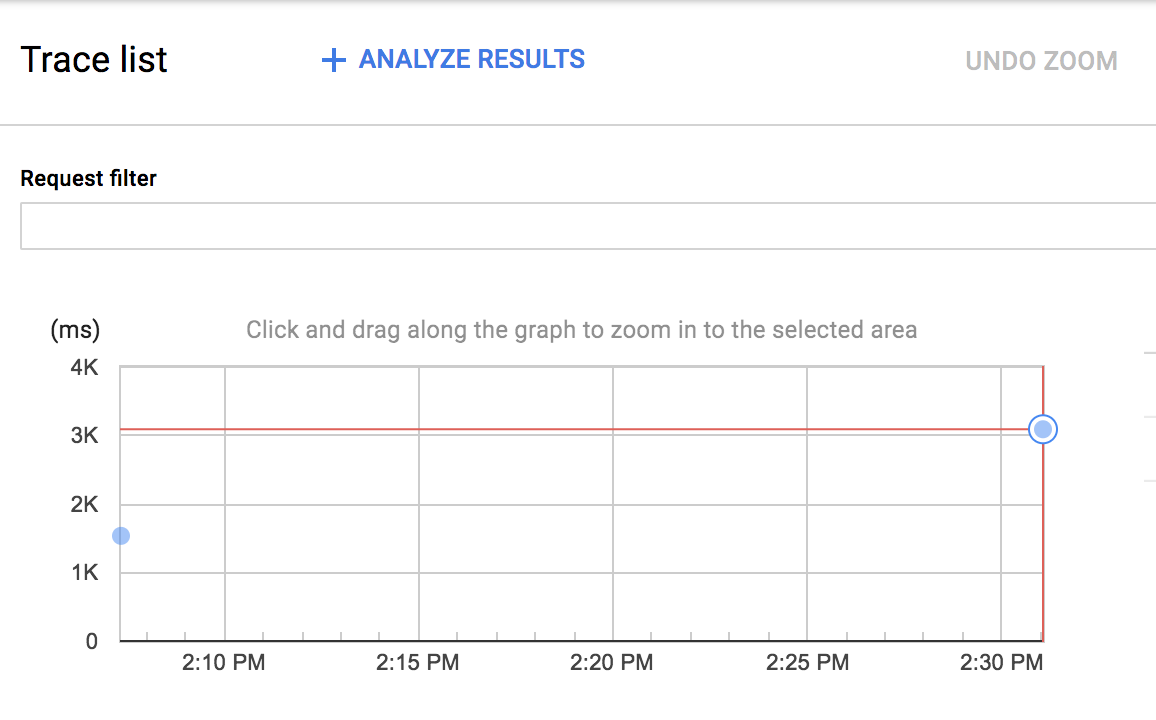
$ curl localhost:8080ใน Cloud Console ให้ไปที่ Stackdriver → Trace → รายการ Trace
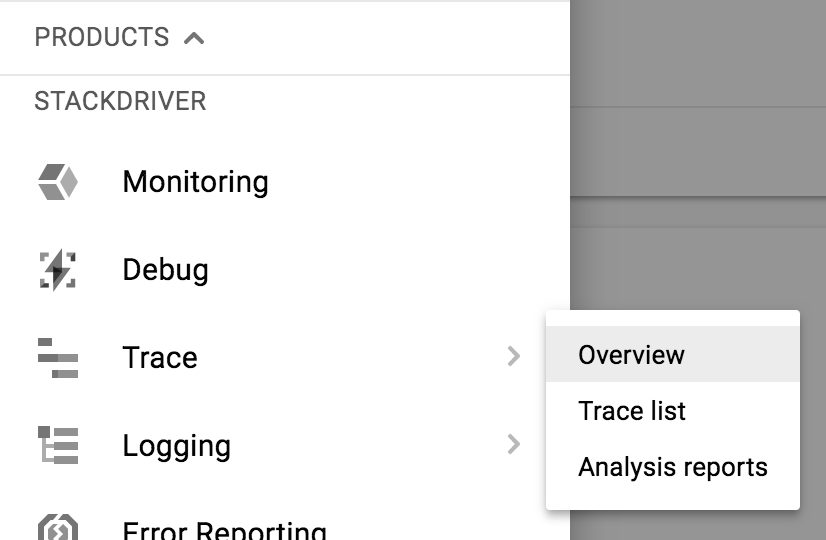
ที่ด้านบน ให้จำกัดช่วงเวลาเป็น 1 ชั่วโมง โดยค่าเริ่มต้น Auto Reload จะเปิดอยู่ ดังนั้นเมื่อข้อมูลการติดตามมาถึง ข้อมูลดังกล่าวควรแสดงในคอนโซล
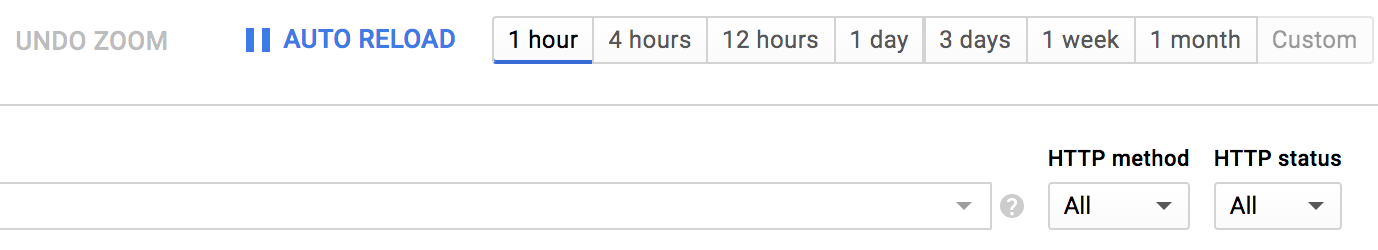
ข้อมูลการติดตามควรปรากฏในเวลาประมาณ 30 วินาที
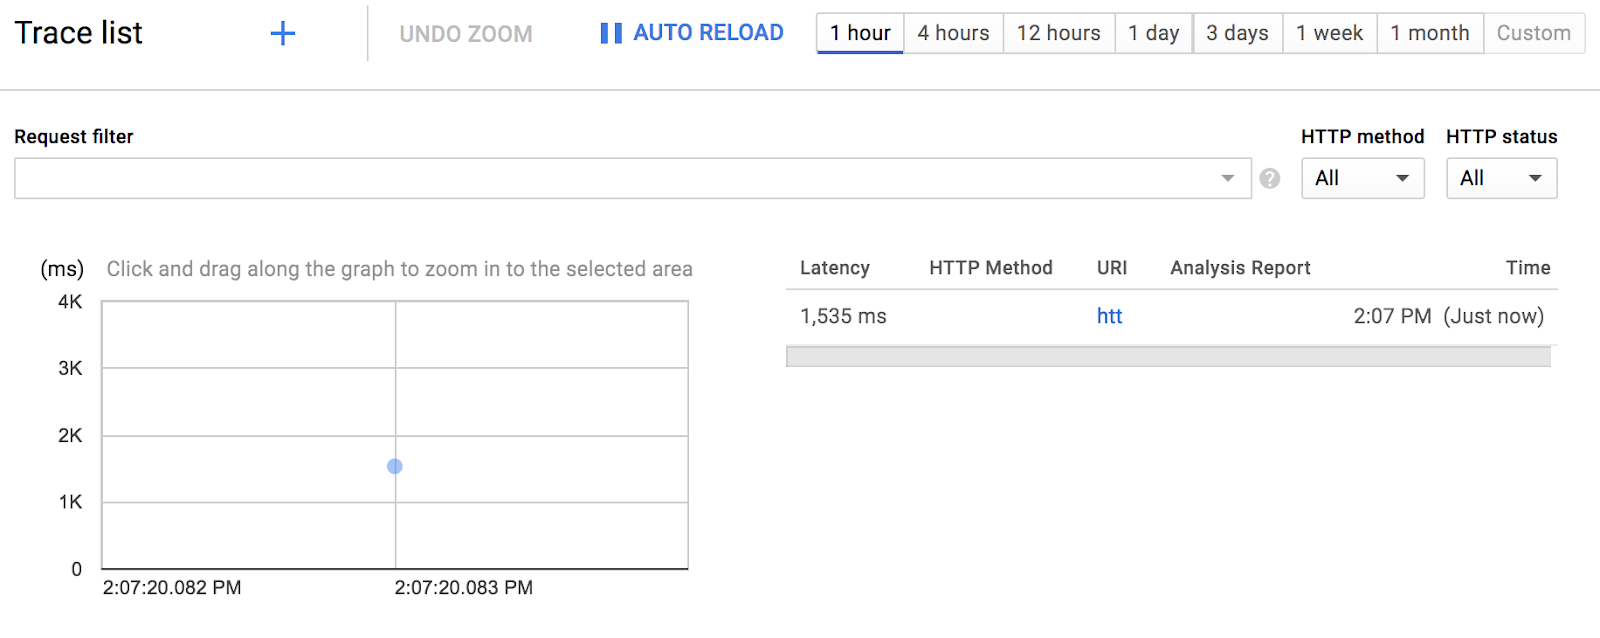
คลิกจุดสีน้ำเงินเพื่อดูรายละเอียดการติดตาม
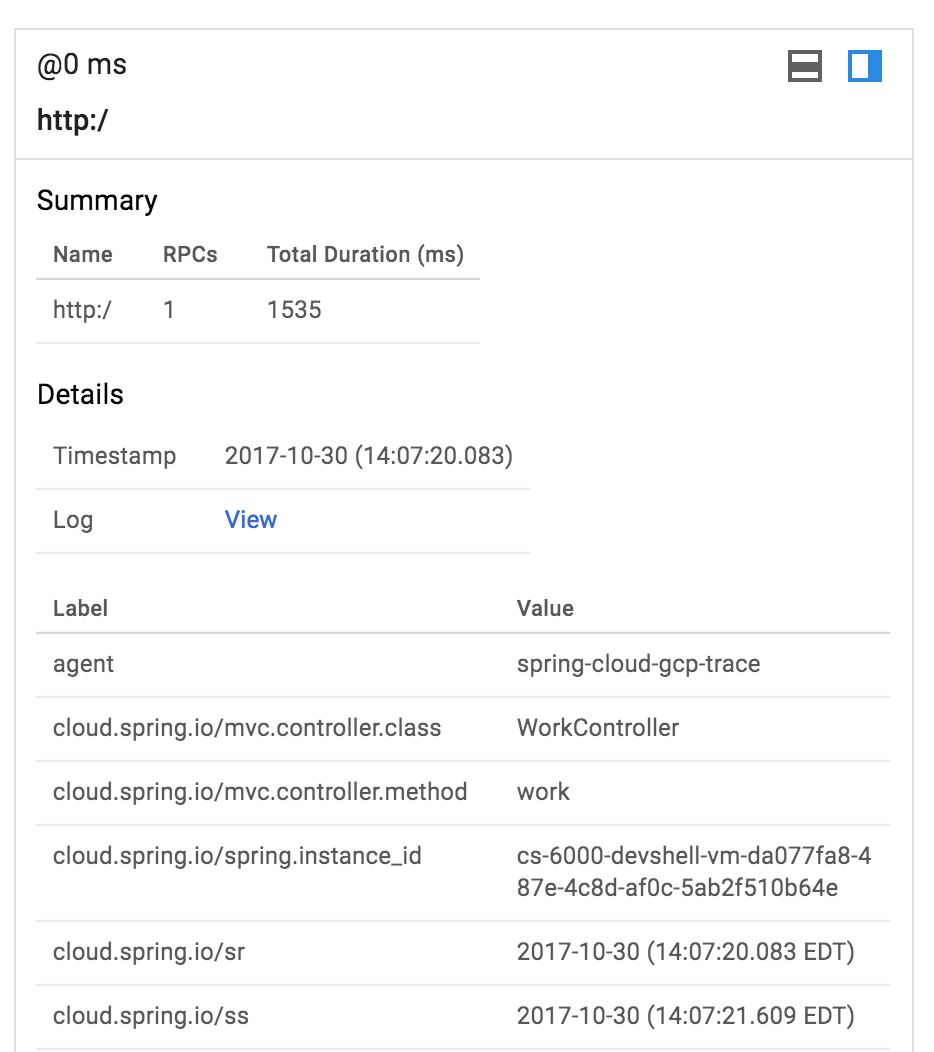
ง่ายมากเลยใช่ไหม
เปิดเซสชัน Cloud Shell ใหม่โดยคลิกไอคอน +

ในเซสชันใหม่ ให้สร้างแอปพลิเคชัน Spring Boot ที่ 2 โดยทำดังนี้
$ curl https://start.spring.io/starter.tgz -d packaging=jar \
  -d dependencies=web,lombok,cloud-gcp,cloud-starter-sleuth \
  -d baseDir=trace-service-two | tar -xzvf - \
  && cd trace-service-two
สร้างตัวควบคุม REST ใหม่โดยเพิ่มคลาสใหม่
src/main/java/com/example/demo/MeetingController.java
package com.example.demo;

import lombok.extern.slf4j.Slf4j;
import org.springframework.web.bind.annotation.GetMapping;
import org.springframework.web.bind.annotation.RestController;

import java.util.Random;

@RestController
@Slf4j
public class MeetingController {
  Random r = new Random();

  @GetMapping("/meet")
  public String meeting() {
    try {
      log.info("meeting...");
      Thread.sleep(r.nextInt(500 - 20 + 1) + 20);
    } catch (InterruptedException e) {
    }
    return "finished meeting";
  }
}
เพิ่ม Spring Cloud GCP Trace ลงใน pom.xml
pom.xml
<project>
  ...
  <dependencies>
    ...
    <!-- Add Stackdriver Trace starter -->
    <dependency>
      <groupId>org.springframework.cloud</groupId>
      <artifactId>spring-cloud-gcp-starter-trace</artifactId>
    </dependency>
  </dependencies>
  ...
</project>
กำหนดค่า Sleuth ให้สุ่มตัวอย่างคำขอ 100% ดังนี้
src/main/resources/application.properties
$ echo "
spring.sleuth.sampler.probability=1.0
spring.sleuth.web.skipPattern=(^cleanup.*|.+favicon.*)
" > src/main/resources/application.properties
สุดท้าย คุณสามารถเริ่มแอปพลิเคชัน Spring Boot บนพอร์ต 8081 ด้วยปลั๊กอิน Spring Boot ได้โดยใช้คำสั่งต่อไปนี้
$ export GOOGLE_CLOUD_PROJECT=`gcloud config list --format 'value(core.project)'`
$ ./mvnw -DskipTests spring-boot:run -Dserver.port=8081
ขณะที่ trace-service-two ทำงานอยู่ ให้กลับไปที่หน้าต่างเซสชัน Cloud Shell แรกและแก้ไข trace-service-one
ก่อนอื่นให้เริ่มต้นใช้งาน Bean RestTemplate ใหม่
src/main/java/com/example/demo/DemoApplication.java
package com.example.demo;

...

import org.springframework.web.client.RestTemplate;
import org.springframework.context.annotation.Bean;

@SpringBootApplication
public class DemoApplication {
        @Bean
        public RestTemplate restTemplate() {
                return new RestTemplate();
        }

        public static void main(String[] args) {
                SpringApplication.run(DemoApplication.class, args);
        }
}
ใน WorkController.meeting() ให้โทรออกไปยังบริการการประชุม
src/main/java/com/example/demo/WorkController.java
package com.example.demo;

...
import org.springframework.web.client.RestTemplate;
import org.springframework.beans.factory.annotation.Autowired;

@RestController
@Slf4j
public class WorkController {
  @Autowired
  RestTemplate restTemplate;

  public void meeting() {
    String result = restTemplate.getForObject("http://localhost:8081/meet", String.class);
    log.info(result);
  }

  ...
}
เริ่มบริการอีกครั้งและทริกเกอร์ปลายทางจากตัวอย่างเว็บโดยทำดังนี้
$ export GOOGLE_CLOUD_PROJECT=`gcloud config list --format 'value(core.project)'`
$ ./mvnw -DskipTests spring-boot:run
ในทั้ง 2 หน้าต่างเซสชัน คุณควรเห็นข้อความบันทึกที่มีการส่งต่อรหัสการติดตามจากบริการหนึ่งไปยังอีกบริการหนึ่ง
ในรายการการติดตามของ Stackdriver Trace คุณควรเห็นการติดตามที่ 2 ดังนี้
คุณคลิกจุดสีน้ำเงินใหม่เพื่อดูรายละเอียดการติดตามได้
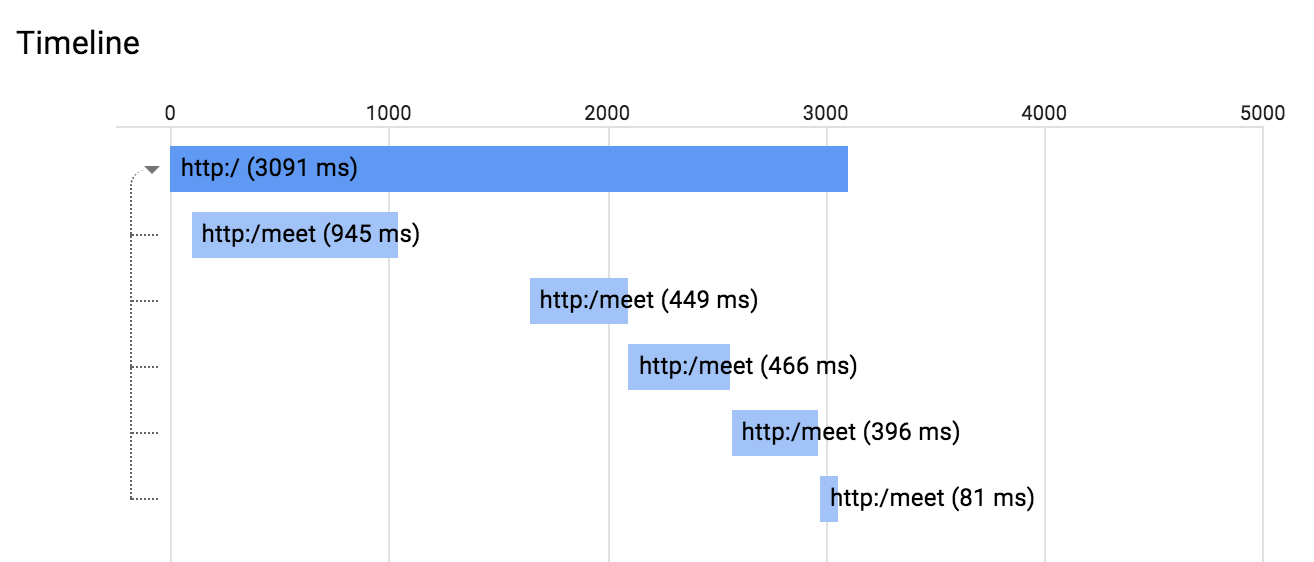
นอกจากนี้ คุณยังคลิกช่วงใดก็ได้ในไดอะแกรมนี้เพื่อดูรายละเอียดช่วงได้ด้วย
เมื่อใช้ Stackdriver Trace เป็นที่เก็บข้อมูลการติดตาม Stackdriver Trace จะใช้ข้อมูลเพื่อสร้างรายงานการกระจายเวลาในการตอบสนองได้ คุณจะต้องมีร่องรอยมากกว่า 100 รายการเพื่อสร้างรายงานเช่นนี้
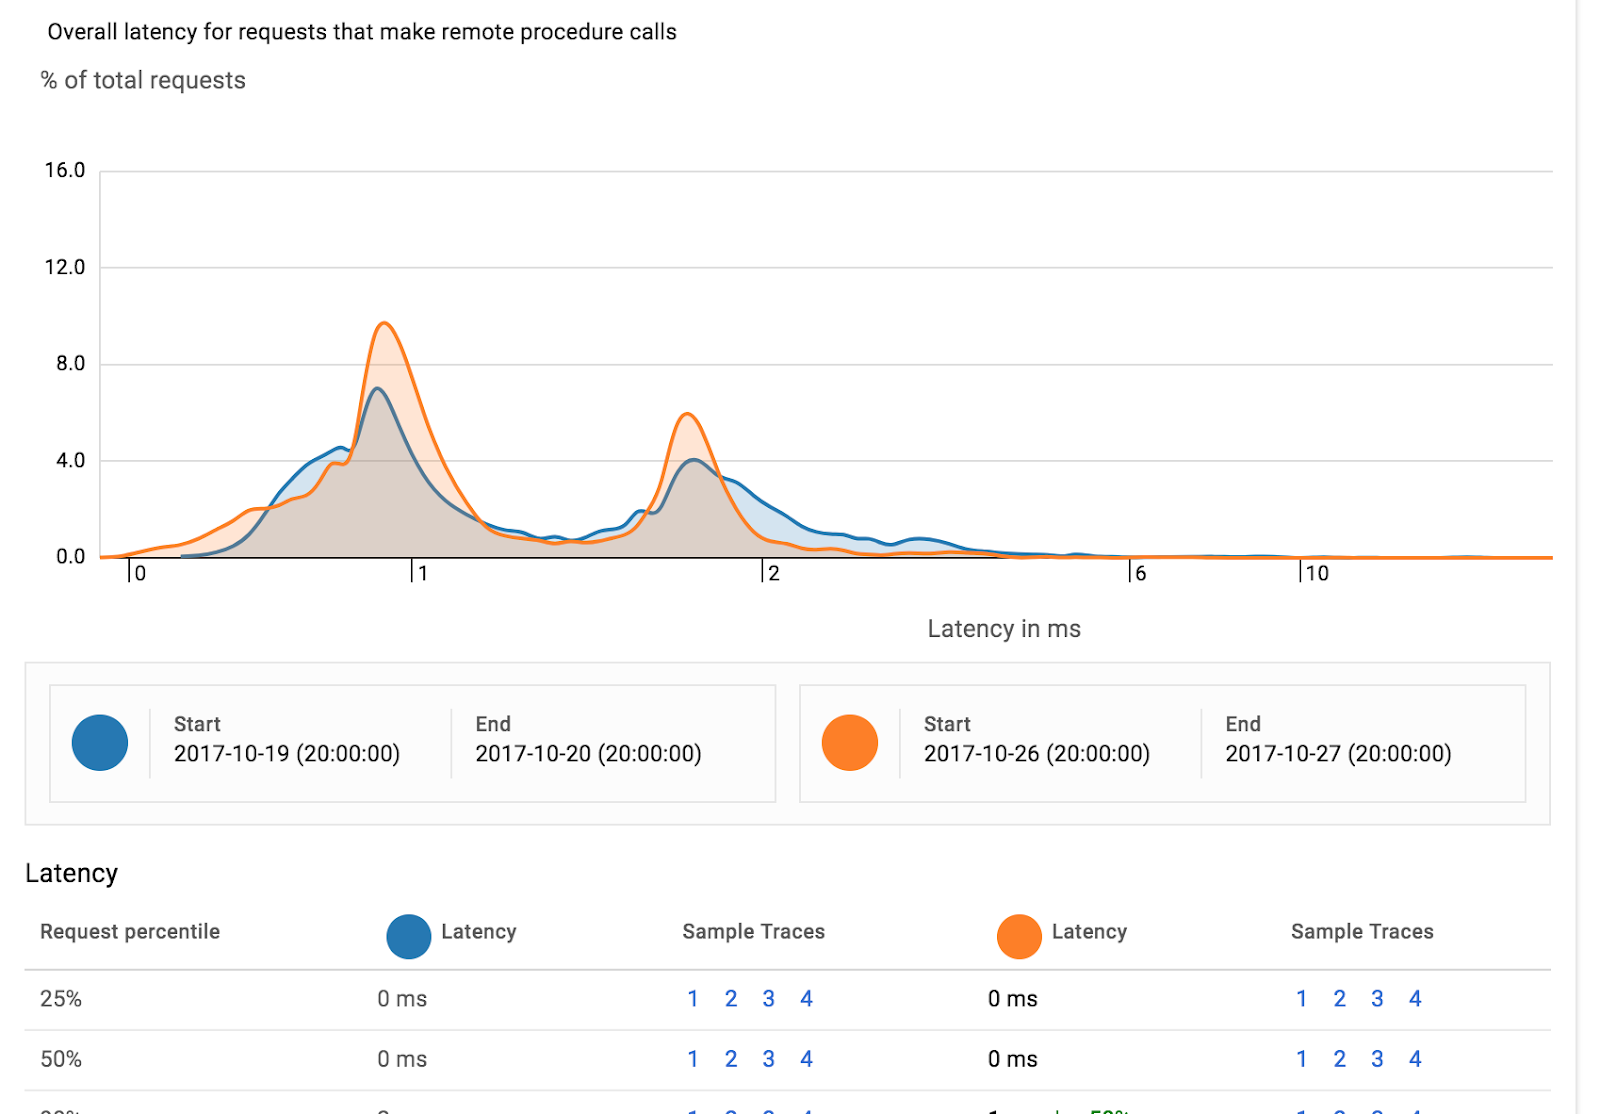
นอกจากนี้ Stackdriver Trace ยังตรวจหาการถดถอยของประสิทธิภาพของบริการเดียวกันโดยอัตโนมัติในช่วงเวลา 2 ช่วงที่แตกต่างกันได้ในรายงานการวิเคราะห์
ใน Lab นี้ คุณได้สร้างบริการอย่างง่าย 2 รายการและเพิ่มการติดตามแบบกระจายด้วย Spring Cloud Sleuth รวมถึงใช้ Spring Cloud GCP เพื่อส่งต่อข้อมูลการติดตามไปยัง Stackdriver Trace
คุณได้เรียนรู้วิธีเขียนเว็บแอปพลิเคชัน App Engine แรกแล้ว
ดูข้อมูลเพิ่มเติม
- Stackdriver Trace: https://cloud.google.com/trace/
- โปรเจ็กต์ Spring ใน GCP: http://cloud.spring.io/spring-cloud-gcp/
- ที่เก็บ Spring บน GCP ใน GitHub: https://github.com/spring-cloud/spring-cloud-gcp
- Java ใน Google Cloud Platform: https://cloud.google.com/java/
ใบอนุญาต
ผลงานนี้ได้รับอนุญาตภายใต้สัญญาอนุญาตครีเอทีฟคอมมอนส์สำหรับยอมรับสิทธิของผู้สร้าง (Creative Commons Attribution License) 2.0 แบบทั่วไป