
分散式追蹤對於深入瞭解多層微服務架構,以及觀察該架構的運作情形非常重要。當您將服務呼叫鏈結至服務呼叫時 (從服務 A 到服務 B 再到服務 C),請務必瞭解呼叫是否成功,以及每個步驟的延遲時間。
在 Spring Boot 中,您可以使用 Spring Cloud Sleuth,將分散式追蹤記錄檢測無縫新增至應用程式。預設情況下,它可以將追蹤資料轉送至 Zipkin。
Google Cloud Platform 提供 Stackdriver Trace 代管服務,可讓您儲存追蹤資料,不必管理自己的 Zipkin 執行個體或儲存空間。Stackdriver Trace 也會產生延遲分布報告,並自動偵測效能回歸。
您可以透過下列兩種方式,從 Spring Boot 應用程式使用 Stackdriver Trace:
- 使用 Stackdriver Trace Zipkin Proxy,並將 Spring Cloud Sleuth 設定為使用這個 Proxy 做為 Zipkin 端點
- 或者,您也可以使用 Spring Cloud GCP Trace,與 Spring Cloud Sleuth 無縫整合,並將追蹤資料直接轉送至 Stackdriver Trace。
在本程式碼研究室中,您將瞭解如何建構新的 Spring Boot 應用程式,並使用 Spring Cloud GCP Trace 進行分散式追蹤。
課程內容
- 如何建立 Spring Boot Java 應用程式並設定 Stackdriver Trace。
軟硬體需求
您會如何使用這個教學課程?
您對建構 HTML/CSS 網頁應用程式的體驗滿意嗎?
您對使用 Google Cloud Platform 服務的體驗有何評價?
自行設定環境
如果您還沒有 Google 帳戶 (Gmail 或 Google 應用程式),請先建立帳戶。登入 Google Cloud Platform 主控台 (console.cloud.google.com),然後建立新專案:


請記住專案 ID,這是所有 Google Cloud 專案中不重複的名稱 (上述名稱已遭占用,因此不適用於您,抱歉!)。本程式碼研究室稍後會將其稱為 PROJECT_ID。
接著,您必須在 Cloud 控制台中啟用帳單,才能使用 Google Cloud 資源。
完成本程式碼研究室的費用不應超過數美元,但如果您決定使用更多資源,或是將資源繼續執行 (請參閱本文件結尾的「清除」一節),則可能會增加費用。
Google Cloud Platform 新使用者享有價值 $300 美元的免費試用期。
Google Cloud Shell
雖然可以透過筆電遠端操作 Google Cloud 和 Kubernetes,但在本程式碼研究室中,我們將使用 Google Cloud Shell,也就是在雲端執行的指令列環境。
啟用 Google Cloud Shell
在 GCP 主控台的右上角工具列中,按一下 Cloud Shell 圖示:

然後按一下「啟動 Cloud Shell」:

佈建並連線至環境的作業只需幾分鐘的時間:

這部虛擬機器搭載各種您需要的開發工具,提供永久的 5 GB 主目錄,而且在 Google Cloud 中運作,可大幅提升網路效能和驗證功能。您只需要瀏覽器或 Google Chromebook,就能完成這個實驗室的大部分工作 (甚至全部)。
連線至 Cloud Shell 後,您應會發現自己通過驗證,且專案已設為您的「PROJECT_ID」PROJECT_ID。
在 Cloud Shell 中執行下列指令,確認您已通過驗證:
gcloud auth list
指令輸出
Credentialed accounts:
 - <myaccount>@<mydomain>.com (active)
gcloud config list project
指令輸出
[core]
project = <PROJECT_ID>
如未設定,請輸入下列指令設定專案:
gcloud config set project <PROJECT_ID>
指令輸出
Updated property [core/project].
啟動 Cloud Shell 後,您可以使用指令列,透過 Spring Initializr 產生新的 Spring Boot 應用程式:
$ curl https://start.spring.io/starter.tgz -d packaging=jar \
  -d dependencies=web,lombok,cloud-gcp,cloud-starter-sleuth \
  -d baseDir=trace-service-one | tar -xzvf - \
  && cd trace-service-one
新增類別,建立新的 REST 控制器:
src/main/java/com/example/demo/WorkController.java
package com.example.demo;

import lombok.extern.slf4j.Slf4j;
import org.springframework.web.bind.annotation.GetMapping;
import org.springframework.web.bind.annotation.RestController;

import java.util.Random;

@RestController
@Slf4j
public class WorkController {
  Random r = new Random();

  public void meeting() {
    try {
      log.info("meeting...");
      // Delay for random number of milliseconds.
      Thread.sleep(r.nextInt(500));
    } catch (InterruptedException e) {
    }
  }

  @GetMapping("/")
  public String work() {
    // What is work? Meetings!
    // When you hit this URL, it'll call meetings() 5 times.
    // Each time will have a random delay.
    log.info("starting to work");
    for (int i = 0; i < 5; i++) {
      this.meeting();
    }
    log.info("finished!");
    return "finished work!";
  }
}
您可以使用 Spring Boot 外掛程式正常啟動 Spring Boot 應用程式。我們略過本實驗室的測試:
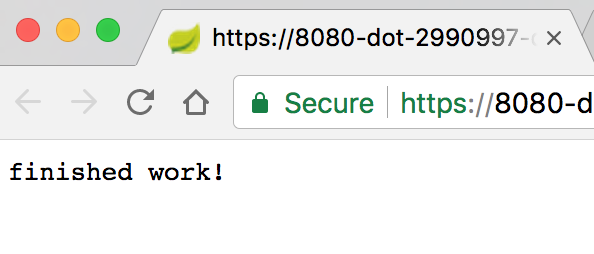
$ ./mvnw -DskipTests spring-boot:run應用程式啟動後,請按一下 Cloud Shell 工具列中的「網頁預覽」圖示  ,然後選擇「透過以下通訊埠預覽:8080」。

稍待片刻,您應該會看到結果:
在 Cloud Shell 中,您也應該會看到含有追蹤 ID 和範圍 ID 的記錄訊息:

啟用 Stackdriver Trace API
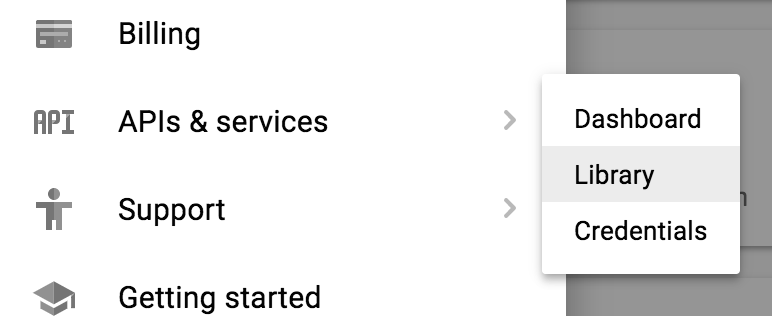
如要使用 Stackdriver Trace 儲存追蹤資料,請先啟用 Stackdriver Trace API。如要啟用 API,請依序前往「API 服務」→「程式庫」
搜尋 Stackdriver Trace
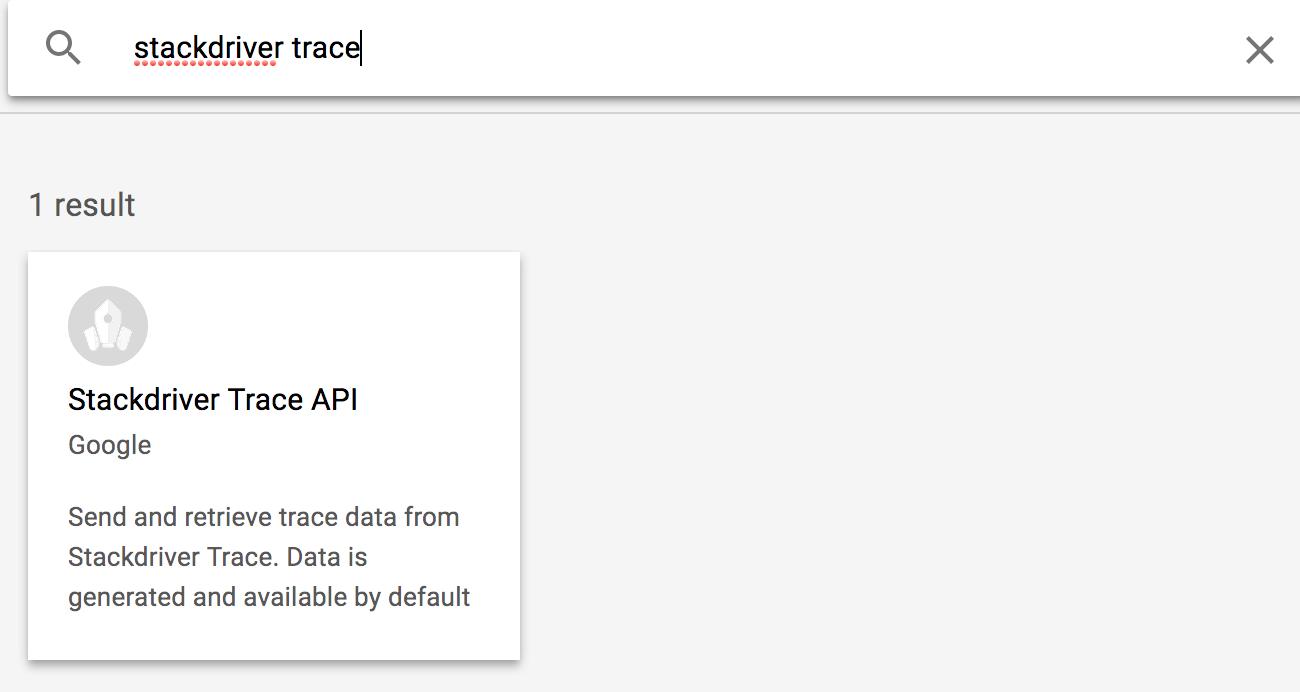
如果尚未啟用,請依序點選「Stackdriver Trace API」和「啟用」。
設定應用程式預設憑證
在本實驗室中,您需要設定應用程式預設憑證。Spring Cloud GCP Trace 啟動器會自動擷取這項憑證。
首先,請登入:
$ gcloud auth application-default login
You are running on a Google Compute Engine virtual machine.
The service credentials associated with this virtual machine
will automatically be used by Application Default
Credentials, so it is not necessary to use this command.
If you decide to proceed anyway, your user credentials may be visible
to others with access to this virtual machine. Are you sure you want
to authenticate with your personal account?
Do you want to continue (Y/n)? Y

Go to the following link in your browser:
    https://accounts.google.com/o/oauth2/auth...
Enter verification code: ...
按一下連結開啟新的瀏覽器分頁,然後按一下「允許」
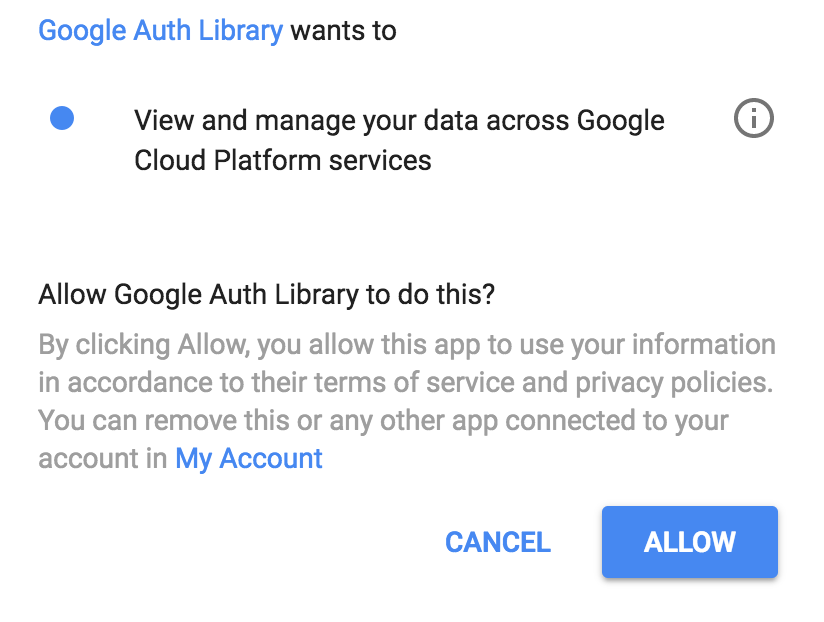
然後將驗證碼複製並貼回 Cloud Shell,然後按下 Enter 鍵。畫面上會顯示下列訊息:
Credentials saved to file: [/tmp/tmp.jm9bnQ4R9Q/application_default_credentials.json]
These credentials will be used by any library that requests
Application Default Credentials.
新增 Spring Cloud GCP Trace
我們已在這項服務中使用 Spring Cloud Sleuth 進行追蹤。請新增 Spring Cloud GCP Trace 啟動器,將資料轉送至 Stackdriver Trace。
新增 Spring Cloud GCP Trace 依附元件:
pom.xml
<project>
  ...
  <dependencies>
    ...
    <!-- Add Stackdriver Trace Starter -->
    <dependency>
      <groupId>org.springframework.cloud</groupId>
      <artifactId>spring-cloud-gcp-starter-trace</artifactId>
    </dependency>
  </dependencies>
  ...
</project>
根據預設,Spring Cloud Sleuth 不會對每個要求取樣。為方便測試,請在 application.properties 中將取樣率提高至 100%,確保我們能看到追蹤資料,並忽略一些我們不關心的網址:
$ echo "
spring.sleuth.sampler.probability=1.0
spring.sleuth.web.skipPattern=(^cleanup.*|.+favicon.*)
" > src/main/resources/application.properties
再次執行應用程式,並使用 Cloud Shell 網頁預覽功能查看應用程式:
$ export GOOGLE_CLOUD_PROJECT=`gcloud config list --format 'value(core.project)'`
$ ./mvnw -DskipTests spring-boot:run
根據預設,Spring Cloud GCP Trace 會批次處理追蹤資料,並每 10 秒傳送一次,或是在收到最少數量的追蹤資料時傳送。您可以設定這項功能,詳情請參閱 Spring Cloud GCP Trace 參考說明文件。
向服務發出要求:
$ curl localhost:8080在 Cloud 控制台中,依序前往「Stackdriver」→「Trace」→「Trace list」
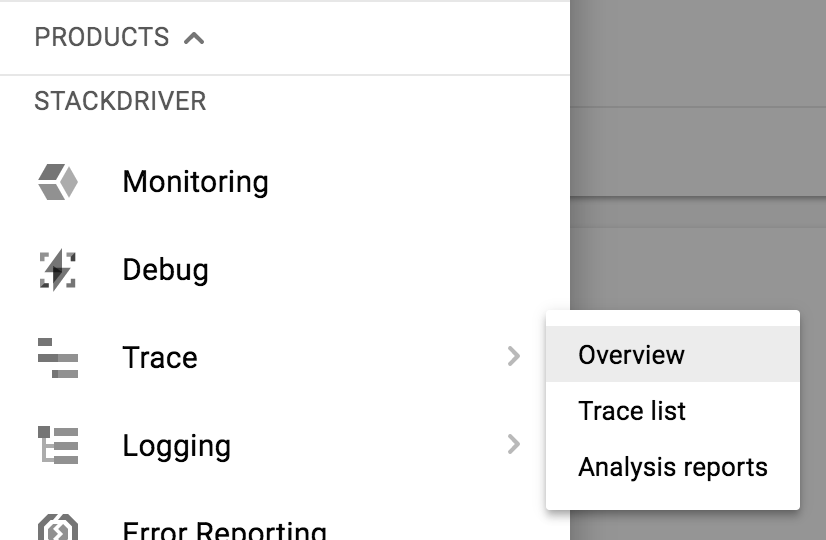
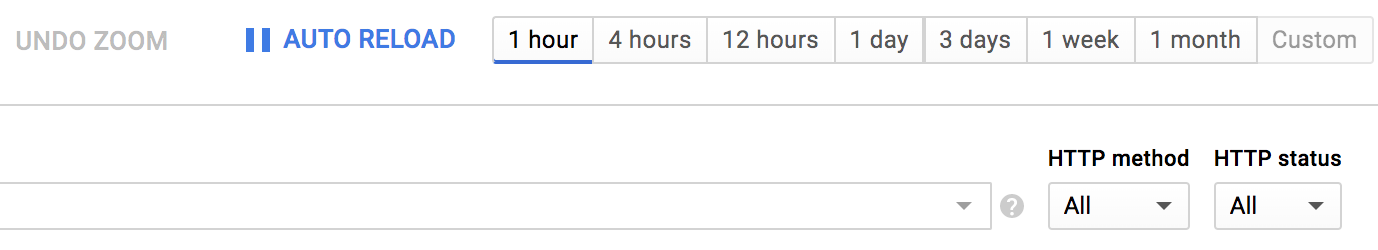
在頂端將時間範圍縮小至 1 小時。「自動重新載入」預設為開啟。因此,追蹤資料抵達時,應該會顯示在控制台中!
追蹤記錄資料應會在 30 秒內顯示。
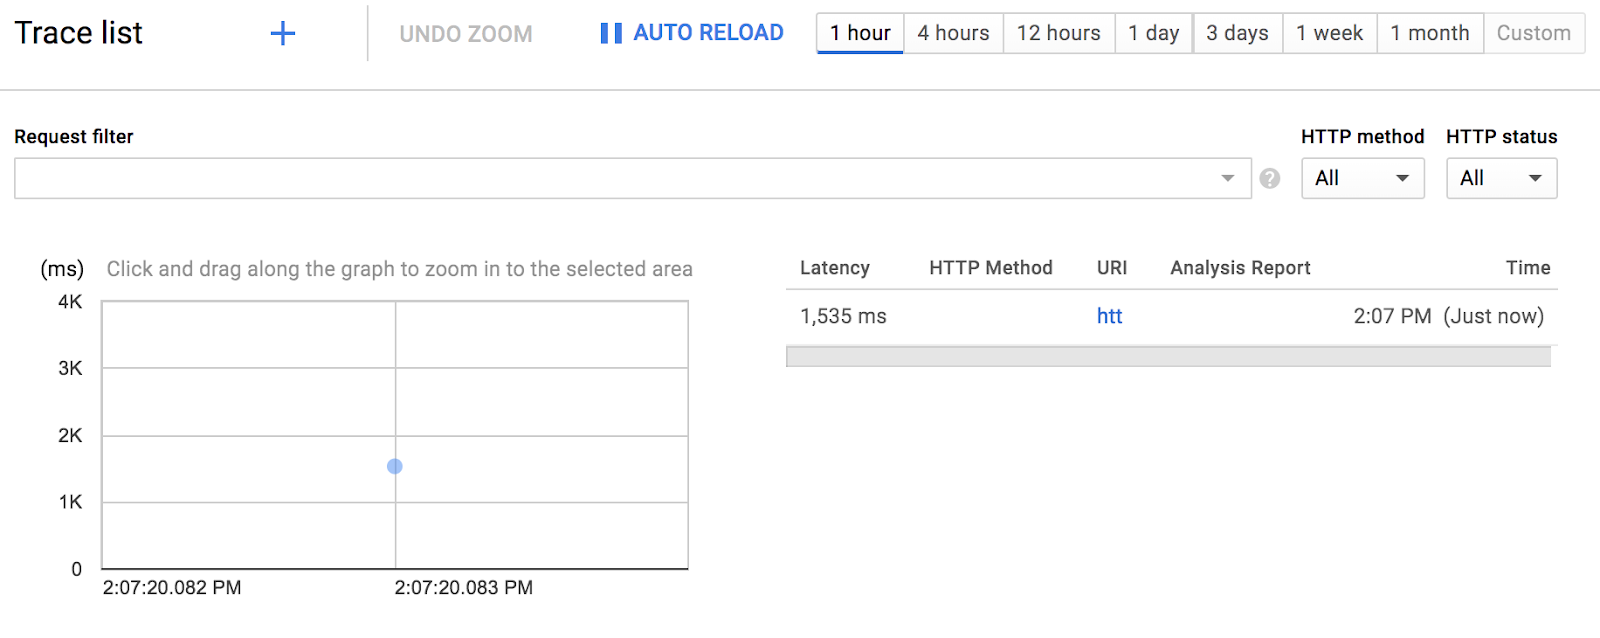
按一下藍色點即可查看追蹤詳細資料:
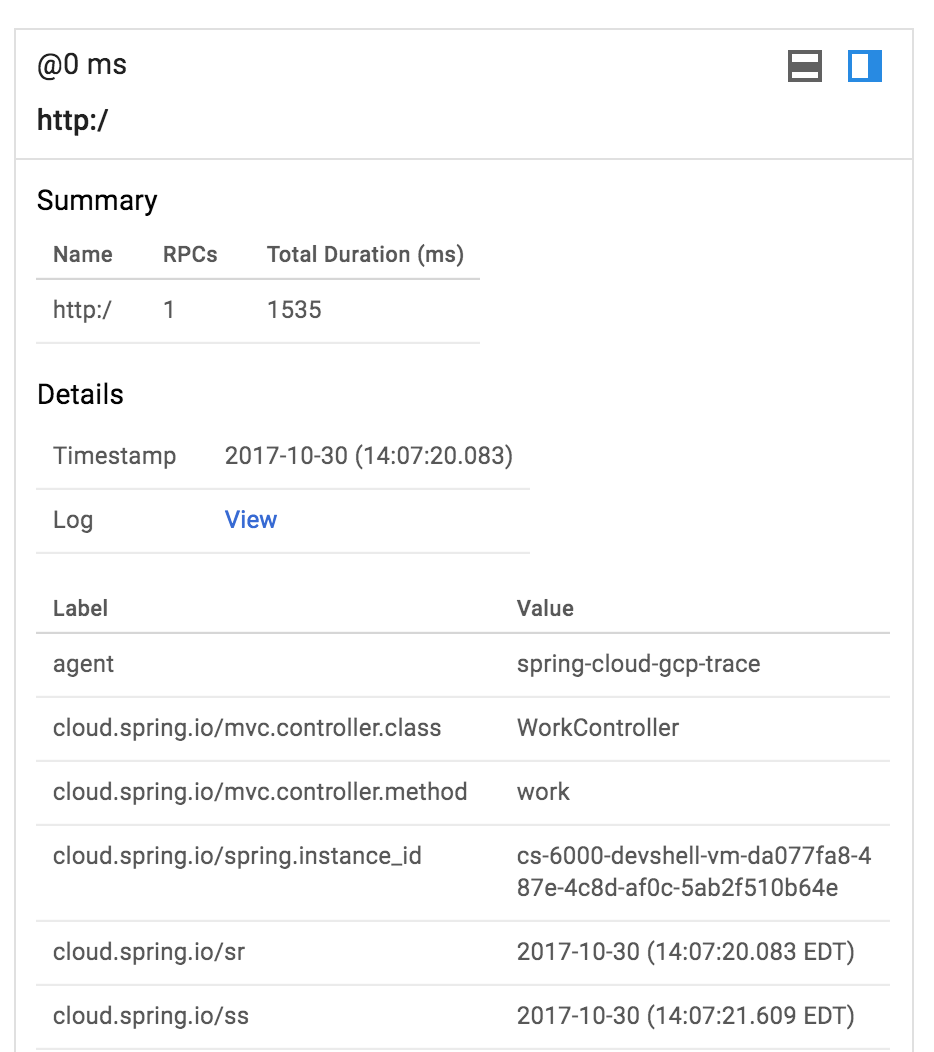
這很簡單!
按一下「+」圖示,開啟新的 Cloud Shell 工作階段:
在新工作階段中,建立第二個 Spring Boot 應用程式:
$ curl https://start.spring.io/starter.tgz -d packaging=jar \
  -d dependencies=web,lombok,cloud-gcp,cloud-starter-sleuth \
  -d baseDir=trace-service-two | tar -xzvf - \
  && cd trace-service-two
新增類別,建立新的 REST 控制器:
src/main/java/com/example/demo/MeetingController.java
package com.example.demo;

import lombok.extern.slf4j.Slf4j;
import org.springframework.web.bind.annotation.GetMapping;
import org.springframework.web.bind.annotation.RestController;

import java.util.Random;

@RestController
@Slf4j
public class MeetingController {
  Random r = new Random();

  @GetMapping("/meet")
  public String meeting() {
    try {
      log.info("meeting...");
      Thread.sleep(r.nextInt(500 - 20 + 1) + 20);
    } catch (InterruptedException e) {
    }
    return "finished meeting";
  }
}
在 pom.xml 中新增 Spring Cloud GCP Trace
pom.xml
<project>
  ...
  <dependencies>
    ...
    <!-- Add Stackdriver Trace starter -->
    <dependency>
      <groupId>org.springframework.cloud</groupId>
      <artifactId>spring-cloud-gcp-starter-trace</artifactId>
    </dependency>
  </dependencies>
  ...
</project>
將 Sleuth 設為對 100% 的要求取樣:
src/main/resources/application.properties
$ echo "
spring.sleuth.sampler.probability=1.0
spring.sleuth.web.skipPattern=(^cleanup.*|.+favicon.*)
" > src/main/resources/application.properties
最後,您可以使用 Spring Boot 外掛程式,在通訊埠 8081 上啟動 Spring Boot 應用程式:
$ export GOOGLE_CLOUD_PROJECT=`gcloud config list --format 'value(core.project)'`
$ ./mvnw -DskipTests spring-boot:run -Dserver.port=8081
在 trace-service-two 執行期間,返回第一個 Cloud Shell 工作階段視窗,並修改 trace-service-one。
首先,初始化新的 RestTemplate Bean:
src/main/java/com/example/demo/DemoApplication.java
package com.example.demo;

...

import org.springframework.web.client.RestTemplate;
import org.springframework.context.annotation.Bean;

@SpringBootApplication
public class DemoApplication {
        @Bean
        public RestTemplate restTemplate() {
                return new RestTemplate();
        }

        public static void main(String[] args) {
                SpringApplication.run(DemoApplication.class, args);
        }
}
在 WorkController.meeting() 中,撥打電話給會議服務。
src/main/java/com/example/demo/WorkController.java
package com.example.demo;

...
import org.springframework.web.client.RestTemplate;
import org.springframework.beans.factory.annotation.Autowired;

@RestController
@Slf4j
public class WorkController {
  @Autowired
  RestTemplate restTemplate;

  public void meeting() {
    String result = restTemplate.getForObject("http://localhost:8081/meet", String.class);
    log.info(result);
  }

  ...
}
再次啟動服務,然後從網頁預覽觸發端點:
$ export GOOGLE_CLOUD_PROJECT=`gcloud config list --format 'value(core.project)'`
$ ./mvnw -DskipTests spring-boot:run
在兩個工作階段視窗中,您應該會看到記錄訊息,且追蹤 ID 會從一個服務傳播到另一個服務。
在 Stackdriver Trace 的追蹤記錄清單中,您應該會看到第二個追蹤記錄:
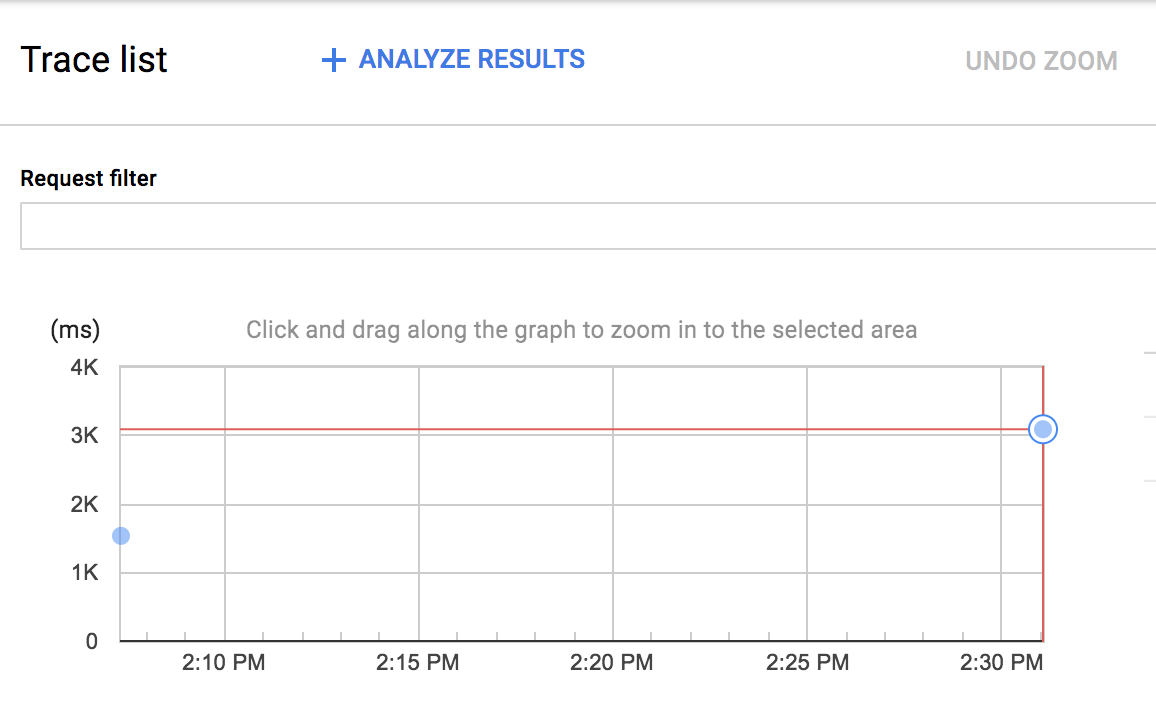
您可以點選新的藍色點,查看追蹤記錄詳細資料:
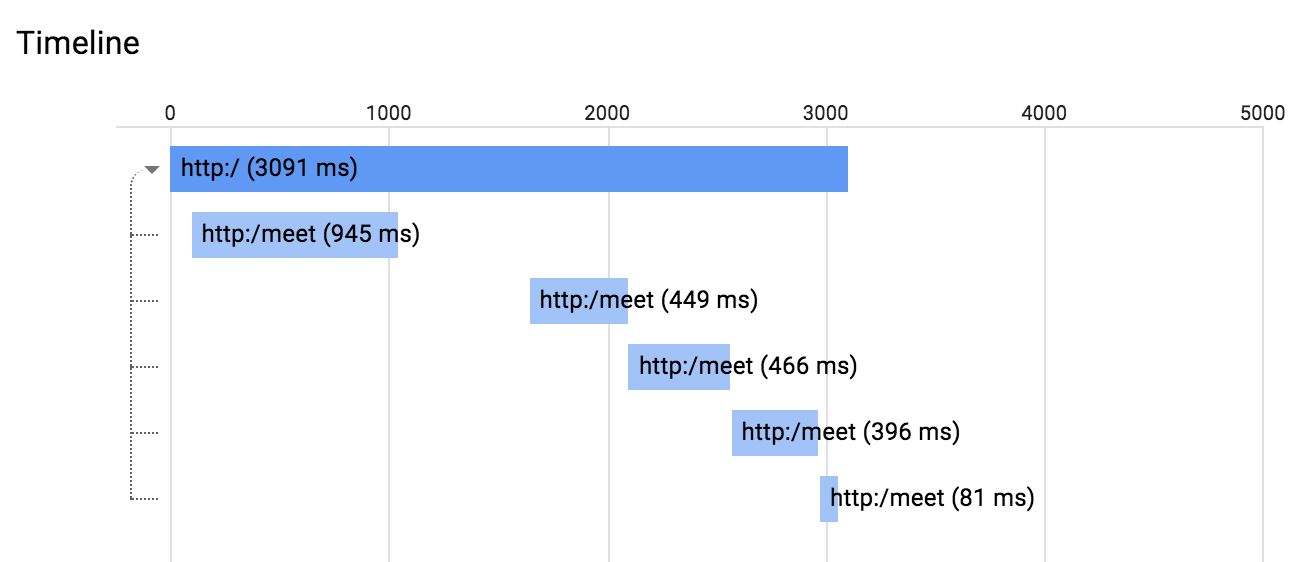
您也可以點選這張圖表中的任何時距,查看時距詳細資料。
使用 Stackdriver Trace 做為追蹤記錄資料儲存空間時,Stackdriver Trace 可以使用這些資料建立延遲時間分布報表。您需要超過 100 個追蹤記錄,才能建立這類報表:
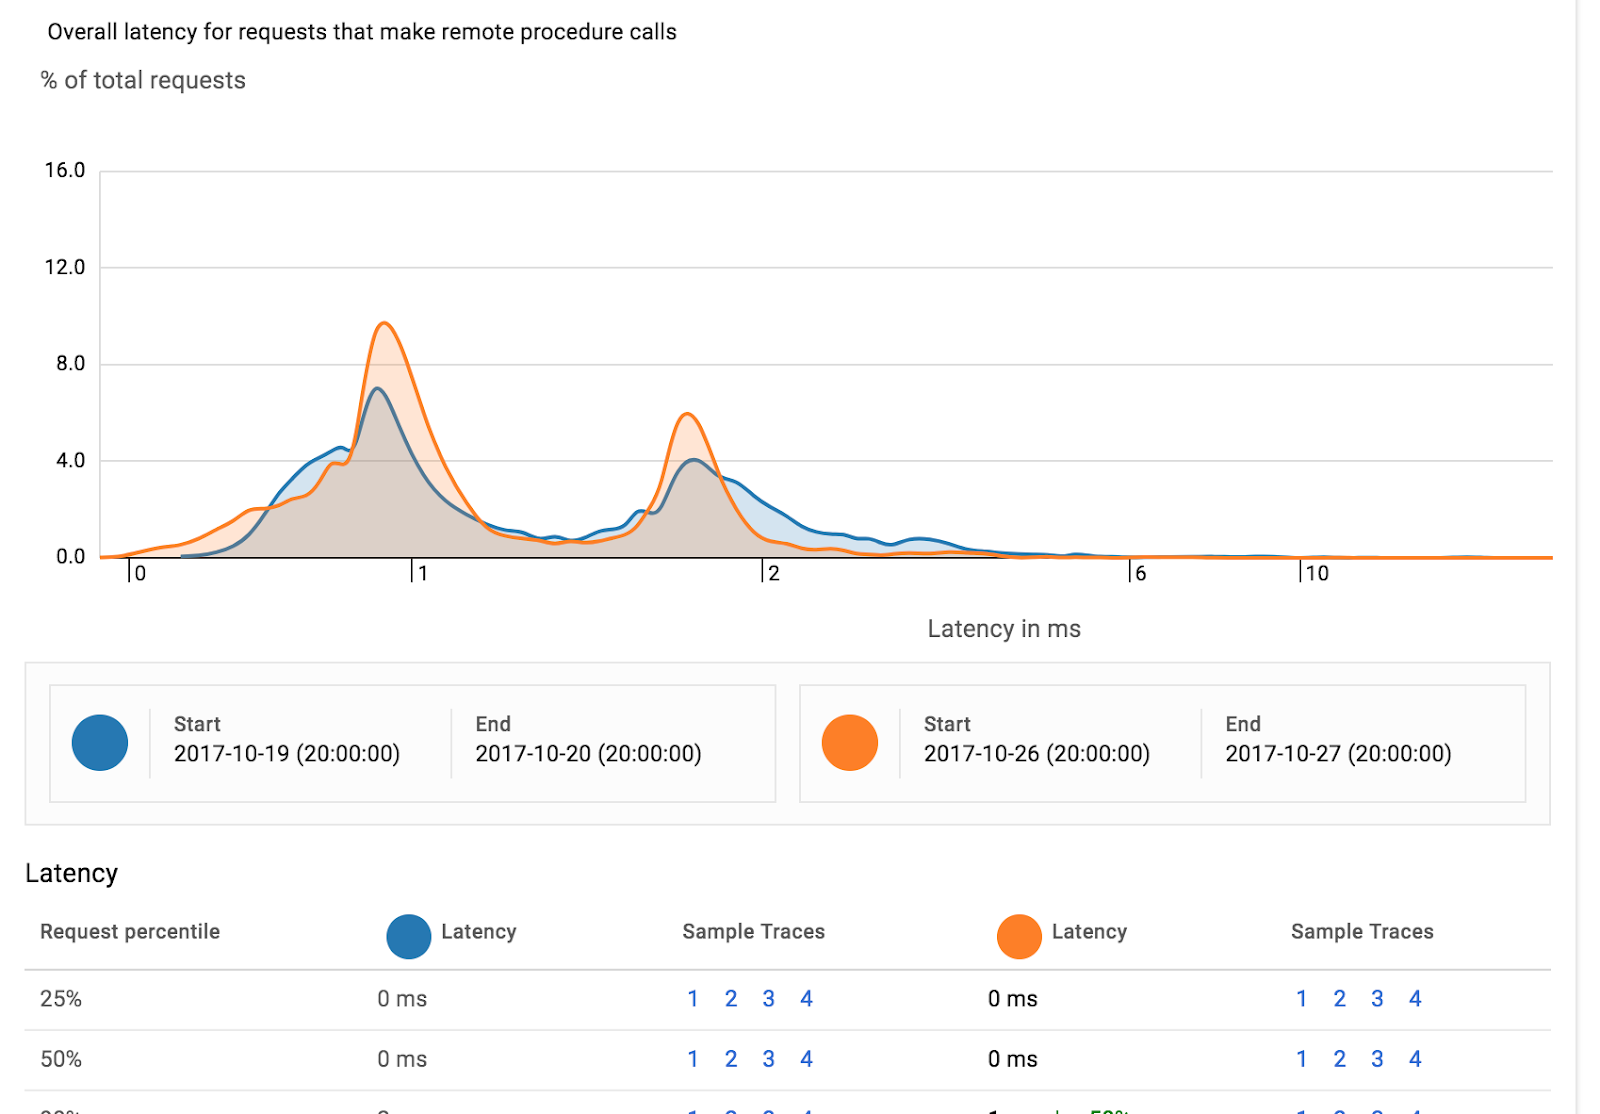
此外,Stackdriver Trace 還會在分析報表中,自動偵測同一項服務在兩個不同時間範圍內的效能回歸情形。
在本實驗室中,您建立了 2 項簡單的服務,並使用 Spring Cloud Sleuth 新增分散式追蹤功能,然後使用 Spring Cloud GCP 將追蹤記錄資訊轉送至 Stackdriver Trace。
您已學會如何編寫第一個 App Engine 網頁應用程式!
瞭解詳情
- Stackdriver Trace:https://cloud.google.com/trace/
- GCP 上的 Spring 專案:http://cloud.spring.io/spring-cloud-gcp/
- Spring on GCP GitHub 存放區:https://github.com/spring-cloud/spring-cloud-gcp
- 在 Google Cloud Platform 上使用 Java:https://cloud.google.com/java/
授權
這項內容採用的授權為 Creative Commons 姓名標示 2.0 通用授權。