Learning Rate and Convergence
This is the first of several Playground exercises. Playground is a program developed especially for this course to teach machine learning principles. Each Playground exercise in this course includes an embedded playground instance with presets.
Each Playground exercise generates a dataset. The label for this dataset has two possible values. You could think of those two possible values as spam vs. not spam or perhaps healthy trees vs. sick trees. The goal of most exercises is to tweak various hyperparameters to build a model that successfully classifies (separates or distinguishes) one label value from the other. Note that most data sets contain a certain amount of noise that will make it impossible to successfully classify every example.
Click the plus icon for an explanation of model visualization.
Each Playground exercise displays a visualization of the current state of the model. For example, here's a visualization:
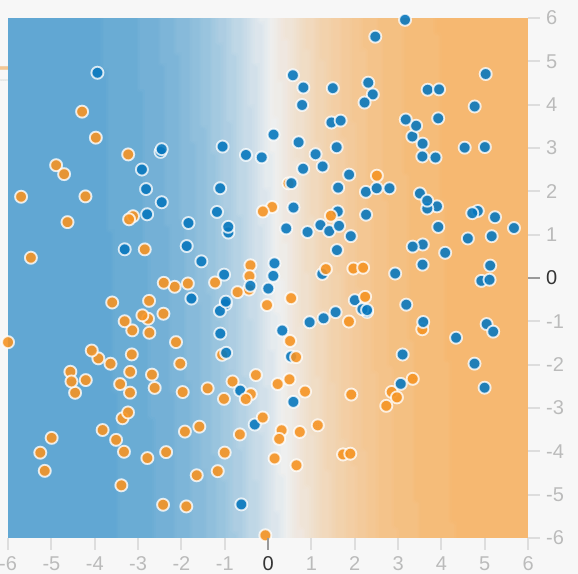
Note the following about the model visualization:
- Each axis represents a specific feature. In the case of spam vs. not spam, the features could be the word count and the number of recipients of the email.
- Each dot plots the feature values for one example of the data, such as an email.
- The color of the dot represents the class that the example belongs to. For example, the blue dots can represent non-spam emails while the orange dots can represent spam emails.
- The background color represents the model's prediction of where examples of that color should be found. A blue background around a blue dot means that the model is correctly predicting that example. Conversely, an orange background around a blue dot means that the model is incorrectly predicting that example.
- The background blues and oranges are scaled. For example, the left side of the visualization is solid blue but gradually fades to white in the center of the visualization. You can think of the color strength as suggesting the model's confidence in its guess. So solid blue means that the model is very confident about its guess and light blue means that the model is less confident. (The model visualization shown in the figure is doing a poor job of prediction.)
Use the visualization to judge your model's progress. ("Excellent—most of the blue dots have a blue background" or "Oh no! The blue dots have an orange background.") Beyond the colors, Playground also displays the model's current loss numerically. ("Oh no! Loss is going up instead of down.")
The interface for this exercise provides three buttons:
| Icon | Name | What it Does |
|---|---|---|
|
|
Reset | Resets Iterations to 0. Resets any weights that model had already learned. |
|
|
Step | Advance one iteration. With each iteration, the model changes—sometimes subtly and sometimes dramatically. |
|
|
Regenerate | Generates a new data set. Does not reset Iterations. |
In this first Playground exercise, you'll experiment with learning rate by performing two tasks.
Task 1: Notice the Learning rate menu at the top-right of Playground. The given Learning rate—3—is very high. Observe how that high Learning rate affects your model by clicking the "Step" button 10 or 20 times. After each early iteration, notice how the model visualization changes dramatically. You might even see some instability after the model appears to have converged. Also notice the lines running from x1 and x2 to the model visualization. The weights of these lines indicate the weights of those features in the model. That is, a thick line indicates a high weight.
Task 2: Do the following:
- Press the Reset button.
- Lower the Learning rate.
- Press the Step button a bunch of times.
How did the lower learning rate impact convergence? Examine both the number of steps needed for the model to converge, and also how smoothly and steadily the model converges. Experiment with even lower values of learning rate. Can you find a learning rate too slow to be useful? (You'll find a discussion just below the exercise.)