이제 데이터 세트를 조합하고 데이터의 주요 특성에 대한 유용한 정보를 얻었습니다. 다음으로 2단계에서 수집한 측정항목을 바탕으로
어떤 분류 모델을 사용해야 할지
생각해야 합니다. 이는 다음과 같은 질문을 하는 것을 의미합니다.
숫자 입력을 예상하는 알고리즘에 텍스트 데이터를 어떻게 제시할 수 있을까요?
이를 데이터 전처리 및 벡터화라고 합니다.
어떤 유형의 모델을 사용해야 하나요?
모델에 어떤 구성 매개변수를 사용해야 하나요?
수십 년간의 연구를 통해 Google은 다양한 데이터 전처리 및 모델 구성 옵션에 액세스할 수 있습니다. 그러나 선택할 수 있는 실행 가능한 옵션이 매우 많기 때문에 특정 문제의 복잡성과 범위가 크게 증가할 수 있습니다. 최선의 옵션이 명확하지 않을 수 있다는 점을 감안할 때, 단순한 해결책은 가능한 모든 옵션을 철저히 시도하고 직관을 통해 일부 선택 사항을 제거하는 것입니다. 하지만 엄청난 비용이 들 것입니다.
이 가이드에서는 텍스트 분류 모델을 선택하는 프로세스를 상당히 단순화합니다. 특정 데이터 세트에 대해 학습에 필요한 계산 시간을 최소화하면서 최대에 근접한 정확도를 달성하는 알고리즘을 찾는 것이 목표입니다. 12개의 데이터 세트를 사용하여 다양한 유형의 문제 (특히 감정 분석 및 주제 분류 문제)에 대해 다양한 데이터 전처리 기법과 모델 아키텍처 간에 번갈아 가며 다양한 (약 45만 개)의 실험을 실행했습니다. 이를 통해 최적의 선택에 영향을 주는 데이터 세트 매개변수를 식별할 수 있었습니다.
아래의 모델 선택 알고리즘과 플로우 차트는 실험을 요약한 것입니다. 용어에 사용된 일부 용어를 아직 이해하지 못하더라도 걱정하지 마세요. 이 가이드의 다음 섹션에서 이를 자세히 설명합니다.
데이터 준비 및 모델 빌드를 위한 알고리즘
샘플 수/샘플 비율당 단어 수를 계산합니다.
이 비율이 1, 500 미만인 경우 텍스트를 n-그램으로 토큰화하고 간단한 다층 퍼셉트론 (MLP) 모델을 사용하여 분류합니다 (아래 플로우 차트의 왼쪽 브랜치).
샘플을 단어 N-그램으로 나누고 N-그램을 벡터로 변환합니다.
벡터의 중요도를 평가하고 점수를 사용해 상위 20,000개를 선택합니다.
MLP 모델을 빌드합니다.
비율이 1, 500보다 크면 텍스트를 시퀀스로 토큰화하고 sepCNN 모델을 사용하여 분류합니다 (아래 플로우 차트의 오른쪽 분기).
샘플을 단어로 나누고 빈도에 따라 상위 2만 개의 단어를 선택합니다.
샘플을 단어 시퀀스 벡터로 변환합니다.
원래 샘플 수/샘플 비율당 단어 수가 15, 000개 미만일 경우 sepCNN 모델과 함께 미세 조정된 사전 학습된 임베딩을 사용하면 최상의 결과를 얻을 수 있습니다.
다양한 초매개변수 값으로 모델 성능을 측정하여 데이터 세트에 가장 적합한 모델 구성을 찾습니다.
아래 플로우 차트에서 노란색 상자는 데이터 및 모델 준비 프로세스를 나타냅니다. 회색 상자와 녹색 상자는 각 프로세스에서 고려한 선택 사항을 나타냅니다. 녹색 상자는 각 프로세스에 권장되는 선택을 나타냅니다.
이 플로우 차트를 첫 번째 실험을 구성하기 위한 시작점으로 사용할 수 있습니다. 낮은 계산 비용으로 높은 정확도를 제공하기 때문입니다. 그런 다음 후속 반복을 통해 초기 모델을 계속 개선할 수 있습니다.
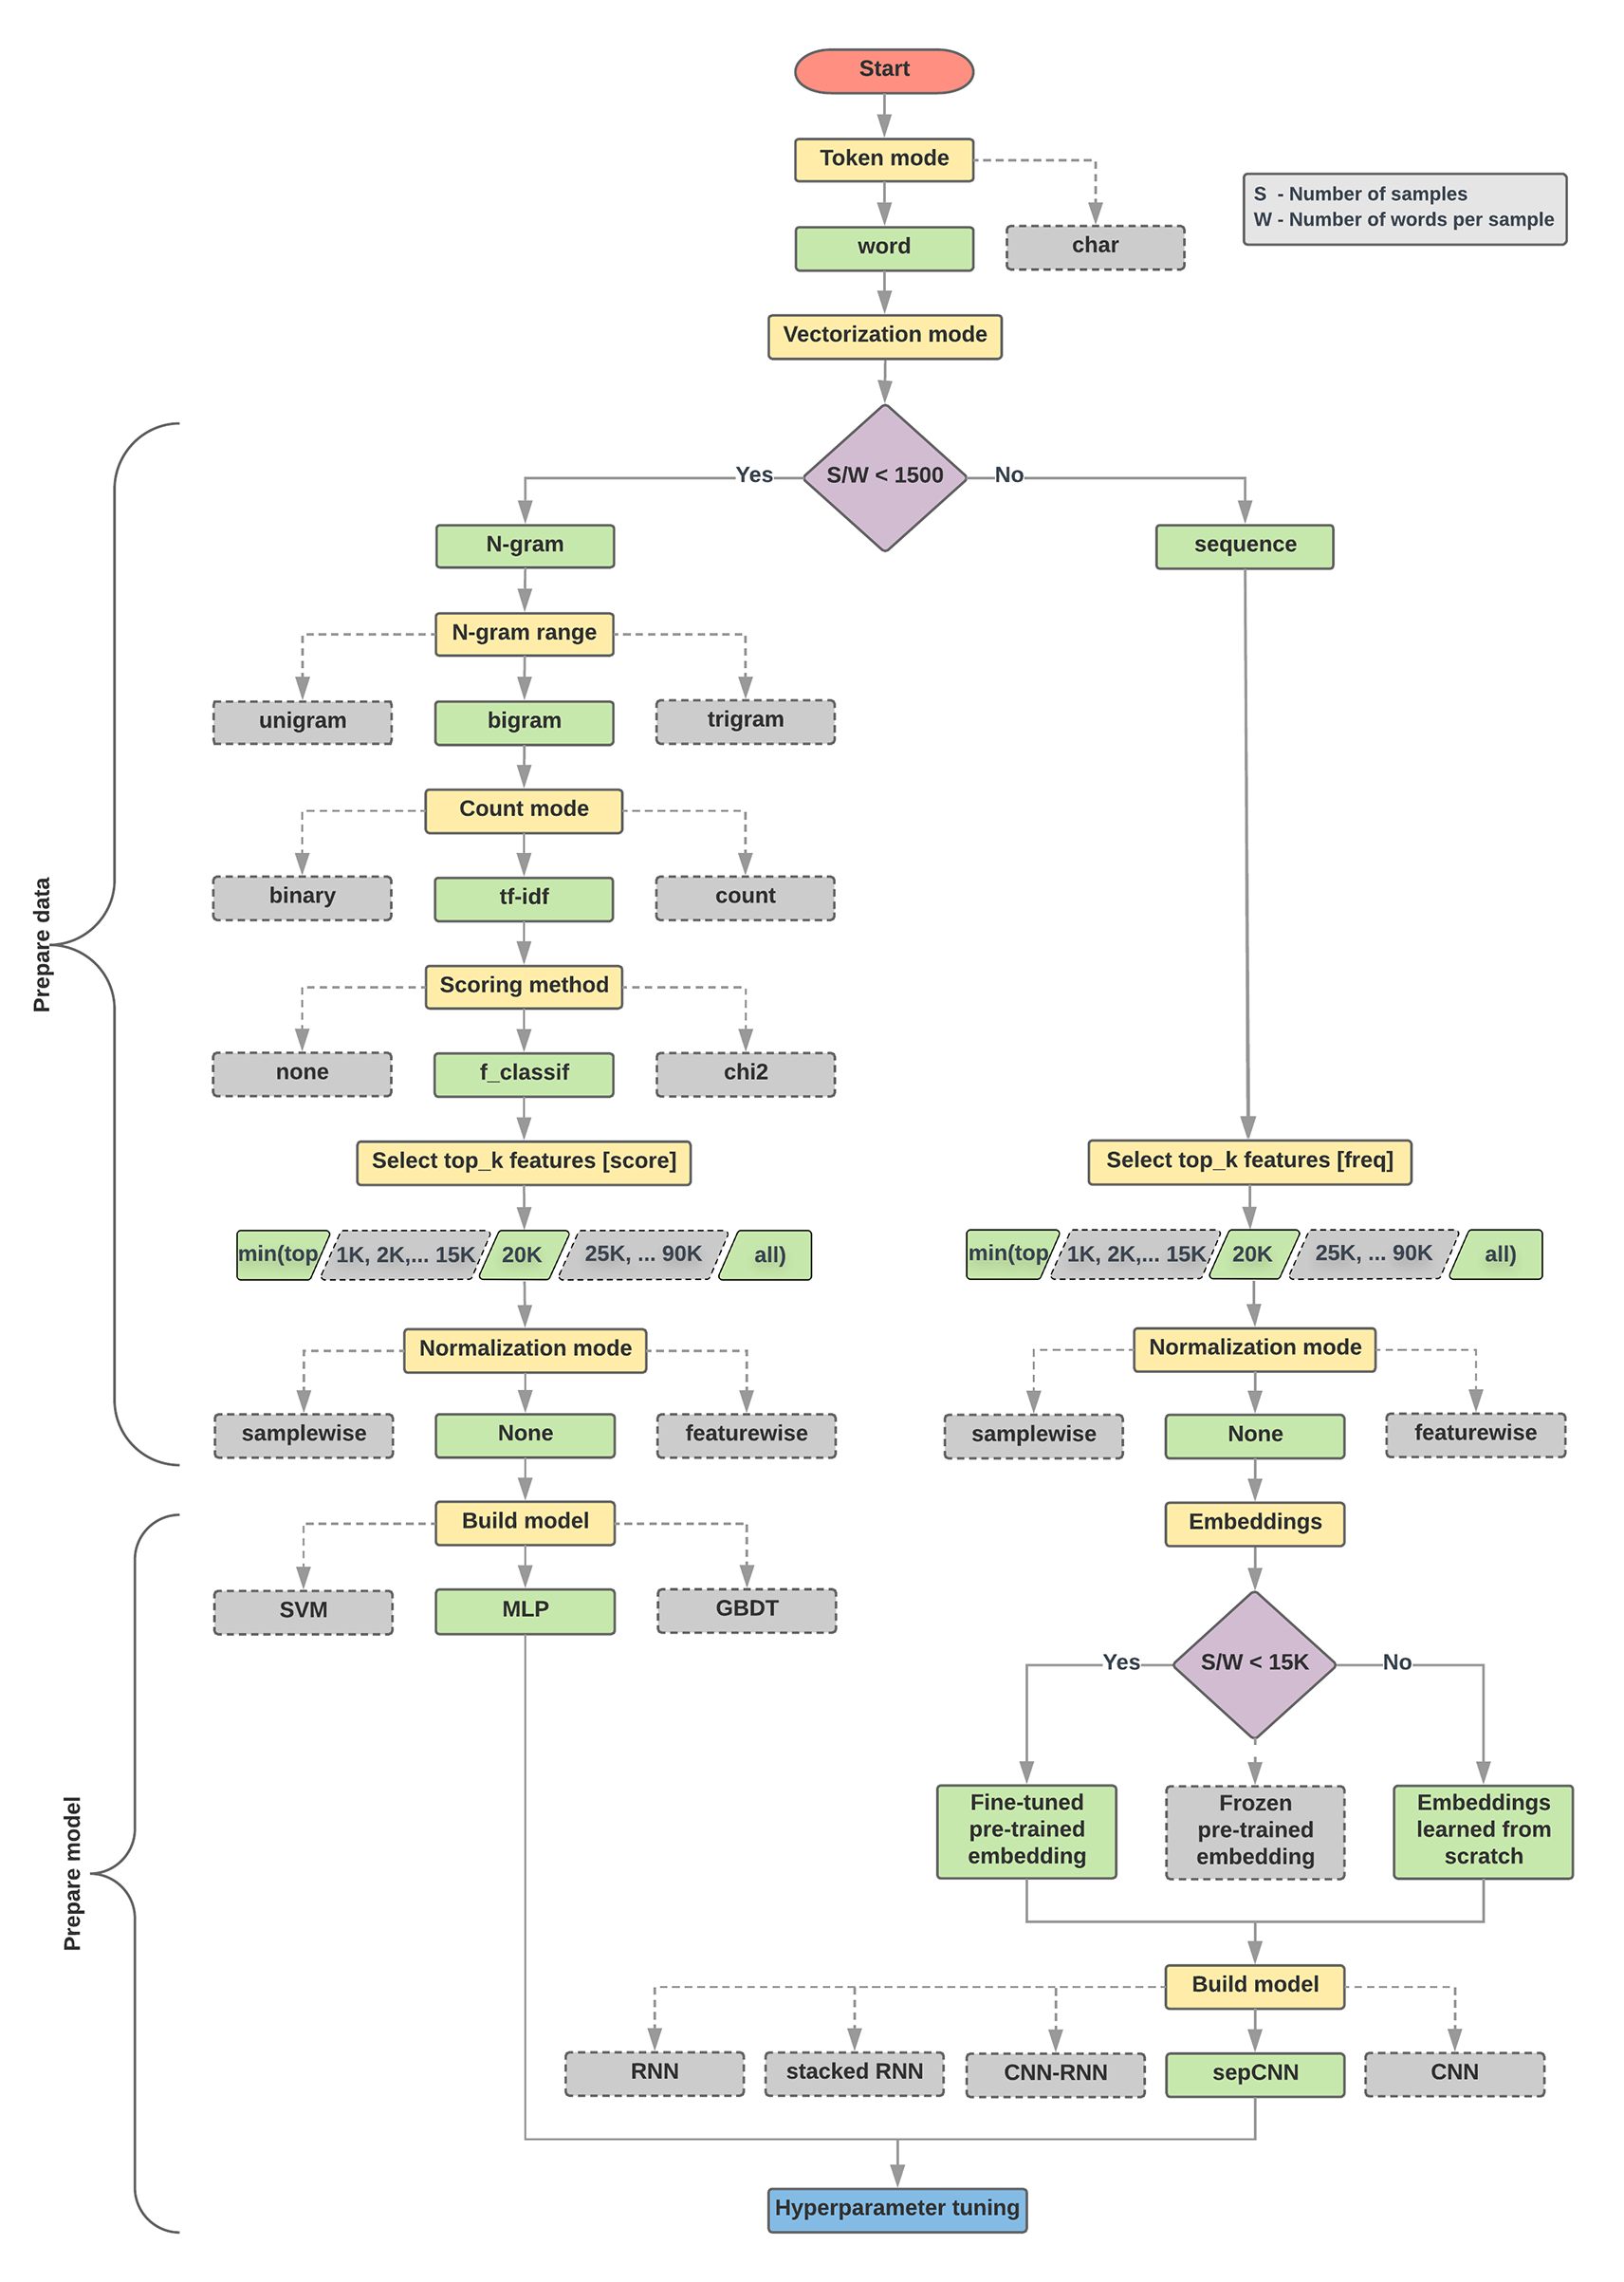
그림 5: 텍스트 분류 플로우 차트
이 플로 차트는 두 가지 주요 질문에 대한 답변을 제공합니다.
어떤 학습 알고리즘 또는 모델을 사용해야 할까요?
텍스트와 라벨의 관계를 효율적으로 학습하려면 데이터를 어떻게 준비해야 할까요?
두 번째 질문에 대한 답변은 첫 번째 질문에 대한 답에 달려 있습니다. 즉, 모델에 입력될 데이터를 전처리하는 방법은 선택하는 모델에 따라 달라집니다. 모델은 크게 두 가지 카테고리로 분류할 수 있습니다. 단어 순서 정보를 사용하는 모델 (시퀀스 모델)과 텍스트를 '가방'(집합)으로만 인식하는 모델 (N-그램 모델)이 있습니다. 시퀀스 모델의 유형에는 컨볼루셔널 신경망 (CNN), 순환 신경망 (RNN), 변형이 있습니다. N-그램 모델 유형은 다음과 같습니다.
실험 결과 '샘플 수'(S) 대 '샘플당 단어 수'(W)의 비율이 어떤 모델의 성능이 우수한지와 상관관계가 있음을 발견했습니다.
이 비율의 값이 작으면 (<1500) N-그램을 입력으로 사용하는 작은 다중 레이어 퍼셉트론 (옵션 A라고 함)이 시퀀스 모델만큼 더 잘 또는 적어도 성능을 발휘합니다. MLP는 정의와 이해가 간단하며 시퀀스 모델보다 컴퓨팅 시간이 훨씬 짧습니다. 이 비율의 값이 크면(1,500 이상) 시퀀스 모델을 사용합니다 (옵션 B). 다음 단계에서는 샘플/샘플당 단어 수 비율을 기반으로 선택한 모델 유형의 관련 하위 섹션 (A 또는 B로 표시)으로 건너뛸 수 있습니다.
IMDb 리뷰 데이터 세트의 경우 샘플/샘플당 단어 수 비율은 최대 144입니다. 이는 MLP 모델을 만든다는 의미입니다.
[null,null,["최종 업데이트: 2025-07-27(UTC)"],[[["\u003cp\u003eThis guide simplifies selecting a text classification model by identifying the best-performing algorithm for a given dataset based on accuracy and training time.\u003c/p\u003e\n"],["\u003cp\u003eA flowchart and algorithm are provided to guide model selection, primarily focusing on two options: using a multi-layer perceptron (MLP) with n-grams for datasets with a low sample-to-words-per-sample ratio or a sequence model (sepCNN) for datasets with a high ratio.\u003c/p\u003e\n"],["\u003cp\u003eExtensive experimentation across various text classification problems and datasets informed the recommendations, emphasizing the sample-to-words-per-sample ratio as a key factor in model selection.\u003c/p\u003e\n"],["\u003cp\u003eWhile the guide aims for optimal accuracy with minimal computation, it may not always yield the absolute best results due to potential variations in dataset characteristics, goals, or the emergence of newer algorithms.\u003c/p\u003e\n"],["\u003cp\u003eUsers can utilize the flowchart as a starting point for model construction, iteratively refining the model based on their specific needs and dataset properties.\u003c/p\u003e\n"]]],[],null,["# Step 2.5: Choose a Model\n\nAt this point, we have assembled our dataset and gained insights into the key\ncharacteristics of our data. Next, based on the metrics we gathered in\n[Step 2](/machine-learning/guides/text-classification/step-2), we should think\nabout which classification model we should use. This means asking questions\nsuch as:\n\n- How do you present the text data to an algorithm that expects numeric input? (This is called data preprocessing and vectorization.)\n- What type of model should you use?\n- What configuration parameters should you use for your model?\n\nThanks to decades of research, we have access to a large array of data\npreprocessing and model configuration options. However, the availability of a\nvery large array of viable options to choose from can greatly increase the\ncomplexity and scope of a particular problem. Given that the best\noptions might not be obvious, a naive solution would be to try every possible\noption exhaustively, pruning some choices through intuition. However, that would\nbe tremendously expensive.\n\nIn this guide, we attempt to significantly simplify the process of selecting a\ntext classification model. For a given dataset, our goal is to find the\nalgorithm that achieves close to maximum accuracy while minimizing computation\ntime required for training. We ran a large number (\\~450K) of experiments across\nproblems of different types (especially sentiment analysis and topic\nclassification problems), using 12 datasets, alternating for each dataset\nbetween different data preprocessing techniques and different model\narchitectures. This helped us identify dataset parameters that influence optimal\nchoices.\n\nThe model selection algorithm and flowchart below are a summary of our\nexperimentation. Don't worry if you don't understand all the terms used in them\nyet; the following sections of this guide will explain them in depth.\n\nAlgorithm for Data Preparation and Model Building\n-------------------------------------------------\n\n1. Calculate the number of samples/number of words per sample ratio.\n2. If this ratio is less than 1500, tokenize the text as [n-grams](/machine-learning/glossary#n-gram) and use a simple multi-layer perceptron (MLP) model to classify them (left branch in the flowchart below):\n 1. Split the samples into word n-grams; convert the n-grams into vectors.\n 2. Score the importance of the vectors and then select the top 20K using the scores.\n 3. Build an MLP model.\n3. If the ratio is greater than 1500, tokenize the text as sequences and use a [sepCNN](/machine-learning/glossary?utm_source=DevSite&utm_campaign=Text-Class-Guide&utm_medium=referral&utm_content=glossary&utm_term=sepCNN#depthwise-separable-convolutional-neural-network-sepcnn) model to classify them (right branch in the flowchart below):\n 1. Split the samples into words; select the top 20K words based on their frequency.\n 2. Convert the samples into word sequence vectors.\n 3. If the original number of samples/number of words per sample ratio is less than 15K, using a fine-tuned pre-trained embedding with the sepCNN model will likely provide the best results.\n4. Measure the model performance with different hyperparameter values to find the best model configuration for the dataset.\n\nIn the flowchart below, the yellow boxes indicate data and model preparation\nprocesses. Grey boxes and green boxes indicate choices we considered for each\nprocess. Green boxes indicate our recommended choice for each process.\n\nYou can use this flowchart as a starting point to construct your first\nexperiment, as it will give you good accuracy at low computation costs. You can\nthen continue to improve on your initial model over the subsequent iterations.\n\n\n**Figure 5: Text classification flowchart**\n\nThis flowchart answers two key questions:\n\n1. Which learning algorithm or model should you use?\n2. How should you prepare the data to efficiently learn the relationship between text and label?\n\nThe answer to the second question depends on the answer to the first question;\nthe way we preprocess data to be fed into a model will depend on what model we\nchoose. Models can be broadly classified into two categories: those that use\nword ordering information (sequence models), and ones that just see text as\n\"bags\" (sets) of words (n-gram models). Types of sequence models include\nconvolutional neural networks (CNNs), recurrent neural networks (RNNs), and\ntheir variations. Types of n-gram models include:\n\n- [logistic regression](/machine-learning/glossary#logistic-regression)\n- [simple multi-layer perceptrons](https://wikipedia.org/wiki/Multilayer_perceptron) (MLPs, or fully-connected neural networks)\n- [gradient boosted trees](/machine-learning/glossary#gradient-boosted-decision-trees-gbt)\n- [support vector machines](/machine-learning/glossary#kernel-support-vector-machines-ksvms)\n\n**From our experiments, we have observed that the ratio of \"number of samples\"\n(S) to \"number of words per sample\" (W) correlates with which model performs\nwell.**\n\nWhen the value for this ratio is small (\\\u003c1500), small multi-layer perceptrons\nthat take n-grams as input (which we'll call **Option A** ) perform better or at\nleast as well as sequence models. MLPs are simple to define and understand, and\nthey take much less compute time than sequence models. When the value for this\nratio is large (\\\u003e= 1500), use a sequence model (**Option B** ). In the steps\nthat follow, you can skip to the relevant subsections (labeled **A** or **B**)\nfor the model type you chose based on the samples/words-per-sample ratio.\n\nIn the case of our IMDb review dataset, the samples/words-per-sample ratio is\n\\~144. This means that we will create a MLP model.\n| **Note** : When using the above flowchart, keep in mind that it may not necessarily lead you to the most optimal results for your problem, for several reasons: \n| - Your goal may be different. We optimized for the best accuracy that could be achieved in the shortest possible compute time. An alternate flow may produce a better result, say, when optimizing for [area under the curve (AUC)](https://developers.google.com/machine-learning/glossary#AUC). \n| - We picked typical and common algorithm choices. As the field continues to evolve, new cutting-edge algorithms and enhancements may be relevant to your data and may perform better. \n| - While we used several datasets to derive and validate the flowchart, there may be specific characteristics to your dataset that favor using an alternate flow."]]