PLACES_COUNT_PER_GEO 函数接受要搜索的地理区域数组,并返回每个区域的地点数量表。例如,如果您指定邮政编码数组作为搜索区域,则响应会包含一个表格,其中每个邮政编码都对应一行。
由于 PLACES_COUNT_PER_GEO 函数会返回一个表,因此请使用 FROM 子句调用该函数。
输入参数:
返回:
- 一个表格,其中每个地理区域对应一行。该表包含以下列:
geography(GEOGRAPHY)、count(INT64) 和place_ids(ARRAY<STRING>),其中place_ids包含每个地理区域最多 250 个地点 ID。
- 一个表格,其中每个地理区域对应一行。该表包含以下列:
示例:计算纽约市每个县的餐厅数量
此示例生成一个表格,其中包含纽约市各县营业餐厅的数量。
此示例使用 United States Census Bureau Data BigQuery 公开数据集来获取纽约市三个县(皇后区、金斯县、纽约县)的边界。每个县的边界都包含在 county_geom 列中。
然后,此示例使用 BigQuery ST_SIMPLIFY 函数返回 county_geom 的简化版本。ST_SIMPLIFY 函数用于将一连串近乎直线的边替换为一条长边。
DECLARE geos ARRAY<GEOGRAPHY>;

SET geos = (SELECT ARRAY_AGG(ST_SIMPLIFY(county_geom, 100))
            FROM `bigquery-public-data.geo_us_boundaries.counties`
            WHERE county_name IN ("Queens","Kings", "New York") AND state_fips_code = "36");

SELECT * FROM `PROJECT_NAME.places_insights___us.PLACES_COUNT_PER_GEO`(
  JSON_OBJECT(
      'geographies', geos,
      'types', ["restaurant"],
      'business_status', ["OPERATIONAL"]
      )
);
函数的响应:
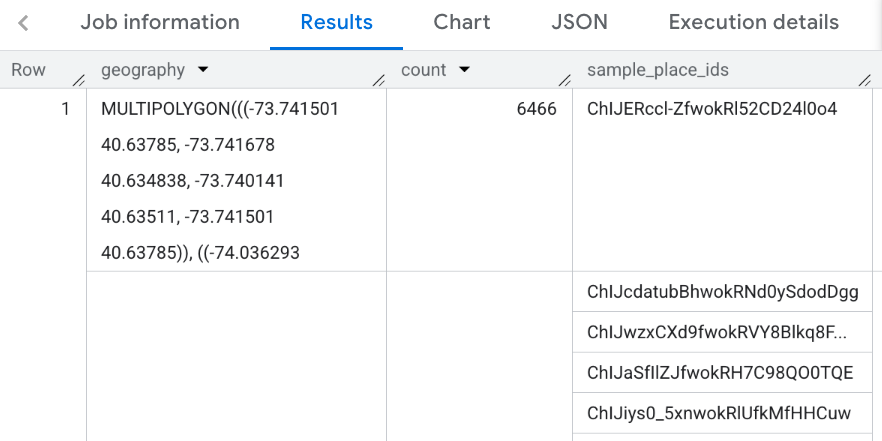
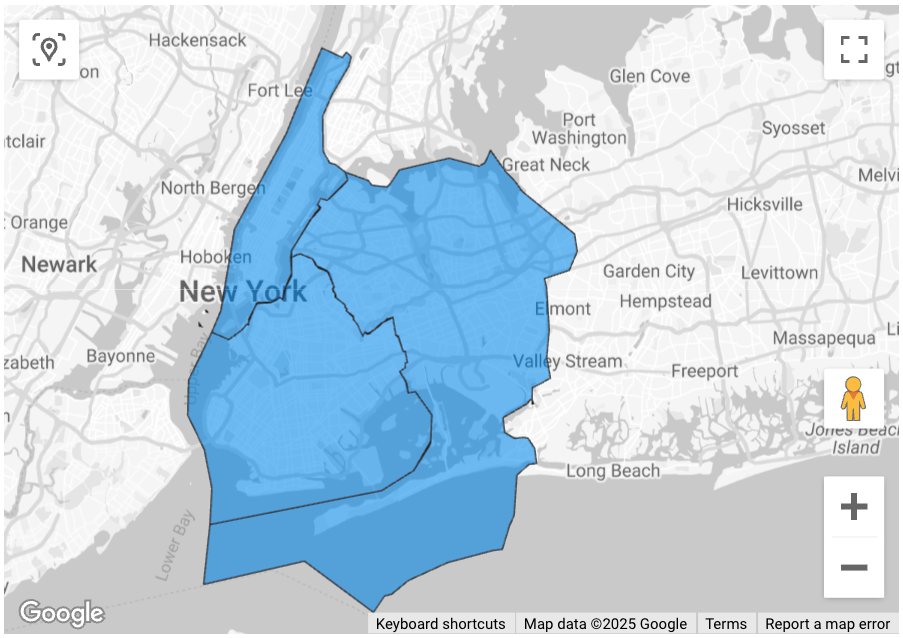
直观呈现结果
下图显示了 Looker Studio 中以填充地图形式呈现的这些数据,包括每个县的轮廓:
如需将数据导入 Looker Studio,请执行以下操作:
运行上述函数以生成结果。
在 BigQuery 结果中,依次点击打开方式 -> Looker Studio。您的结果会自动导入 Looker Studio。
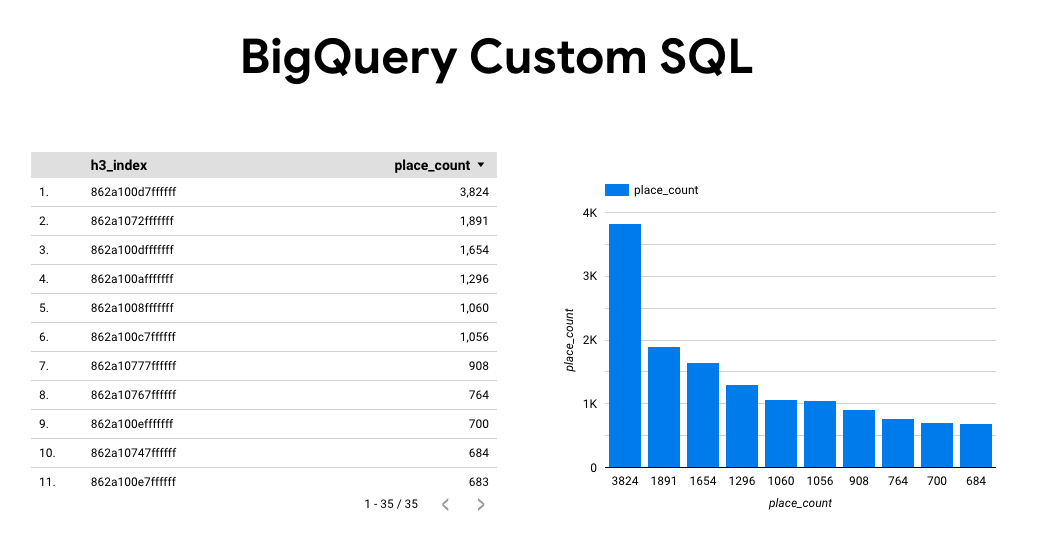
Looker Studio 会创建一个默认报告页面,并使用结果的标题、表格和条形图对其进行初始化。
选择网页上的全部内容,然后将其删除。
点击插入 -> 填充地图,将填充地图添加到报告中。
在图表类型 -> 设置下,按如下所示配置字段:
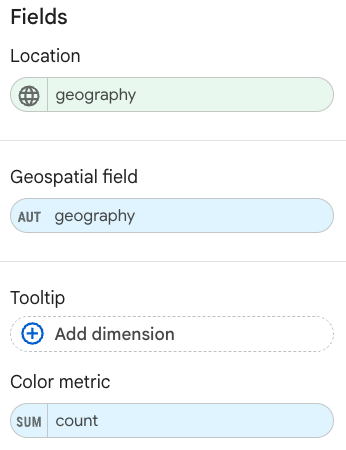
填充地图会显示如上所示。您可以选择图表类型 -> 样式,进一步配置地图的外观。
如需详细了解如何直观呈现 Places Insights 结果并查看相关示例,请参阅直观呈现查询结果。