PLACES_COUNT_PER_H3 函数会获取要搜索的地理区域,并返回一个表格,其中包含搜索区域内每个 H3 单元格的地点数量。
由于 PLACES_COUNT_PER_GEO 函数会返回一个表,因此请使用 FROM 子句调用该函数。
输入参数:
返回:
- 一个表格,每行对应一个 H3 单元格。该表包含以下列:
h3_cell_index(STRING)、geography(GEOGRAPHY)(用于定义表示 H3 单元格的多边形)、count(INT64) 和place_ids(ARRAY<STRING>),其中place_ids包含每个 H3 单元格最多 250 个地点 ID。
- 一个表格,每行对应一个 H3 单元格。该表包含以下列:
示例:统计每个 H3 单元格中可供轮椅通行的便利店和杂货店的数量
以下示例计算了纽约市每个 H3 单元格中可正常运营且可供轮椅使用者使用的便利店和杂货店的数量。H3 单元格使用 8 的分辨率级别。
此示例使用 Overture Maps Data BigQuery 公开数据集来获取纽约市的地理位置。
DECLARE geo GEOGRAPHY;

-- Get the geography for New York City.
SET geo = (SELECT geometry FROM `bigquery-public-data.overture_maps.division_area`
  WHERE country = 'US' AND names.primary = 'City of New York'  LIMIT 1);

SELECT * FROM `PROJECT_NAME.places_insights___us.PLACES_COUNT_PER_H3`(
  JSON_OBJECT(
      'geography', geo,
      'types', ["convenience_store","grocery_store"],
      'wheelchair_accessible_entrance', true,
      'business_status', ['OPERATIONAL'],
      'h3_resolution', 8
    )
);
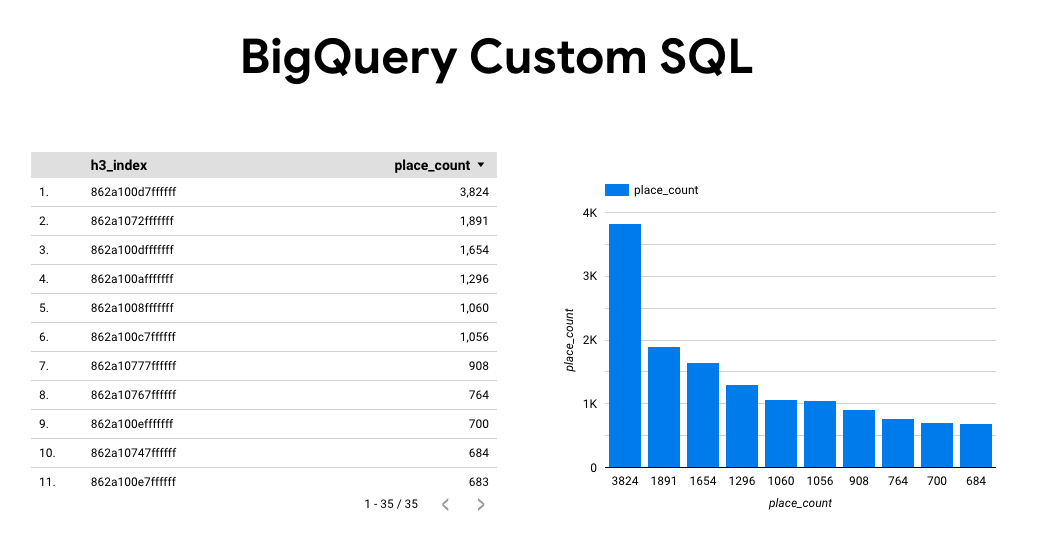
函数的响应:

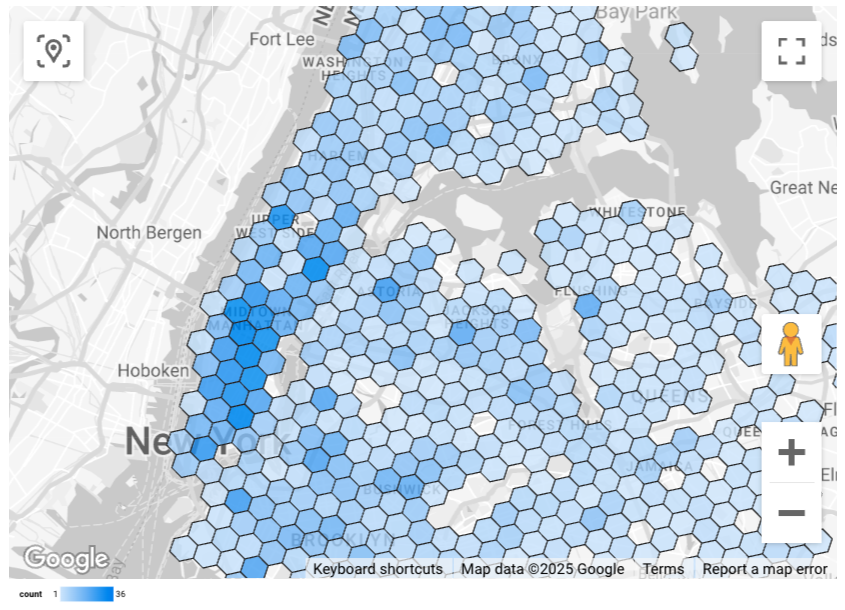
直观呈现结果
下图显示了在 Looker 数据洞察中以填充地图形式呈现的这些数据。 H3 单元格的颜色越深,结果的集中度越高:
如需将数据导入 Looker Studio,请执行以下操作:
运行上述函数以生成结果。
在 BigQuery 结果中,依次点击打开方式 -> Looker Studio。您的结果会自动导入 Looker Studio。
Looker Studio 会创建一个默认报告页面,并使用结果的标题、表格和条形图对其进行初始化。
选择网页上的全部内容,然后将其删除。
点击插入 -> 填充地图,将填充地图添加到报告中。
在图表类型 -> 设置下,按如下所示配置字段:
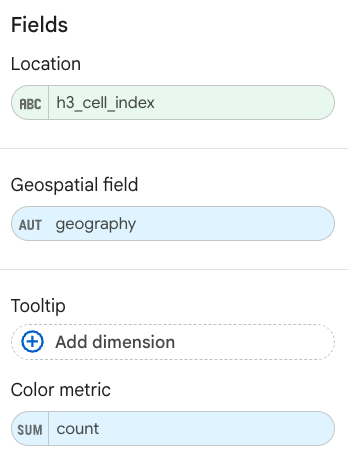
填充地图会显示如上所示。您可以选择图表类型 -> 样式,进一步配置地图的外观。
如需详细了解如何直观呈现 Places Insights 结果并查看相关示例,请参阅直观呈现查询结果。