- 数据集可用时间
- 2000-01-01T00:00:00Z–2020-01-01T00:00:00Z
- 数据集生产者
- 国际地球科学信息网络中心下属的 NASA SEDAC
- 频率
- 5 年
- 标签
说明
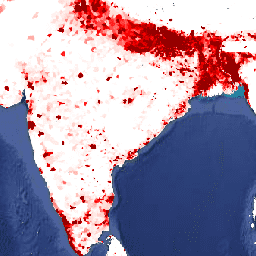
此数据集包含与国家人口普查和人口登记数据一致的每平方公里人口数估计值。每个建模年份都有一张图片。
世界网格化人口第 4 版 (GPWv4) 修订版本 11 模拟了 2000 年、2005 年、2010 年、2015 年和 2020 年全球人口在 30 角秒(约 1 公里)网格单元中的分布情况。人口会根据普查和行政单位的人口比例分配到各个单元格。人口输入数据是根据 2005 年至 2014 年间进行的 2010 年人口普查结果,以最详细的空间分辨率收集的。对输入数据进行外推,以生成每个建模年份的人口估计值。
频段
波段
像素大小:927.67 米(所有波段)
| 名称 | 最小值 | 最大值 | 像素大小 | 说明 |
|---|---|---|---|---|
population_density |
0* | 810694* | 927.67 米 | 每平方公里的估计人数。 |
使用条款
使用条款
引用
引用:
Center for International Earth Science Information Network - CIESIN - Columbia University. 2018 年。世界网格化人口,第 4 版 (GPWv4):人口密度,修订版 11。Palisades, NY: NASA Socioeconomic Data and Applications Center (SEDAC). https://doi.org/10.7927/H49C6VHW. 访问日期:DAY MONTH YEAR。
DOI
通过 Earth Engine 探索
代码编辑器 (JavaScript)
var dataset = ee.ImageCollection('CIESIN/GPWv411/GPW_Population_Density').first();
var raster = dataset.select('population_density');
var raster_vis = {
  'max': 1000.0,
  'palette': [
    'ffffe7',
    'FFc869',
    'ffac1d',
    'e17735',
    'f2552c',
    '9f0c21'
  ],
  'min': 200.0
};
Map.setCenter(79.1, 19.81, 3);
Map.addLayer(raster, raster_vis, 'population_density');