-
2000 年格陵兰镶嵌图 - 格陵兰冰层测绘项目 (GIMP)
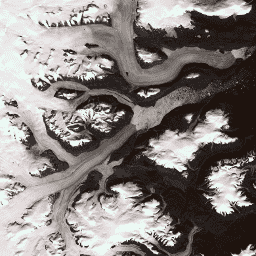
此数据集提供格陵兰冰盖的完整 15 米分辨率图像镶嵌,该镶嵌图源自 1999 年至 2002 年的 Landsat 7 ETM+ 和 RADARSAT-1 SAR 图像。这些方法包括图像云遮罩、全色锐化、图像采样和调整大小等技术的组合,… arctic gimp greenland imagery nasa polar -
AG100:ASTER 全球发射率数据集 100 米 V003

高级星载热发射和反射辐射计全球发射率数据库 (ASTER-GED) 由美国国家航空航天局 (NASA) 加州理工学院喷气推进实验室 (JPL) 开发。此产品包括所有 5 个 ASTER 热红外波段的平均发射率和标准差… aster 高程 发射率 地球物理 红外 jpl -
AHN 荷兰 0.5 米 DEM,插值

AHN DEM 是覆盖荷兰的 0.5 米 DEM。该数据是根据 2007 年至 2012 年春季采集的激光雷达数据生成的。它包含地面级样本,并移除了地面以上的所有其他物体(例如建筑物、桥梁、树木等)。此版本是… AHN DEM 海拔 海拔-地形 地球物理 激光雷达 -
荷兰 AHN 0.5 米 DEM,非插值

AHN DEM 是覆盖荷兰的 0.5 米 DEM。该数据是根据 2007 年至 2012 年春季采集的激光雷达数据生成的。它包含地面级样本,并移除了地面以上的所有其他物体(例如建筑物、桥梁、树木等)。此版本是… AHN DEM 海拔 海拔-地形 地球物理 激光雷达 -
荷兰 AHN 0.5 米 DEM,原始样本

AHN DEM 是覆盖荷兰的 0.5 米 DEM。该数据是根据 2007 年至 2012 年春季采集的激光雷达数据生成的。此版本包含地面级样本和地面以上物体(例如建筑物、桥梁、树木等)。点云… AHN DEM 海拔 海拔-地形 地球物理 激光雷达 -
AHN3:荷兰 AHN 0.5 米

Actueel Hoogtebestand Nederland (AHN) 是一个数据集,其中包含荷兰全国各地详细而精确的海拔数据。海拔信息是通过直升机和飞机使用激光技术收集的,垂直精度为 5 厘米。AHN3 数据集包含荷兰 AHN 0.5 米 DSM … AHN DEM 海拔 海拔-地形 地球物理 激光雷达 -
AHN4:荷兰 AHN 0.5 米

Actueel Hoogtebestand Nederland (AHN) 是一个数据集,其中包含荷兰全国各地详细而精确的海拔数据。海拔信息是通过直升机和飞机使用激光技术收集的,垂直精度为 5 厘米。AHN4 数据集包含荷兰 AHN 0.5 米 DSM … AHN DEM 海拔 海拔-地形 地球物理 激光雷达 -
ALOS DSM:全球 30 米 v4.1
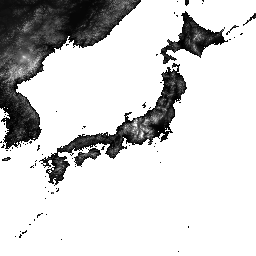
ALOS World 3D - 30m (AW3D30) 是一项全球数字地表模型 (DSM) 数据集,水平分辨率约为 30 米(1 角秒网格)。该数据集基于世界 3D 地形数据的 DSM 数据集(5 米网格版本)。更多详情… alos dem 海拔 海拔-地形 地球物理 jaxa -
ALOS-2 PALSAR-2 StripMap Level 2.1

自 2024 年 1 月 1 日晚间起,根据日本各省厅和相关组织的请求,JAXA 实施了 ALOS-2 PALSAR-2 紧急观测。由于 JAXA 预计这些紧急观测数据对于灾害管理非常有用,因此 JAXA 决定在 … alos2 eroc jaxa palsar2 radar sar -
ALOS/AVNIR-2 ORI

此数据集包含来自“大地”号先进陆地观测卫星 (ALOS) 上搭载的第二代先进可见光近红外辐射计 (AVNIR-2) 传感器的正射校正影像。AVNIR-2 ORI 产品是根据 AVNIR-2 1B1 数据在与 ALOS 的全色遥感 … alos jaxa orthophoto satellite-imagery visible -
ASTER L1T 辐射率

注意:由于 ASTER 仪器存在技术问题,2024 年 11 月 28 日至 2025 年 1 月 16 日期间的数据收集存在缺口。如需了解详情,请参阅美国地质调查局的公告。高级星载热发射和反射辐射计 (ASTER) 是一种多光谱成像仪,可… aster imagery nasa nir radiance satellite-imagery -
澳大利亚的实际蒸散量(CMRSET Landsat V2.2)

此数据集使用 CMRSET 算法提供澳大利亚的准确实际蒸散量(AET 或 ETa)。AET 波段(命名为“ETa”)包含 CMRSET 模型在该月所有无云 Landsat 观测中的平均每日值(在 AET 数据中以值 3 表示)。 农业 澳大利亚 csiro 蒸发 蒸发蒸腾 Landsat 衍生 -
艾伦珊瑚礁地图集 (ACA) - 地貌分区和底栖生境 - v2.0
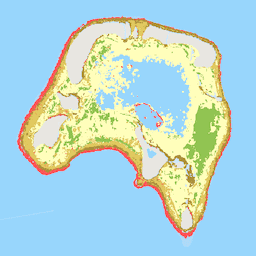
Allen Coral Atlas 数据集以 5 米的像素分辨率绘制了全球浅水珊瑚礁的地貌带状分布和底栖生境。此外,该产品还包含一个全球珊瑚礁范围产品,其中绘制了无法明确纳入地貌和… ocean oceans sentinel2-derived -
ArcticDEM Mosaic V4.1
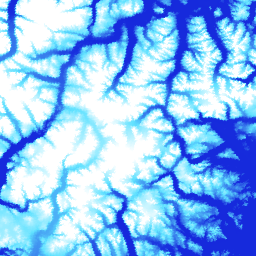
ArcticDEM 是美国国家地理空间情报局 (NGA) 和美国国家科学基金会 (NSF) 联合发起的公私合作计划,旨在利用光学立体影像、高性能计算和开源摄影测量软件,自动生成北极的高分辨率、高质量数字表面模型 (DSM)。它包括植被、树冠、建筑物和… arctic dem elevation-topography geophysical pgc umn -
ArcticDEM 条带
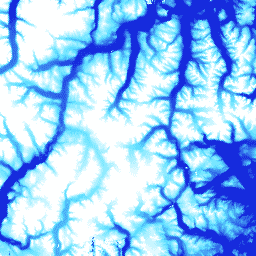
ArcticDEM 是美国国家地理空间情报局 (NGA) 和美国国家科学基金会 (NSF) 联合发起的公私合作计划,旨在利用光学立体影像、高性能计算和开源摄影测量软件,自动生成北极的高分辨率、高质量数字表面模型 (DSM)。它包括植被、树冠、建筑物和… arctic dem elevation-topography geophysical pgc umn -
澳大利亚 5 米 DEM

澳大利亚的数字高程模型 (DEM) 5 米网格源自 LiDAR 模型,表示一个国家级 5 米(裸地)DEM,该模型源自 2001 年至 2015 年间进行的约 236 次单独的 LiDAR 测量,覆盖面积超过 245,000 平方公里。… 澳大利亚 dem elevation elevation-topography ga geophysical -
BLM AIM TerrADat TerrestrialAIM Point v1
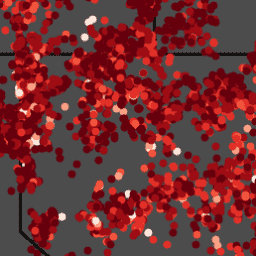
自 2011 年以来,土地管理局 (BLM) 一直通过其评估、清查和监测 (AIM) 策略收集实地信息,以了解土地健康状况。迄今为止,已在 BLM 土地上收集了 6,000 多个地面 AIM 实地样区。BLM AIM 数据归档是… blm 生态系统 水文 土壤 表格 植被 -
勃兰登堡(德国)RGBN 正射影像 20 厘米
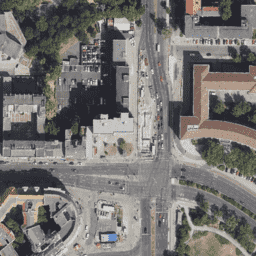
正射影像是覆盖德国勃兰登堡州的一组航空照片。这些数据由勃兰登堡州政府 (LGB) 提供。数字正射影像是经过数字校正的航空照片,可显示拍摄时从空中看到的所有物体,… 正射影像 -
呼吸地球系统模拟器 (BESS) 辐射 v1

呼吸地球系统模拟器 (BESS) 是一种简化的基于过程的模型,可耦合大气和冠层辐射传输、冠层光合作用、蒸腾作用和能量平衡。该模型将大气辐射传输模型和人工神经网络与 MODIS 大气产品的强迫相结合,以生成 5 公里的每日产品。… climate 蒸发蒸腾 gpp modis-derived par radiation -
CCNL:DMSP-OLS(1992-2013 年)v1 版的一致且校正后的夜间灯光数据集

“一致且校正后的夜间灯光”(CCNL) 数据集是国防气象计划 (DMSP) 业务线扫描系统 (OLS) 第 4 版的重新处理版本。我们采用了一系列方法来减轻年际不一致性、饱和度和光晕效应的影响,并提高数据… dmsp eog imagery lights nighttime ols -
CFSR:气候预报系统再分析

美国国家环境预测中心 (NCEP) 气候预测系统再分析 (CFSR) 旨在提供 32 年记录期(从 1979 年 1 月到 2010 年 12 月)内这些耦合域状态的最佳估计值,并以全球高分辨率耦合大气-海洋-陆地表面-海冰系统执行。 climate daylight flux forecast geophysical ncep -
CFSV2:NCEP 气候预测系统第 2 版,每 6 小时协调一次产品

美国国家环境预测中心 (NCEP) 气候预测系统 (CFS) 是一种完全耦合的模型,可表示地球大气、海洋、陆地和海冰之间的相互作用。CFS 是在 NCEP 的环境模型中心 (EMC) 开发的。将运行中的 CFS 升级到了 … climate daylight flux forecast geophysical ncep -
CHIRPS 降水每日近实时数据:气候危害中心红外降水数据(基于地面站数据,版本 3.0,基于 IMERG)

气候危害中心红外降水数据(CHIRPS v3)是一个 40 多年的高分辨率准全球降雨数据集。该数据集涵盖了从 60°N 到 60°S 的纬度范围,以及所有经度,并提供从 1981 年至今的数据。CHIRPS v3 将基于卫星的热红外降雨量估计值与实地观测站的观测数据相结合… chc climate geophysical precipitation ucsb weather -
CHIRPS 降水每日再分析:Climate Hazards Center InfraRed Precipitation With Station Data(版本 3.0,基于 ERA5)

气候危害中心红外降水数据(CHIRPS v3)是一个 40 多年的高分辨率准全球降雨数据集。该数据集涵盖了从 60°N 到 60°S 的纬度范围,以及所有经度,并提供从 1981 年至今的数据。CHIRPS v3 将基于卫星的热红外降雨量估计值与实地观测站的观测数据相结合… chc climate geophysical precipitation ucsb weather -
CHIRPS 每日降水:气候危害中心红外降水与地面站数据(版本 2.0 最终版)

Climate Hazards Center InfraRed Precipitation with Station data (CHIRPS) 是一项准全球性降雨数据集,包含 30 多年的数据。CHIRPS 将分辨率为 0.05° 的卫星图像与实地站数据相结合,创建网格化降雨时序数据,用于趋势分析和季节性干旱监测。 chg climate geophysical precipitation ucsb weather -
CHIRPS 五日降水:Climate Hazards Center InfraRed Precipitation With Station Data(气候危害中心红外降水与地面站数据)(版本 2.0 最终版)

Climate Hazards Center InfraRed Precipitation with Station data (CHIRPS) 是一项准全球性降雨数据集,包含 30 多年的数据。CHIRPS 将分辨率为 0.05° 的卫星图像与实地站数据相结合,创建网格化降雨时序数据,用于趋势分析和季节性干旱监测。 chg climate geophysical precipitation ucsb weather -
CHIRPS 五日降水:气候危害中心红外降水与地面站数据(版本 3.0)

气候危害中心红外降水数据(CHIRPS v3)是一个 40 多年的高分辨率准全球降雨数据集。该数据集涵盖了从 60°N 到 60°S 的纬度范围,以及所有经度,并提供从 1981 年至今的数据。CHIRPS v3 将基于卫星的热红外降雨量估计值与实地观测站的观测数据相结合… chc chg climate geophysical precipitation ucsb -
CHIRTS Temperature Daily:Climate Hazards Center InfraRed Temperature with Stations daily data product

气候危害中心红外温度与站点每日温度数据产品 (CHIRTS-daily; Verdin et al. 2020) 是一种准全球高分辨率网格化数据集(分辨率为 0.05° × 0.05°,范围为 60°S - 70°N),可提供每日最低温度 (Tmin) 和最高 2 米温度 (Tmax),以及四个派生变量:饱和蒸汽… chg climate daily era5 geophysical reanalysis -
CPC 全球统一的基于地面观测站的每日降水分析

CPC 统一的全球每日降水地面观测分析数据集提供 1979 年至今的陆地每日降水估计值。该数据集由 NOAA 的气候预测中心 (CPC) 开发,利用最佳插值技术将全球雨量计网络的数据与…相结合 daily noaa precipitation weather -
CPC 全球统一温度

此数据集提供全球陆地表面每日气温的网格化分析,包括每日最高气温 (Tmax) 和最低气温 (Tmin)。涵盖 1979 年至今的数据,以 0.5 度经纬度网格呈现,与 CPC 基于地面观测的全球每日… climate daily noaa precipitation weather -
CSP gHM:Global Human Modification

全球人类改造数据集 (gHM) 以 1 平方公里的分辨率提供全球陆地人类改造的累积度量。gHM 值的范围为 0.0-1.0,通过估计指定位置(像素)的修改比例、估计的强度… csp fragmentation human-modification landcover landscape-gradient population -
加拿大 AAFC 年度作物库存

自 2009 年起,加拿大农业及农业食品部 (AAFC) 科学技术分部 (STB) 的地球观测团队开始生成年度作物类型数字地图。以 2009 年和 2010 年的草原省份为重点,一种基于决策树 (DT) 的方法… 农业 加拿大 农作物 地表覆盖 -
Canadian Digital Elevation Model

加拿大数字高程模型 (CDEM) 是加拿大自然资源部 (NRCan) 高程测量系统的一部分,源自现有的加拿大数字高程数据 (CDED)。在这些数据中,高程可以是地面高程,也可以是反射面高程。CDEM 由多个 DEM 组成,具有… 加拿大 DEM 海拔 海拔-地形 地球物理 地形 -
Cloud Score+ S2_HARMONIZED V1

Cloud Score+ 是一款质量评估 (QA) 处理器,适用于中高分辨率的光学卫星图像。Cloud Score+ S2_HARMONIZED 数据集正基于协调版 Sentinel-2 L1C 集合进行业务化生产,Cloud Score+ 输出可用于识别相对清晰的像素点,并有效去除云… cloud google satellite-imagery sentinel2-derived -
可可概率模型 2025a

注意:此数据集尚未经过同行评审。如需了解详情,请参阅此 GitHub README。此影像集提供估计的每像素概率,表示相应区域被相应商品占据的可能性。概率估计值以 10 米为单位提供,由…生成 农业 生物多样性 保护 作物 eudr forestdatapartnership -
咖啡概率模型 2025a

注意:此数据集尚未经过同行评审。如需了解详情,请参阅此 GitHub README。此影像集提供估计的每像素概率,表示相应区域被相应商品占据的可能性。概率估计值以 10 米为单位提供,由…生成 农业 生物多样性 保护 作物 eudr forestdatapartnership -
哥白尼大气监测服务 (CAMS) 全球近乎实时

哥白尼大气监测服务能够持续监测全球和区域范围内地球大气的组成。主要全球近实时生产系统是一套数据同化和预报系统,每天提供两次 5 天的预测,用于气溶胶和化学… 气溶胶 大气 气候 哥白尼 ecmwf 预报 -
哥白尼 CORINE 土地覆盖
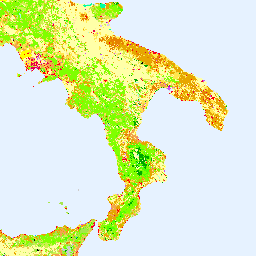
CORINE(环境信息协调)土地覆盖 (CLC) 清单于 1985 年启动,旨在标准化欧洲土地数据收集,以支持环境政策制定。该项目由欧洲环境署 (EEA) 在欧盟 … 哥白尼 欧洲环境署 欧洲航天局 欧盟 地表覆盖 土地利用和地表覆盖 -
Copernicus DEM GLO-30:全球 30 米数字高程模型
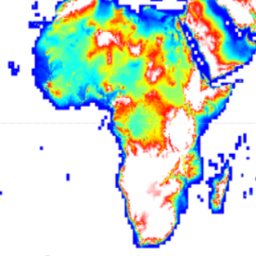
哥白尼 DEM 是一种数字表面模型 (DSM),用于表示地球表面的地形,包含建筑物、基础设施以及植被。此 DEM 派生自名为 WorldDEM&trade 的经过编辑的 DSM,即已纳入水体平坦化和河流一致流动。正在修改… 哥白尼 数字高程模型 海拔 海拔-地形 地球物理 -
哥白尼全球海洋海流原位观测数据 - Argo

In Situ TAC 是一个分布式中心,围绕 7 个海洋学区域(全球海洋和 6 个 EUROGOOS 区域联盟)组织而成。该项目涉及欧洲 11 个国家/地区的 14 个合作伙伴。它不部署任何观测系统,完全依赖于其他机构资助的数据… 哥白尼 海流 原位 海洋 大洋 大洋 -
Copernicus 全球海洋海流实况观测 - 漂流浮标

In Situ TAC 是一个分布式中心,围绕 7 个海洋学区域(全球海洋和 6 个 EUROGOOS 区域联盟)组织而成。该项目涉及欧洲 11 个国家/地区的 14 个合作伙伴。它不部署任何观测系统,完全依赖于其他机构资助的数据… 哥白尼 海流 原位 海洋 大洋 大洋 -
哥白尼全球海洋海流原位观测数据 - 雷达径向

In Situ TAC 是一个分布式中心,围绕 7 个海洋学区域(全球海洋和 6 个 EUROGOOS 区域联盟)组织而成。该项目涉及欧洲 11 个国家/地区的 14 个合作伙伴。它不部署任何观测系统,完全依赖于其他机构资助的数据… 哥白尼 海流 原位 海洋 大洋 大洋 -
哥白尼全球海洋海流原位观测 - 雷达总

In Situ TAC 是一个分布式中心,围绕 7 个海洋学区域(全球海洋和 6 个 EUROGOOS 区域联盟)组织而成。该项目涉及欧洲 11 个国家/地区的 14 个合作伙伴。它不部署任何观测系统,完全依赖于其他机构资助的数据… 哥白尼 海流 原位 海洋 大洋 大洋 -
哥白尼全球土地覆盖层:CGLS-LC100 Collection 3

哥白尼全球陆地服务 (CGLS) 被指定为陆地服务的一个组件,用于运行一个多用途服务组件,该组件可提供一系列关于全球陆地表面状况和演变的生物地球物理产品。… 的动态土地覆盖地图 哥白尼 欧洲环境署 欧洲航天局 欧盟 地表覆盖 土地利用和地表覆盖 -
哥白尼全球海洋生物地球化学预报 - BIO

1/4 度分辨率的 Operational Mercator Ocean 生物地球化学全球海洋分析和预报系统可提供每周更新的 10 天 3D 全球海洋预报。时间序列按时间进行聚合,以达到两整年的时间序列滑动窗口。这… 哥白尼 每日 预报 海洋 海洋 大洋 -
哥白尼全球海洋生物地球化学预测 - CAR

1/4 度分辨率的 Operational Mercator Ocean 生物地球化学全球海洋分析和预报系统可提供每周更新的 10 天 3D 全球海洋预报。时间序列按时间进行聚合,以达到两整年的时间序列滑动窗口。这… 哥白尼 每日 预报 海洋 海洋 大洋 -
哥白尼全球海洋生物地球化学预测 - 二氧化碳

1/4 度分辨率的 Operational Mercator Ocean 生物地球化学全球海洋分析和预报系统可提供每周更新的 10 天 3D 全球海洋预报。时间序列按时间进行聚合,以达到两整年的时间序列滑动窗口。这… 哥白尼 每日 预报 海洋 海洋 大洋 -
哥白尼全球海洋生物地球化学预报 - NUT

1/4 度分辨率的 Operational Mercator Ocean 生物地球化学全球海洋分析和预报系统可提供每周更新的 10 天 3D 全球海洋预报。时间序列按时间进行聚合,以达到两整年的时间序列滑动窗口。这… 哥白尼 每日 预报 海洋 海洋 大洋 -
哥白尼全球海洋生物地球化学预报 - 光学
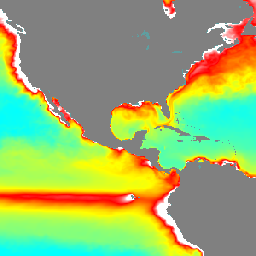
1/4 度分辨率的 Operational Mercator Ocean 生物地球化学全球海洋分析和预报系统可提供每周更新的 10 天 3D 全球海洋预报。时间序列按时间进行聚合,以达到两整年的时间序列滑动窗口。这… 哥白尼 每日 预报 海洋 海洋 大洋 -
哥白尼全球海洋生物地球化学预测 - PFT

1/4 度分辨率的 Operational Mercator Ocean 生物地球化学全球海洋分析和预报系统可提供每周更新的 10 天 3D 全球海洋预报。时间序列按时间进行聚合,以达到两整年的时间序列滑动窗口。这… 哥白尼 每日 预报 海洋 海洋 大洋 -
哥白尼全球海洋生物地球化学预报 - 浮游生物

1/4 度分辨率的 Operational Mercator Ocean 生物地球化学全球海洋分析和预报系统可提供每周更新的 10 天 3D 全球海洋预报。时间序列按时间进行聚合,以达到两整年的时间序列滑动窗口。这… 哥白尼 每日 预报 海洋 海洋 大洋 -
哥白尼卫星海洋颜色每日数据

此数据集提供全球每日海洋表层叶绿素-a 浓度和遥感反射率估计值,这些数据源自多个卫星传感器。遥感反射率(或 Rrs)定义为水面出射辐射与下行辐照度的比率,是用于…的算法的主要输入 叶绿素-a 哥白尼 每日 海洋 大洋 -
科特迪瓦 BNETD 2020 年土地覆盖地图

科特迪瓦 BNETD 2020 年土地覆盖地图由科特迪瓦政府通过国家机构国家研究办公室技术与发展中心 (BNETD-CIGN) 制作,并获得了欧盟的技术和资金支持。方法… 分类 森林砍伐 森林 土地覆盖 土地利用-土地覆盖 -
CryoSat-2 南极洲 1 公里 DEM
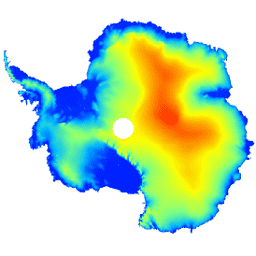
此数据集是南极冰盖和冰架的数字高程模型 (DEM),基于 CryoSat-2 卫星雷达高度计在 2010 年 7 月至 2016 年 7 月期间记录的观测数据。DEM 是根据在 1 天、2 天、… 南极洲 数字高程模型 高程 高程-地形 极地 -
DEM-H:澳大利亚 SRTM 水文强制数字高程模型
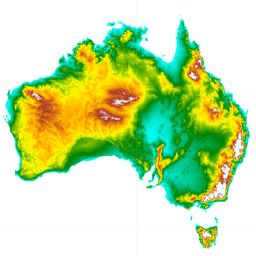
水文强制数字高程模型 (DEM-H) 源自 NASA 于 2000 年 2 月获取的 SRTM 数据。模型已进行水文条件调整和排水强制处理。DEM-H 基于 SRTM 高程和映射的河流线捕获流路径,并支持划定… 澳大利亚 dem elevation elevation-topography ga geophysical -
DEM-S:澳大利亚平滑数字高程模型
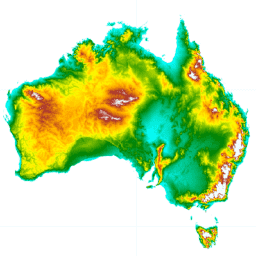
平滑数字高程模型 (DEM-S) 源自 NASA 于 2000 年 2 月获取的 SRTM 数据。DEM-S 表示地面地形(不包括植被特征),并且经过平滑处理,以减少噪声并改进地表形状的表示。应用了更具自适应性的流程… 澳大利亚 dem elevation elevation-topography ga geophysical -
DESS China Terrace Map v1

此数据集是 2018 年中国梯田地图,分辨率为 30 米。该模型基于 Google Earth Engine 平台,通过使用多源和多时相数据进行监督像素级分类来开发。总体准确率和 Kappa 系数分别达到 94% 和 0.72。这第一个… 农业 土地覆盖 土地利用 土地利用和土地覆盖 清华 -
DMSP OLS:全球辐射校准夜间灯光版本 4,国防气象计划业务线扫描系统

国防气象计划 (DMSP) 运行的线扫描系统 (OLS) 具有在夜间检测可见光和近红外 (VNIR) 发射源的独特能力。此集合包含未出现传感器饱和的全球夜间灯光图像。该传感器通常在高增益设置下运行,以实现… dmsp eog imagery lights nighttime ols -
DMSP OLS:夜间灯光时间序列版本 4,国防气象计划业务线扫描系统

国防气象计划 (DMSP) 运行的线扫描系统 (OLS) 具有在夜间检测可见光和近红外 (VNIR) 发射源的独特能力。DMSP-OLS 夜间灯光时间序列第 4 版包含使用所有可用的归档 DMSP-OLS 平滑分辨率数据制作的无云合成数据… dmsp eog imagery lights nighttime ols -
Daymet V4:每日地面天气和气候学摘要

Daymet V4 提供美国大陆、夏威夷和波多黎各的网格化每日天气参数估计值(波多黎各的数据从 1950 年开始提供)。它基于所选气象站数据和各种支持数据源得出。与之前版本相比,Daymet … climate daily daylight flux geophysical nasa -
指定:USGS GAP PAD-US v2.0
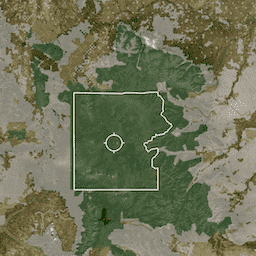
PAD-US 是美国官方的国家级陆地和海洋保护区清单,这些保护区致力于保护生物多样性以及其他自然、休闲和文化用途,并通过法律或其他有效手段进行管理,以实现这些目的。此数据库分为… conservation-easements designation infrastructure-boundaries management ownership protected-areas -
排水有机土壤排放量(年)1.0
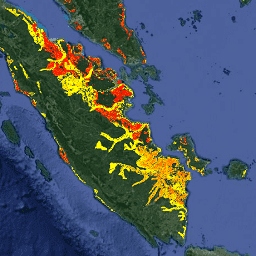
关于排水有机土壤的两个相关粮农组织数据集提供了以下估计值:DROSA-A:为农业活动(耕地和放牧草地)而排水的有机土壤面积(以公顷为单位);DROSE-A:有机土壤农业排水的碳 (C) 和一氧化二氮 (N2O) 估计值(以千兆克为单位),… agriculture climate climate-change emissions fao ghg -
Dynamic World V1

Dynamic World 是一个分辨率为 10 米的近乎实时 (NRT) 土地使用/土地覆盖 (LULC) 数据集,其中包含九个类别的类别概率和标签信息。Dynamic World 预测数据覆盖从 2015 年 6 月 27 日至今的 Sentinel-2 L1C 数据集。Sentinel-2 的重访频率为 2-5 天… 全球 google landcover landuse landuse-landcover nrt -
EC JRC 2020 年全球森林覆盖地图,V3

全球森林覆盖地图以空间显式方式呈现了 2020 年的森林存在情况和不存在情况,空间分辨率为 10 米。2020 年是欧盟“关于在市场上提供… eudr 森林 森林生物质 jrc -
EC JRC 全球森林类型地图(2020 年,V1)

全球森林类型地图以空间分布的形式呈现了 2020 年的原始森林、自然再生林和人工林(包括种植林),空间分辨率为 10 米。用于绘制这些森林类型的基本图层是森林覆盖范围… eudr 森林 森林生物质 jrc 土地覆盖 原始森林 -
ECMWF 近实时 IFS 大气预报
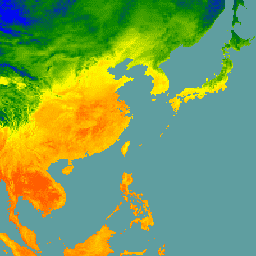
此数据集包含 ECMWF 综合预报系统 (IFS) 生成的 15 天大气模型变量预报数据,分辨率为 0.25 度。我们将这些数据称为近实时 (NRT) 数据,因为在 ECMWF 实时预测数据发布后,每天会发布两次新产品,作为其… climate dewpoint ecmwf forecast global humidity -
ECMWF 近乎实时 IFS 海浪(短截止期)预报
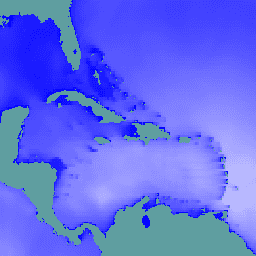
此数据集包含 ECMWF 综合预报系统 (IFS) 生成的 6 天海浪模型场预报数据,分辨率为 0.25 度。我们将这些数据称为近实时 (NRT) 数据,因为在 ECMWF 实时预测数据发布后,每天会发布两次新产品,作为其… climate ecmwf forecast global ocean -
ECMWF 近实时 IFS 海浪预报
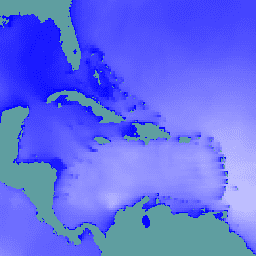
此数据集包含 ECMWF 综合预报系统 (IFS) 生成的 15 天海浪模型场预报数据,分辨率为 0.25 度。我们将这些数据称为近实时 (NRT) 数据,因为在 ECMWF 实时预测数据发布后,每天会发布两次新产品,作为其… climate ecmwf forecast global ocean -
ECOSTRESS 平铺辅助 NDVI 和反照率 L2 全球 70 米 V002
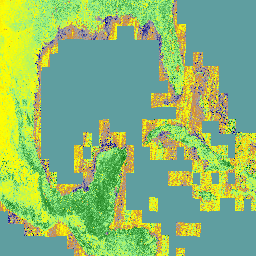
ECOSTRESS 瓦片辅助 NDVI 和反照率 (ECO_L2T_STARS) V002 数据集以 70 米的空间分辨率提供归一化差值植被指数 (NDVI) 和反照率数据。这种辅助产品对于了解植物需水量和水分胁迫至关重要,是通过数据融合流程创建的,该流程将可见光… 反照率 陆地 ndvi 植物生产力 -
EMIT L1B 传感器处校准的辐射率和地理定位数据 60 米

EMIT 项目是 NASA 地球科学部 (ESD) 项目主管指导下的地球探测器-仪器 (EV-I) 计划的一部分。EMIT 包含一个 VSWIR 红外戴森成像光谱仪,该光谱仪经过改造,可安装在国际空间站 (ISS) 上。EMIT 测量的是辐射度… daily emit nasa radiance satellite-imagery -
EMIT L2A 地表反射率估计值和不确定性以及掩码 60 米

EMIT 项目是 NASA 地球科学部 (ESD) 项目主管指导下的地球探测器-仪器 (EV-I) 计划的一部分。EMIT 包含一个 VSWIR 红外戴森成像光谱仪,该光谱仪经过改造,可安装在国际空间站 (ISS) 上。EMIT 测量的是辐射度… daily emit nasa reflectance satellite-imagery -
EO-1 Hyperion 高光谱成像仪

Hyperion 是一种高分辨率高光谱成像仪,可生成 220 个独特的光谱通道,范围从 0.357 微米到 2.576 微米,带宽为 10 纳米。该仪器以推扫方式运行,所有波段的空间分辨率均为 30 米,标准场景宽度为 … 高光谱 卫星图像 美国地质调查局 -
ERA5 日聚合 - ECMWF / 哥白尼气候变化服务生成的最新气候再分析数据

ERA5 是 ECMWF 对全球气候进行的第五代大气再分析。重新分析将模型数据与全球观测数据相结合,形成一个全球完整且一致的数据集。ERA5 取代了其前身 ERA-Interim 再分析。ERA5 DAILY 提供了每天的汇总值,适用于以下变量… climate copernicus dewpoint ecmwf era5 precipitation -
ERA5 每小时 - ECMWF 气候再分析
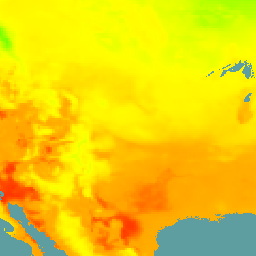
ERA5 是 ECMWF 对全球气候进行的第五代大气再分析。该数据集由 ECMWF 的哥白尼气候变化服务 (C3S) 生成。再分析将模型数据与全球观测数据相结合,利用物理定律生成全球完整且一致的数据集。 atmosphere climate copernicus ecmwf era5 hourly -
ERA5 月度汇总 - ECMWF / 哥白尼气候变化服务生成的最新气候再分析数据

ERA5 是 ECMWF 对全球气候进行的第五代大气再分析。重新分析将模型数据与全球观测数据相结合,形成一个全球完整且一致的数据集。ERA5 取代了其前身 ERA-Interim 再分析。ERA5 MONTHLY 提供了每个月的汇总值,适用于以下变量… climate copernicus dewpoint ecmwf era5 precipitation -
ERA5-Land 每日汇总 - ECMWF 气候再分析

ERA5-Land 是一种再分析数据集,可提供数十年来陆地变量演变的一致视图,与 ERA5 相比,分辨率更高。ERA5-Land 是通过重放 ECMWF ERA5 气候再分析的陆地分量生成的。重新分析将模型数据与…相结合 cds climate copernicus ecmwf era5-land evaporation -
ERA5-Land 每小时 - ECMWF 气候再分析

ERA5-Land 是一种再分析数据集,可提供数十年来陆地变量演变的一致视图,与 ERA5 相比,分辨率更高。ERA5-Land 是通过重放 ECMWF ERA5 气候再分析的陆地分量生成的。重新分析将模型数据与…相结合 cds climate copernicus ecmwf era5-land evaporation -
ERA5-Land 月度汇总 - ECMWF 气候再分析

ERA5-Land 是一种再分析数据集,可提供数十年来陆地变量演变的一致视图,与 ERA5 相比,分辨率更高。ERA5-Land 是通过重放 ECMWF ERA5 气候再分析的陆地分量生成的。重新分析将模型数据与…相结合 cds climate copernicus ecmwf era5-land evaporation -
ERA5-Land 按小时平均的月度数据 - ECMWF 气候再分析

ERA5-Land 是一种再分析数据集,可提供数十年来陆地变量演变的一致视图,与 ERA5 相比,分辨率更高。ERA5-Land 是通过重放 ECMWF ERA5 气候再分析的陆地分量生成的。重新分析将模型数据与…相结合 cds climate copernicus ecmwf era5-land evaporation -
ESA WorldCereal 10 m v100

欧洲空间局 (ESA) WorldCereal 10 米 2021 年产品套件包含全球范围的年度和季节性作物地图及其相关置信度。这些数据是在 ESA-WorldCereal 项目中生成的。如需详细了解这些产品的内容以及用于…的方法,请参阅… 农业 哥白尼 农作物 欧洲航天局 全球 土地覆盖 -
ESA WorldCereal AEZ v100

欧洲航天局 (ESA) WorldCereal 分类系统的目标是在特定生长季结束后一个月内生成产品。由于全球各地生长季的动态特性,我们根据… 农业 边界 作物 esa 全球 表格 -
ESA WorldCereal Active Cropland 10 m v100

欧洲空间局 (ESA) WorldCereal Active Cropland 10 m 2021 产品套件包含全球范围的季节性活跃农田标记。这些数据是在 ESA-WorldCereal 项目中生成的。有效农田产品表示被识别为临时作物的像素是否已积极… 农业 哥白尼 农作物 欧洲航天局 全球 土地覆盖 -
ESA WorldCover 10 米 v100
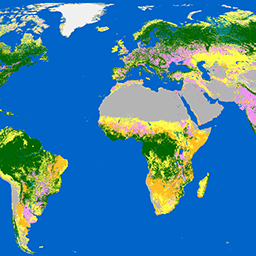
欧洲空间局 (ESA) WorldCover 10 米 2020 年产品基于 Sentinel-1 和 Sentinel-2 数据,提供 2020 年全球土地覆被地图,分辨率为 10 米。WorldCover 产品包含 11 种地表覆被类别,在 … 框架下生成 esa landcover landuse landuse-landcover sentinel1-derived sentinel2-derived -
ESA WorldCover 10m v200

欧洲空间局 (ESA) WorldCover 10 m 2021 产品基于 Sentinel-1 和 Sentinel-2 数据,提供 2021 年全球土地覆被地图,分辨率为 10 米。WorldCover 产品包含 11 种地表覆被类别,在 … 框架下生成 esa landcover landuse landuse-landcover sentinel1-derived sentinel2-derived -
ETOPO1:全球 1 分弧度海拔数据

ETOPO1 是一个 1 分弧度的全球地球表面地形模型,集成了陆地地形和海洋测深数据。它基于众多全球和区域数据集构建而成。它包含两个海拔高度频段:ice_surface 和 bedrock。 基岩 DEM 海拔 海拔-地形 地球物理 冰 -
EUCROPMAP

欧洲作物类型地图,基于 Sentinel-1 和 LUCAS Copernicus 2018 年实地观测数据(针对 2018 年),以及 Sentinel-1、Sentinel-2 和辅助数据与 LUCAS Copernicus 2022 年观测数据的组合(针对 2022 年)。该数据集基于独特的 LUCAS 2018 Copernicus 实地调查,是首个… agriculture crop eu jrc lucas sentinel1-derived -
EVI:Malaria Atlas Project 填充了缺失数据的增强型植被指数(每 8 天 1 千米)

此增强型植被指数 (EVI) 产品的基础数据集是 MODIS BRDF 校正后的影像 (MCD43B4),该影像已使用 Weiss 等人 (2014) 概述的方法进行了缺口填充,以消除因云覆盖等因素而导致的数据缺失。在填充缺失数据后,数据被剪裁到 … evi malariaatlasproject map publisher-dataset vegetation vegetation-indices -
EVI:Malaria Atlas Project 填充了缺失数据的增强型植被指数(每年 1 千米)

此增强型植被指数 (EVI) 产品的基础数据集是 MODIS BRDF 校正后的影像 (MCD43B4),该影像已使用 Weiss 等人 (2014) 概述的方法进行了缺口填充,以消除因云覆盖等因素而导致的数据缺失。在填充缺失数据后,数据被剪裁到 … evi malariaatlasproject map publisher-dataset vegetation vegetation-indices -
EVI:Malaria Atlas Project 填充了缺失数据的增强型植被指数(每月 1 千米)
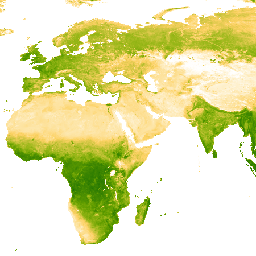
此增强型植被指数 (EVI) 产品的基础数据集是 MODIS BRDF 校正后的影像 (MCD43B4),该影像已使用 Weiss 等人 (2014) 概述的方法进行了缺口填充,以消除因云覆盖等因素而导致的数据缺失。在填充缺失数据后,数据被剪裁到 … evi malariaatlasproject map publisher-dataset vegetation vegetation-indices -
地球表面矿物尘埃源调查 - 甲烷增强

EMIT 项目是 NASA 地球科学部 (ESD) 项目主管指导下的地球探测器-仪器 (EV-I) 计划的一部分。EMIT 包含一个 VSWIR 红外戴森成像光谱仪,该光谱仪经过改造,可安装在国际空间站 (ISS) 上。EMIT 测量的是辐射度… atmosphere daily emit methane nasa -
地球表面矿物尘埃源调查 - 甲烷羽流复合体

EMIT 项目是 NASA 地球科学部 (ESD) 项目主管指导下的地球探测器-仪器 (EV-I) 计划的一部分。EMIT 包含一个 VSWIR 红外戴森成像光谱仪,该光谱仪经过改造,可安装在国际空间站 (ISS) 上。EMIT 测量的是辐射度… atmosphere daily emit methane nasa -
地役权:USGS GAP PAD-US v2.0

PAD-US 是美国官方的国家级陆地和海洋保护区清单,这些保护区致力于保护生物多样性以及其他自然、休闲和文化用途,并通过法律或其他有效手段进行管理,以实现这些目的。此数据库分为… conservation-easements designation infrastructure-boundaries management ownership protected-areas -
英格兰 1 米合成 DTM/DSM(环境署)
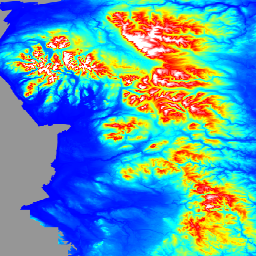
LIDAR 复合 DTM/DSM 是一种栅格地形模型,覆盖了英格兰约 99% 的区域,空间分辨率为 1 米,由英国环境署于 2022 年制作。该模型包含 3 个地形数据波段:数字地形模型 (DTM)、首次回波数字表面模型 (DSM) … dem elevation elevation-topography lidar -
爱沙尼亚 RGB 低空正射影像

正射影像是覆盖爱沙尼亚的航空照片数据集。正射影像是经过处理的航空照片,其中消除了地形起伏、曝光时相机相对于地面的倾斜以及相机中心投影造成的失真。数字正射影像具有一定的… 爱沙尼亚 低空飞行 正射影像 RGB -
爱沙尼亚 RGB 正射影像

正射影像是覆盖爱沙尼亚的航空照片数据集。正射影像是经过处理的航空照片,其中消除了地形起伏、曝光时相机相对于地面的倾斜以及相机中心投影造成的失真。数字正射影像具有一定的… 爱沙尼亚 正射影像 RGB -
爱沙尼亚单色低空飞行正射影像

正射影像是覆盖爱沙尼亚的航空照片数据集。正射影像是经过处理的航空照片,其中消除了地形起伏、曝光时相机相对于地面的倾斜以及相机中心投影造成的失真。数字正射影像具有一定的… 爱沙尼亚 低空飞行 正射影像 -
爱沙尼亚单色正射影像

正射影像是覆盖爱沙尼亚的航空照片数据集。正射影像是经过处理的航空照片,其中消除了地形起伏、曝光时相机相对于地面的倾斜以及相机中心投影造成的失真。数字正射影像具有一定的… 爱沙尼亚 正射影像 -
欧洲原始森林数据集 - 点

欧洲原始森林数据整合了 48 个不同的原始森林数据集(主要基于实地调查),包含分布在 33 个国家/地区的 18,411 个单独的斑块(4,110 万公顷)。它主要包括原始森林、演替后期森林,但也包括一些在自然扰动后形成的早期演替阶段森林和年轻森林… europe forest forest-biomass table -
欧洲原始森林数据集 - 多边形
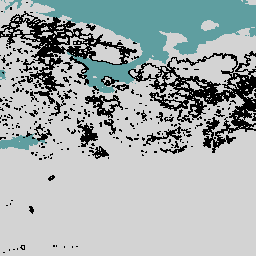
欧洲原始森林数据整合了 48 个不同的原始森林数据集(主要基于实地调查),包含分布在 33 个国家/地区的 18,411 个单独的斑块(4,110 万公顷)。它主要包括原始森林、演替后期森林,但也包括一些在自然扰动后形成的早期演替阶段森林和年轻森林… europe forest forest-biomass table -
FAO GAUL 500m Simplified: Global Administrative Unit Layers 2015, Country Boundaries

此版本的 GAUL 数据集已简化为 500 米。全球行政区划层 (GAUL) 汇编并传播有关世界各国行政区划的最佳可用信息,为表示行政区划的空间数据集的标准化做出贡献。… 边界 国家/地区 fao gaul infrastructure-boundaries 表格 -
FAO GAUL 500m Simplified: Global Administrative Unit Layers 2015, First-Level Administrative Units

此版本的 GAUL 数据集已简化为 500 米。全球行政区划层 (GAUL) 汇编并传播有关世界各国行政区划的最佳可用信息,为表示行政区划的空间数据集的标准化做出贡献。… borders departments fao gaul infrastructure-boundaries provinces -
FAO GAUL 500m Simplified: Global Administrative Unit Layers 2015, Second-Level Administrative Units

此版本的 GAUL 数据集已简化为 500 米。全球行政区划层 (GAUL) 汇编并传播有关世界各国行政区划的最佳可用信息,为表示行政区划的空间数据集的标准化做出贡献。… 边界 县 行政区 粮农组织 GAUL 基础设施边界 -
FAO GAUL:全球行政区划层 2015 年,国家/地区边界
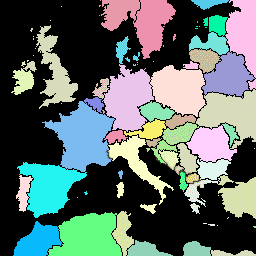
全球行政区划层 (GAUL) 汇编并传播有关世界各国行政区划的最佳可用信息,为表示行政区划的空间数据集的标准化做出贡献。GAUL 始终维护具有统一…的全球层 边界 国家/地区 fao gaul infrastructure-boundaries 表格 -
FAO GAUL:全球行政区划层级 2015 年版,一级行政区
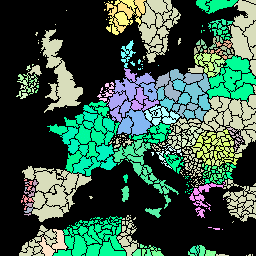
全球行政区划层 (GAUL) 汇编并传播有关世界各国行政区划的最佳可用信息,为表示行政区划的空间数据集的标准化做出贡献。GAUL 始终维护具有统一…的全球层 borders departments fao gaul infrastructure-boundaries provinces -
FAO GAUL:2015 年全球行政单位层级,二级行政单位

全球行政区划层 (GAUL) 汇编并传播有关世界各国行政区划的最佳可用信息,为表示行政区划的空间数据集的标准化做出贡献。GAUL 始终维护具有统一…的全球层 边界 县 行政区 粮农组织 GAUL 基础设施边界 -
FIRMS:资源管理系统火灾信息

资源管理系统火灾信息 (FIRMS) 数据集的 Earth Engine 版本包含光栅化的 LANCE 火灾检测产品。LANCE 使用标准 MODIS MOD14/MYD14 火点和热异常产品处理近乎实时 (NRT) 的火点位置。每个… eosdis 火灾 firms 地球物理 热点 lance -
FLDAS:Famine Early Warning Systems Network (FEWS NET) Land Data Assimilation System

FLDAS 数据集(McNally 等人,2017 年)旨在帮助在数据稀疏的发展中国家环境中进行粮食安全评估。它包含许多与气候相关的变量的信息,包括水分含量、湿度、蒸发蒸腾、平均土壤温度、总降水率等。FLDAS 数据集有多种不同的版本;… climate cryosphere evapotranspiration humidity ldas monthly -
FORMA 提醒阈值

WRI 的注意事项:WRI 决定停止更新 FORMA 提醒。目标是简化 Global Forest Watch 用户体验并减少冗余。我们发现,Terra-i 和 GLAD 的使用频率更高。此外,使用 GLAD 作为标准,发现 Terra-i 的性能优于 FORMA… 每日 森林砍伐 火灾 森林 forma gfw -
FORMA 提醒

WRI 的注意事项:WRI 决定停止更新 FORMA 提醒。目标是简化 Global Forest Watch 用户体验并减少冗余。我们发现,Terra-i 和 GLAD 的使用频率更高。此外,使用 GLAD 作为标准,发现 Terra-i 的性能优于 FORMA… 每日 森林砍伐 火灾 森林 forma gfw -
FORMA 原始输出 FIRMS

WRI 的注意事项:WRI 决定停止更新 FORMA 提醒。目标是简化 Global Forest Watch 用户体验并减少冗余。我们发现,Terra-i 和 GLAD 的使用频率更高。此外,使用 GLAD 作为标准,发现 Terra-i 的性能优于 FORMA… 每日 森林砍伐 火灾 森林 forma gfw -
FORMA 原始输出 NDVI

WRI 的注意事项:WRI 决定停止更新 FORMA 提醒。目标是简化 Global Forest Watch 用户体验并减少冗余。我们发现,Terra-i 和 GLAD 的使用频率更高。此外,使用 GLAD 作为标准,发现 Terra-i 的性能优于 FORMA… 每日 森林砍伐 森林 森林生物质 FORMA gfw -
FORMA 植被 T 统计信息

WRI 的注意事项:WRI 决定停止更新 FORMA 提醒。目标是简化 Global Forest Watch 用户体验并减少冗余。我们发现,Terra-i 和 GLAD 的使用频率更高。此外,使用 GLAD 作为标准,发现 Terra-i 的性能优于 FORMA… 每日 森林砍伐 森林 森林生物质 FORMA gfw -
Farmscapes 2020
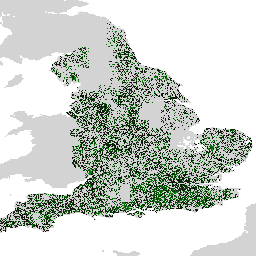
Farmscapes 2020 数据集提供了英格兰农业景观中三种关键半自然特征(树篱、林地和石墙)的高分辨率 (25cm) 概率地图。此数据集是与 Oxford Leverhulme Centre for Nature Recovery 合作开发的,可作为多种应用(包括…)的基准。 生物多样性 气候 保护 森林 土地利用和土地覆盖 自然轨迹 -
费用:USGS GAP PAD-US v2.0

PAD-US 是美国官方的国家级陆地和海洋保护区清单,这些保护区致力于保护生物多样性以及其他自然、休闲和文化用途,并通过法律或其他有效手段进行管理,以实现这些目的。此数据库分为… conservation-easements designation infrastructure-boundaries management ownership protected-areas -
芬兰 NRG NLS 正射影像(50 厘米),由 Mavi 提供
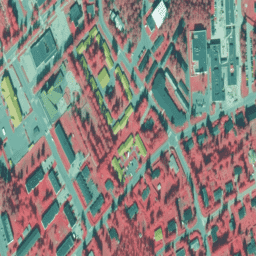
NLS 正射影像是覆盖整个芬兰的航空照片数据集。这些数据由 Mavi(农村事务局)提供。正射影像是多张单独的航空照片的组合。正射影像格式的航空照片数据集可作为最新数据集使用… 假彩色 芬兰 nrg 正射影像 -
芬兰 NRG NLS 正射影像(50 厘米),由 SMK 提供

NLS 正射影像是覆盖整个芬兰的航空照片数据集。这些数据由 SMK(能源署,前身为 SMK)提供。正射影像是多张单独的航空照片的组合。正射影像格式的航空照片数据集可作为最… falsecolor finland nrg orthophotos smk -
芬兰 RGB NLS 正射影像(50 厘米)- SMK

NLS 正射影像是覆盖整个芬兰的航空照片数据集。这些数据由 SMK(能源署,前身为 SMK)提供。正射影像是多张单独的航空照片的组合。正射影像格式的航空照片数据集可作为… 芬兰 正射影像 rgb smk -
FireCCI51:MODIS Fire_cci 烧毁面积像素产品,版本 5.1

MODIS Fire_cci 烧毁面积像素产品版本 5.1 (FireCCI51) 是一种每月更新的全球数据集,空间分辨率约为 250 米,包含烧毁面积信息以及辅助数据。该指数基于 MODIS 仪器在近红外 (NIR) 波段的表面反射率计算得出,… burn climate-change copernicus esa fire fragmentation -
Forest Persistence v0

注意:此数据集尚未经过同行评审。如需了解详情,请参阅与此模型关联的 GitHub README。此图片提供了一个逐像素得分(范围为 [0, 1]),用于指示相应像素区域在 2020 年是否被未受干扰的森林占据。这些得分是… 生物多样性 保护 森林砍伐 EUDR 森林生物质 forestdatapartnership -
森林邻近人群 (FPP) 1.0

“森林附近的人口”(FPP) 数据集是促成开发森林合作伙伴关系 (CPF) 全球核心森林相关指标集 (GCS) 中指标 13“极度贫困的森林依赖人口数量”的数据层之一。FPP 数据集提供了一个… 农业 粮农组织 森林 全球 植物生产力 人口 -
GCOM-C/SGLI L3 叶绿素 a 浓度(V1)

此产品是指海洋表层浮游植物中光合色素(叶绿素 a)的浓度。此数据集还提供了一个较新版本 JAXA/GCOM-C/L3/OCEAN/CHLA/V3,该版本使用此算法进行处理。GCOM-C 进行长期持续的全球观测和数据收集,以阐明… chla 叶绿素 a g-portal gcom gcom-c jaxa -
GCOM-C/SGLI L3 叶绿素 a 浓度(版本 2)

此产品是指海洋表层浮游植物中光合色素(叶绿素 a)的浓度。对于 2021 年 11 月 28 日之后的数据,请参阅 V3 数据集。GCOM-C 会进行长期持续的全球观测和数据收集,以阐明辐射收支波动背后的机制,并… chla 叶绿素 a g-portal gcom gcom-c jaxa -
GCOM-C/SGLI L3 叶绿素 a 浓度(版本 3)

此产品是指海洋表层浮游植物中光合色素(叶绿素 a)的浓度。这是一个持续更新的数据集,延迟时间为 3-4 天。GCOM-C 会进行长期持续的全球观测和数据收集,以阐明以下波动背后的机制:… chla 叶绿素 a g-portal gcom gcom-c jaxa -
GCOM-C/SGLI L3 地表温度 (V1)

此产品是陆地表面的温度。此数据集还提供了一个较新的版本 JAXA/GCOM-C/L3/LAND/LST/V3,该版本使用此算法进行处理。GCOM-C 会进行长期持续的全球观测和数据收集,以阐明辐射收支波动背后的机制,并… 气候 g-portal gcom gcom-c jaxa 陆地 -
GCOM-C/SGLI L3 地表温度 (V2)
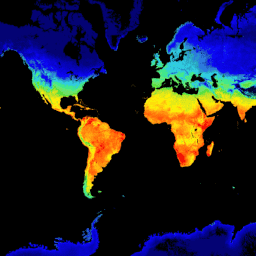
此产品是陆地表面的温度。对于 2021 年 11 月 28 日之后的数据,请参阅 V3 数据集。GCOM-C 会进行长期持续的全球观测和数据收集,以阐明辐射预算和碳循环波动背后的机制,从而准确预测… 气候 g-portal gcom gcom-c jaxa 陆地 -
GCOM-C/SGLI L3 地表温度 (V3)

此产品是陆地表面的温度。这是一个持续更新的数据集,延迟时间为 3-4 天。GCOM-C 进行长期持续的全球观测和数据收集,以阐明辐射预算和碳循环波动背后的机制,从而做出… 气候 g-portal gcom gcom-c jaxa 陆地 -
GCOM-C/SGLI L3 叶面积指数 (V1)

此产品是单位地表面积的单侧绿叶面积的总和。此数据集还提供更新版本 JAXA/GCOM-C/L3/LAND/LAI/V3,该版本使用此算法进行处理。GCOM-C 进行长期持续的全球观测和数据收集,以阐明…的机制 g-portal gcom gcom-c jaxa lai land -
GCOM-C/SGLI L3 叶面积指数 (V2)

此产品是单位地表面积的单侧绿叶面积的总和。对于 2021 年 11 月 28 日之后的数据,请参阅 V3 数据集。GCOM-C 会进行长期持续的全球观测和数据收集,以阐明辐射预算和碳循环波动背后的机制… g-portal gcom gcom-c jaxa lai land -
GCOM-C/SGLI L3 叶面积指数(版本 3)

此产品是单位地表面积的单侧绿叶面积的总和。这是一个持续更新的数据集,延迟时间为 3-4 天。GCOM-C 会进行长期持续的全球观测和数据收集,以阐明辐射收支波动背后的机制… g-portal gcom gcom-c jaxa lai land -
GCOM-C/SGLI L3 海表温度 (V1)

此产品是海面温度。此数据集还提供了一个较新的版本 JAXA/GCOM-C/L3/OCEAN/SST/V3,该版本使用此算法进行处理。GCOM-C 会进行长期持续的全球观测和数据收集,以阐明辐射预算和碳…… 气候 g-portal gcom gcom-c jaxa 海洋 -
GCOM-C/SGLI L3 海表温度(版本 2)

此产品是海面温度。对于 2021 年 11 月 28 日之后的数据,请参阅 V3 数据集。GCOM-C 进行长期持续的全球观测和数据收集,以阐明辐射预算和碳循环波动背后的机制,从而准确预测未来… 气候 g-portal gcom gcom-c jaxa 海洋 -
GCOM-C/SGLI L3 海表温度 (V3)

此产品是海面温度。这是一个持续更新的数据集,延迟时间为 3-4 天。GCOM-C 会进行长期持续的全球观测和数据收集,以阐明辐射预算和碳循环波动背后的机制,从而做出准确的… 气候 g-portal gcom gcom-c jaxa 海洋 -
GEDI L2A 栅格冠层顶部高度(版本 2)
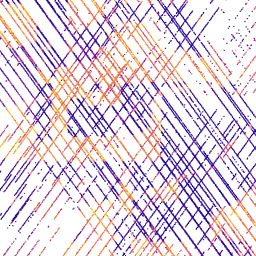
GEDI 的 2A 级地理定位高程和高度指标产品 (GEDI02_A) 主要由 100 个相对高度 (RH) 指标组成,这些指标共同描述了 GEDI 收集的波形。原始 GEDI02_A 产品是一个点表,空间分辨率(平均足迹)为 25 米。… 海拔 森林生物质 GEDI LARSE NASA 树木覆盖率 -
GEDI L2A Vector Canopy Top Height(版本 2)

GEDI 的 2A 级地理定位高程和高度指标产品 (GEDI02_A) 主要由 100 个相对高度 (RH) 指标组成,这些指标共同描述了 GEDI 收集的波形。原始 GEDI02_A 产品是一个点表,空间分辨率(平均足迹)为 25 米。… 海拔 森林生物质 GEDI LARSE NASA 树木覆盖率 -
GEDI L2A 表格索引

这是基于 LARSE/GEDI/GEDI02_A_002 中 L2A 表格几何图形创建的特征集合。每个特征代表源表格的多边形足迹,包含其资源 ID 和起止时间戳。更多信息请参阅用户指南。全球生态系统动态调查 (GEDI) 任务… 海拔 森林生物质 GEDI LARSE NASA 表格 -
GEDI L2B 栅格冠层覆盖率垂直剖面指标(版本 2)
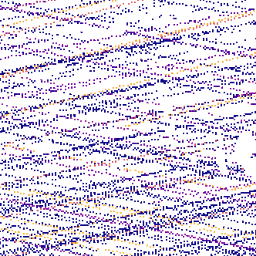
GEDI Level 2B Canopy Cover and Vertical Profile Metrics 产品 (GEDI02_B) 可从每个 GEDI 波形中提取生物物理指标。这些指标基于从 L1B 波形得出的方向性间隙概率剖面。植被剖面测量之间的垂直步长(在 GEDI 中称为 dZ)… 海拔 森林生物质 GEDI LARSE NASA 树木覆盖率 -
GEDI L2B Vector Canopy Cover Vertical Profile Metrics(版本 2)
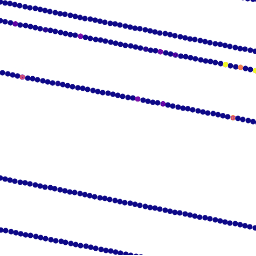
GEDI Level 2B Canopy Cover and Vertical Profile Metrics 产品 (GEDI02_B) 可从每个 GEDI 波形中提取生物物理指标。这些指标基于从 L1B 波形得出的方向性间隙概率剖面。植被剖面测量之间的垂直步长(在 GEDI 中称为 dZ)… 海拔 森林生物质 GEDI LARSE NASA 树木覆盖率 -
GEDI L2B 表格索引

这是基于 LARSE/GEDI/GEDI02_B_002 中 L2B 表格几何图形创建的特征集合。每个特征代表源表格的多边形足迹,包含其资源 ID 和起止时间戳。更多信息请参阅用户指南。全球生态系统动态调查 (GEDI) 任务… 海拔 森林生物质 GEDI LARSE NASA 表格 -
GEDI L4A 地上生物质密度,版本 2.1

此数据集包含全球生态系统动态调查 (GEDI) 4A 级 (L4A) 第 2 版地上生物量密度(AGBD;单位为 Mg/ha)预测结果,以及每个采样地理定位激光足迹内的预测标准误差估计值。在此版本中,颗粒位于子轨道中。身高指标… 海拔 森林生物质 GEDI LARSE NASA 树木覆盖率 -
GEDI L4A Raster Aboveground Biomass Density, Version 2.1

此数据集包含全球生态系统动态调查 (GEDI) 4A 级 (L4A) 第 2 版地上生物量密度(AGBD;单位为 Mg/ha)预测结果,以及每个采样地理定位激光足迹内的预测标准误差估计值。在此版本中,颗粒位于子轨道中。身高指标… 海拔 森林生物质 GEDI LARSE NASA 树木覆盖率 -
GEDI L4A 表格索引

这是基于 LARSE/GEDI/GEDI04_A_002 中 L4A 表格几何图形创建的特征集合。每个特征代表源表格的多边形足迹,包含其资源 ID 和起止时间戳。更多信息请参阅用户指南。全球生态系统动态调查 (GEDI) 任务… 海拔 森林生物质 GEDI LARSE NASA 表格 -
GEDI L4B 网格化地上生物质密度(版本 2)

此全球生态系统动态调查 (GEDI) L4B 产品基于从任务周 19(2019 年 4 月 18 日开始)到任务周 138(2021 年 8 月 4 日结束)的观测结果,提供 1 公里 x 1 公里的平均地上生物量密度 (AGBD) 估计值。GEDI L4A Footprint Biomass 产品可将 … 海拔 森林生物质 GEDI LARSE NASA 树木覆盖率 -
GEOS-CF fcst htf v1:Goddard 地球观测系统成分预报

本数据集包含高时间频率 (htf) 数据的气象预报 (fcst)。使用“creation_time”和“forecast_time”属性选择感兴趣的数据。Goddard 地球观测系统成分预报 (GEOS-CF) 系统是 NASA 全球建模与同化办公室 (GMAO) 开发的高分辨率 (0.25°) 全球成分预测系统。 大气 成分 预报 geos gmao nasa -
GEOS-CF fcst tavg1hr v1:Goddard 地球观测系统成分预报
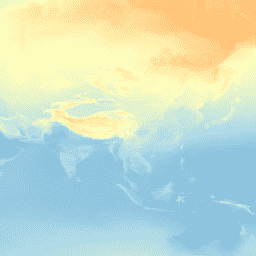
本数据集包含时间平均频率数据 (tavg1hr) 的气象预报 (fcst)。使用“creation_time”和“forecast_time”属性选择感兴趣的数据。Goddard 地球观测系统成分预报 (GEOS-CF) 系统是 NASA 全球建模与同化办公室 (GMAO) 开发的高分辨率 (0.25°) 全球成分预测系统。 大气 成分 预报 geos gmao nasa -
GEOS-CF rpl htf v1:Goddard 地球观测系统成分预报

本数据集包含高时间频率 (htf) 数据的气象重放 (rpl)。Goddard 地球观测系统成分预报 (GEOS-CF) 系统是 NASA 全球建模与同化办公室 (GMAO) 开发的高分辨率 (0.25°) 全球成分预测系统。GEOS-CF 为大气化学研究提供了一款新工具,旨在… 大气 成分 预报 geos gmao nasa -
GEOS-CF rpl tavg1hr v1:Goddard 地球观测系统成分预报

本数据集包含时间平均 1 小时数据 (tavg1hr) 的气象重放 (rpl)。它是通过合并原始 GEOS-CF 集合 chm_tavg_1hr_g1440x721_v1、met_tavg_1hr_g1440x721_x1 和 xgc_tavg_1hr_g1440x721_x1 构建的。Goddard 地球观测系统成分预报 (GEOS-CF) 系统是 NASA 全球建模与同化办公室 (GMAO) 开发的高分辨率 (0.25°) 全球成分预测系统。 大气 成分 预报 geos gmao nasa -
GFPLAIN250m:全球 250 米洪泛平原数据集

GFPLAIN250m 包含地球洪泛区的栅格数据,这些数据是使用 Nardi 等人(2006 年、2018 年)提出的地貌方法识别的。250 米洪泛平原数据集是通过处理从 http://srtm.csi.cgiar.org/ 收集的 NASA SRTM 数字高程模型(尤其是 250 米 SRTM 版本 4.1)得出的… flood monitoring surface-ground-water -
GFS:全球预报系统 384 小时预测大气数据

全球预报系统 (GFS) 是由美国国家环境预报中心 (NCEP) 生成的天气预报模型。GFS 数据集包含选定的模型输出(如下所述),以网格化预报变量的形式呈现。384 小时预报,其中 1 小时(最多 120 小时)和 3 小时(之后… 气候 云 通量 预报 地球物理 湿度 -
GFSAD1000:农田范围 1 公里多研究作物掩码,全球粮食支持分析数据

GFSAD 是 NASA 资助的项目,旨在提供高分辨率的全球农田数据及其用水量,以促进 21 世纪的全球粮食安全。GFSAD 产品是通过多传感器遥感数据(例如,Landsat、MODIS、AVHRR)、次级数据和实地试验区数据… 农业 农作物 地表覆盖 usgs -
GFW(Global Fishing Watch)每日捕捞时长

捕鱼努力程度,以推断出的捕鱼活动的小时数来衡量。每个资产都是给定标志状态和日期的努力程度,其中一个条带表示每种渔具类型的捕鱼活动。查看 Earth Engine 脚本示例。另请访问 GFW 主网站,了解计划… fishing gfw marine monthly ocean oceans -
GFW(全球渔业观察)每日船舶小时数

渔船存在情况,以每平方公里的小时数来衡量。每项资产都是给定旗帜状态和日期的渔船存在情况,每个频段代表一种渔具类型的存在情况。查看 Earth Engine 脚本示例。另请访问 GFW 主网站,了解计划… fishing gfw marine monthly ocean oceans -
GHSL:城镇化程度 1975-2030 年 V2-0 (P2023A)
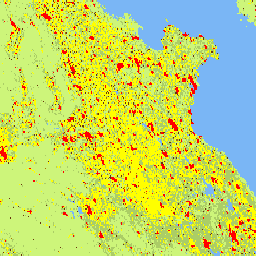
此栅格数据集表示全球多时态城乡分类,应用了联合国统计委员会推荐的“城市化程度”第一阶段方法,基于 GHSL 项目生成的 1975 年至 2030 年(以 5 年为间隔)全球网格化人口和建成区地表数据。学位… ghsl jrc population sdg settlement -
GHSL:全球建筑物高度 2018 年(P2023A)

此空间栅格数据集描绘了 2018 年全球建筑物高度分布情况,分辨率为 100 米。用于预测建筑物高度的输入数据包括 ALOS 全球数字地表模型 (30 m)、NASA 航天飞机雷达地形任务 … alos building built built-environment builtup copernicus -
GHSL:全球建筑体积 1975-2030 年(P2023A)

此栅格数据集描绘了建筑体积的全球分布情况,以每 100 米网格单元的立方米数表示。该数据集用于衡量总建筑体积以及分配给主要为非住宅 (NRES) 用途的网格单元的建筑体积。估算值基于累积的… alos building built-environment copernicus dem ghsl -
GHSL:全球建成区地表 10 米 (P2023A)

此栅格数据集描绘了 2018 年从 S2 影像数据中观测到的建成区地表分布情况,以每 10 米网格单元的平方米数表示。这些数据集用于衡量:a) 总建成区面积;b) 分配给网格单元的建成区面积(… built built-environment builtup copernicus ghsl jrc -
GHSL:全球建成区地表 1975-2030 年 (P2023A)
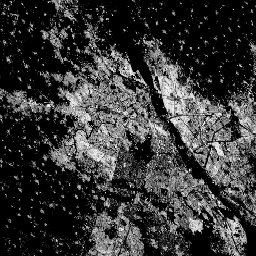
此栅格数据集描绘了建成地表的分布情况,以每 100 米网格单元的平方米数表示。该数据集衡量了以下指标:a) 总建成区地表,以及 b) 分配给以非住宅 (NRES) 用途为主的网格单元的建成区地表。数据经过时空插值或… built built-environment builtup copernicus ghsl jrc -
GHSL:1975-2030 年全球人口地表数据 (P2023A)
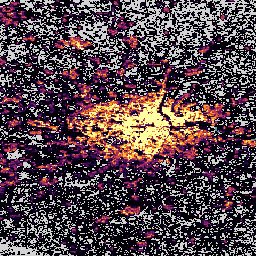
此栅格数据集描绘了居住人口的空间分布,以单元格的绝对居民人数表示。1975 年至 2020 年间以 5 年为间隔的居住人口估计值以及根据 CIESIN GPWv4.11 得出的 2025 年和 2030 年预测值,均根据人口普查或…进行了细分 ghsl jrc population sdg -
GHSL:全球聚落特征 (10 m) 2018 年 (P2023A)
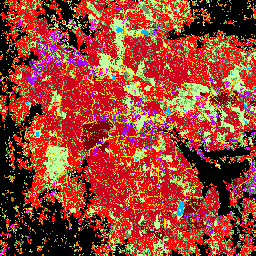
此空间栅格数据集以 10 米分辨率划定人类住区,并从建成环境的功能和高度相关组成部分方面描述其内部特征。如需详细了解 GHSL 数据产品,请参阅 GHSL Data Package 2023 报告… building built builtup copernicus ghsl height -
来自 AVHRR 传感器的 GIMMS NDVI(第 3 代)

GIMMS NDVI 是根据 NOAA 的多个 AVHRR 传感器生成的,适用于全球 1/12 度经纬度网格。GIMMS NDVI 数据集的最新版本名为 NDVI3g(来自 AVHRR 传感器的第三代 GIMMS NDVI)。 avhrr nasa ndvi noaa 植被 植被指数 -
GLCF:Landsat 全球内陆水体

全球内陆水体数据集显示了内陆地表水体,包括淡水湖和咸水湖、河流和水库。从 GLS 2000 时代开始,我们确定了 3,650,723 平方公里的内陆水域,其中约四分之三位于北美洲和亚洲。寒带森林和苔原… glcf landsat-derived nasa surface-ground-water umd water -
GLDAS-2.1:全球陆面数据同化系统

NASA 全球陆面数据同化系统第 2 版 (GLDAS-2) 包含三个组成部分:GLDAS-2.0、GLDAS-2.1 和 GLDAS-2.2。GLDAS-2.0 完全由普林斯顿气象强迫输入数据强迫,并提供 1948 年至 2014 年的时间上一致的序列。GLDAS-2.1 采用模型…的组合进行强制 3 小时 气候 冰冻圈 蒸发 强迫 地球物理 -
GLDAS-2.2:全球陆面数据同化系统

NASA 全球陆面数据同化系统第 2 版 (GLDAS-2) 包含三个组成部分:GLDAS-2.0、GLDAS-2.1 和 GLDAS-2.2。GLDAS-2.0 完全由普林斯顿气象强迫输入数据强迫,并提供 1948 年至 2014 年的时间上一致的序列。GLDAS-2.1 采用模型…的组合进行强制 3 小时 气候 冰冻圈 蒸发 强迫 地球物理 -
GLIMS 2023:从太空获取的全球陆地冰川测量数据
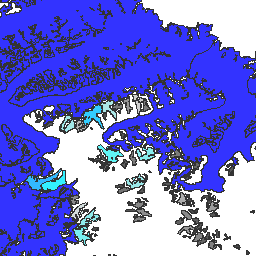
“全球陆地冰川太空测量计划”(GLIMS) 是一项国际计划,旨在反复调查全球约 20 万条冰川。该项目旨在创建一份全球全面的陆地冰川清单,包括冰川面积、几何形状、地表速度和雪线的测量数据… 冰冻圈 冰川 glims 冰 landcover nasa -
GLIMS Current:从太空进行的全球陆地冰测量
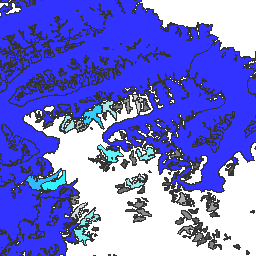
“全球陆地冰川太空测量计划”(GLIMS) 是一项国际计划,旨在反复调查全球约 20 万条冰川。该项目旨在创建一份全球全面的陆地冰川清单,包括冰川面积、几何形状、地表速度和雪线的测量数据… 冰冻圈 冰川 glims 冰 landcover nasa -
GLOBathy 全球湖泊测深数据集

全球测深 (GLOBathy) 数据集包含全球 140 多万个水体的数据,经过精心开发,可与广受认可的 HydroLAKES 数据集保持一致。GLOBathy 利用基于地理信息系统 (GIS) 的复杂框架,通过整合最大深度估计值和几何/地球物理…来构建详细的海底地形图。 测深 社区数据集 水文 sat-io 地表地下水 -
GMTED2010:2010 年全球多分辨率地形高程数据

全球多分辨率地形高程数据 2010 (GMTED2010) 数据集包含从各种来源收集的全球高程数据,分辨率为 7.5 角秒。如需了解详情,请参阅数据集报告。GMTED2010 的主要源数据集是 NGA 的 SRTM 数字地形高程数据 (DTED®… dem elevation elevation-topography geophysical srtm topography -
GOES-16 FDCC 系列 ABI 2 级火点/热点特征 CONUS

Fire (HSC) 产品包含四张影像:一张是火点掩膜,另外三张的像素值分别表示火点温度、火点面积和火点辐射功率。ABI L2+ FHS 元数据掩模会为每个经过地球导航定位的像素分配一个标志,用于… abi fdc fire goes goes-16 goes-east -
GOES-16 FDCF 系列 ABI 2 级火点/热点特征全圆盘

Fire (HSC) 产品包含四张影像:一张是火点掩膜,另外三张的像素值分别表示火点温度、火点面积和火点辐射功率。ABI L2+ FHS 元数据掩模会为每个经过地球导航定位的像素分配一个标志,用于… abi fdc fire goes goes-16 goes-east -
GOES-16 MCMIPC 系列 ABI 2 级云和湿气图像 CONUS
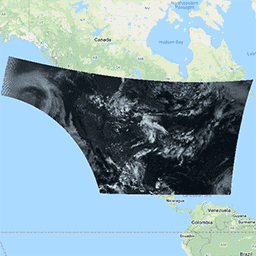
云和湿气图像产品的分辨率均为 2 公里。波段 1-6 为反射性波段。无量纲的“反射因子”量会根据太阳天顶角进行归一化。这些波段支持对云、植被、雪/冰和气溶胶进行表征。波段 7-16 为发射性波段。亮度温度… abi atmosphere goes goes-16 goes-east goes-r -
GOES-16 MCMIPF 系列 ABI 2 级云和湿气图像全圆盘

云和湿气图像产品的分辨率均为 2 公里。波段 1-6 为反射性波段。无量纲的“反射因子”量会根据太阳天顶角进行归一化。这些波段支持对云、植被、雪/冰和气溶胶进行表征。波段 7-16 为发射性波段。亮度温度… abi atmosphere goes goes-16 goes-east goes-r -
GOES-16 MCMIPM 系列 ABI 2 级云和湿气图像中尺度
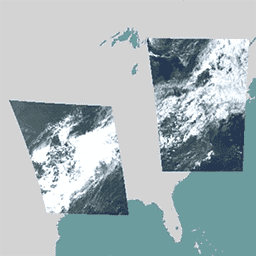
云和湿气图像产品的分辨率均为 2 公里。波段 1-6 为反射性波段。无量纲的“反射因子”量会根据太阳天顶角进行归一化。这些波段支持对云、植被、雪/冰和气溶胶进行表征。波段 7-16 为发射性波段。亮度温度… abi atmosphere goes goes-16 goes-east goes-r -
GOES-17 FDCC 系列 ABI 2 级火点/热点特征 CONUS

Fire (HSC) 产品包含四张影像:一张是火点掩膜,另外三张的像素值分别表示火点温度、火点面积和火点辐射功率。ABI L2+ FHS 元数据掩模会为每个经过地球导航定位的像素分配一个标志,用于… abi fdc fire goes goes-17 goes-s -
GOES-17 FDCF 系列 ABI 2 级火点/热点特征全圆盘

Fire (HSC) 产品包含四张影像:一张是火点掩膜,另外三张的像素值分别表示火点温度、火点面积和火点辐射功率。ABI L2+ FHS 元数据掩模会为每个经过地球导航定位的像素分配一个标志,用于… abi fdc fire goes goes-17 goes-s -
GOES-17 MCMIPC 系列 ABI 2 级云和湿气图像(美国大陆)

云和湿气图像产品的分辨率均为 2 公里。波段 1-6 为反射性波段。无量纲的“反射因子”量会根据太阳天顶角进行归一化。这些波段支持对云、植被、雪/冰和气溶胶进行表征。波段 7-16 为发射性波段。亮度温度… abi atmosphere goes goes-17 goes-s mcmip -
GOES-17 MCMIPF 系列 ABI 2 级云和湿气图像全圆盘

云和湿气图像产品的分辨率均为 2 公里。波段 1-6 为反射性波段。无量纲的“反射因子”量会根据太阳天顶角进行归一化。这些波段支持对云、植被、雪/冰和气溶胶进行表征。波段 7-16 为发射性波段。亮度温度… abi atmosphere goes goes-17 goes-s mcmip -
GOES-17 MCMIPM 系列 ABI 2 级云和湿气图像中尺度
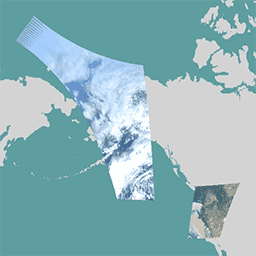
云和湿气图像产品的分辨率均为 2 公里。波段 1-6 为反射性波段。无量纲的“反射因子”量会根据太阳天顶角进行归一化。这些波段支持对云、植被、雪/冰和气溶胶进行表征。波段 7-16 为发射性波段。亮度温度… abi atmosphere goes goes-17 goes-s mcmip -
GOES-18 FDCC 系列 ABI 2 级火点/热点特征 CONUS

Fire (HSC) 产品包含四张影像:一张是火点掩膜,另外三张的像素值分别表示火点温度、火点面积和火点辐射功率。ABI L2+ FHS 元数据掩模会为每个经过地球导航定位的像素分配一个标志,用于… abi fdc fire goes goes-18 goes-t -
GOES-18 FDCF 系列 ABI 2 级火点/热点特征全圆盘

Fire (HSC) 产品包含四张影像:一张是火点掩膜,另外三张的像素值分别表示火点温度、火点面积和火点辐射功率。ABI L2+ FHS 元数据掩模会为每个经过地球导航定位的像素分配一个标志,用于… abi fdc fire goes goes-18 goes-t -
GOES-18 MCMIPC 系列 ABI 2 级云和湿气图像(美国大陆)

云和湿气图像产品的分辨率均为 2 公里。波段 1-6 为反射性波段。无量纲的“反射因子”量会根据太阳天顶角进行归一化。这些波段支持对云、植被、雪/冰和气溶胶进行表征。波段 7-16 为发射性波段。亮度温度… abi atmosphere goes goes-18 goes-t goes-west -
GOES-18 MCMIPF 系列 ABI 2 级云和湿气图像全圆盘

云和湿气图像产品的分辨率均为 2 公里。波段 1-6 为反射性波段。无量纲的“反射因子”量会根据太阳天顶角进行归一化。这些波段支持对云、植被、雪/冰和气溶胶进行表征。波段 7-16 为发射性波段。亮度温度… abi atmosphere goes goes-18 goes-t goes-west -
GOES-18 MCMIPM 系列 ABI 2 级云和湿气图像中尺度
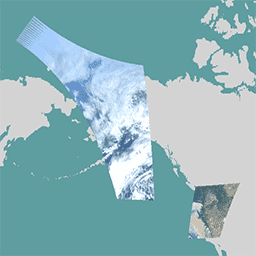
云和湿气图像产品的分辨率均为 2 公里。波段 1-6 为反射性波段。无量纲的“反射因子”量会根据太阳天顶角进行归一化。这些波段支持对云、植被、雪/冰和气溶胶进行表征。波段 7-16 为发射性波段。亮度温度… abi atmosphere goes goes-18 goes-t goes-west -
GOES-19 FDCC 系列 ABI 2 级火点/热点特征 CONUS
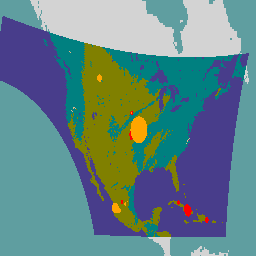
GOES 卫星是由 NOAA 运行的地球同步气象卫星。Fire (HSC) 产品包含四张影像:一张是火点掩膜,另外三张的像素值分别表示火点温度、火点面积和火点辐射功率。ABI L2+ FHS 元数据… abi fdc fire goes goes-19 goes-east -
GOES-19 FDCF 系列 ABI 2 级火点/热点特征全圆盘

Fire (HSC) 产品包含四张影像:一张是火点掩膜,另外三张的像素值分别表示火点温度、火点面积和火点辐射功率。ABI L2+ FHS 元数据掩模会为每个经过地球导航定位的像素分配一个标志,用于… abi fdc fire goes goes-19 goes-east -
GOES-19 MCMIPC 系列 ABI 2 级云和湿气图像 CONUS

云和湿气图像产品的分辨率均为 2 公里。波段 1-6 为反射性波段。无量纲的“反射因子”量会根据太阳天顶角进行归一化。这些波段支持对云、植被、雪/冰和气溶胶进行表征。波段 7-16 为发射性波段。亮度温度… abi atmosphere goes goes-19 goes-east goes-u -
GOES-19 MCMIPF 系列 ABI 2 级云和湿气图像全圆盘

云和湿气图像产品的分辨率均为 2 公里。波段 1-6 为反射性波段。无量纲的“反射因子”量会根据太阳天顶角进行归一化。这些波段支持对云、植被、雪/冰和气溶胶进行表征。波段 7-16 为发射性波段。亮度温度… abi atmosphere goes goes-19 goes-east goes-u -
GOES-19 MCMIPM 系列 ABI 2 级云和湿气图像中尺度

云和湿气图像产品的分辨率均为 2 公里。波段 1-6 为反射性波段。无量纲的“反射因子”量会根据太阳天顶角进行归一化。这些波段支持对云、植被、雪/冰和气溶胶进行表征。波段 7-16 为发射性波段。亮度温度… abi atmosphere goes goes-19 goes-east goes-u -
GPM:全球降水测量任务 (GPM) 版本 07

全球降水测量 (GPM) 是一项国际卫星任务,旨在每三小时提供一次全球范围内的雨雪观测数据,以实现下一代观测。Integrated Multi-satellitE Retrievals for GPM (IMERG) 是一种统一的算法,可提供降雨估计值,并将 GPM 中所有被动微波仪器的数据相结合… climate geophysical gpm imerg jaxa nasa -
GPM:每月全球降水测量 (GPM) v6

IMERG-Final 版本“06”已于 2021 年 9 月停止生成。版本“07”预计将于 2022 年 9 月发布全球降水测量 (GPM) 是一项国际卫星任务,旨在每三小时提供一次全球范围内的下一代雨雪观测数据。The Integrated Multi-satellitE Retrievals for … climate geophysical gpm imerg jaxa monthly -
GPM:每月全球降水测量 (GPM) vRelease 07

全球降水测量 (GPM) 是一项国际卫星任务,旨在每三小时提供一次全球范围内的雨雪观测数据,以实现下一代观测。Integrated Multi-satellitE Retrievals for GPM (IMERG) 是一种统一的算法,可提供降雨估计值,并将 GPM 中所有被动微波仪器的数据相结合… climate geophysical gpm imerg jaxa monthly -
GPW Annual Dominant Class of Grasslands v1

此数据集以 30 米的空间分辨率提供 2000 年至 2022 年的全球年度草地(耕种草地和天然/半天然草地)主要类别地图。该地图由 Land & Carbon Lab Global Pasture Watch 计划制作,其中显示的草地范围包括任何地表覆盖类型,只要其中包含至少 … 全球 全球牧场监测 土地 土地覆盖 土地利用 土地利用和土地覆盖 -
GPW 年耕地概率 v1

此数据集以 30 米的空间分辨率提供 2000 年至 2022 年的全球人工草地年度概率地图。此地图由 Land & Carbon Lab Global Pasture Watch 计划制作,其中显示的草地范围包括任何土地覆盖类型,只要其中包含至少 30% 的干… 全球 全球牧场监测 土地 土地覆盖 土地利用 土地利用和土地覆盖 -
GPW 天然/半天然草地的年概率 v1

此数据集提供 2000 年至 2022 年全球天然/半天然草地的年度概率地图,空间分辨率为 30 米。此地图由 Land & Carbon Lab Global Pasture Watch 计划制作,其中显示的草地范围包括任何土地覆盖类型,只要其中包含至少 30% 的干… 全球 全球牧场监测 土地 土地覆盖 土地利用 土地利用和土地覆盖 -
GPW 年短植被高度 v1

此数据集提供 2000 年以来的全球植被高度中位数,空间分辨率为 30 米。该数据集由 Land & Carbon Lab 的 Global Pasture Watch 计划生成,提供自 2000 年以来全球 30 米空间分辨率的中值植被高度值(第 50 百分位)。该数据集基于… 冠层 全球 全球牧场监测 土地 土地覆盖 植物生产力 -
GPW Annual uncalibrated Gross Primary Productivity (uGPP) v1

此数据集提供 2000 年以来基于 EO 的全球未校准总初级生产力,空间分辨率为 30 米。当前数据集由 Land & Carbon Lab Global Pasture Watch 计划生成,提供自 2000 年以来全球范围内的总初级生产力 (GPP) 值,空间分辨率为 30 米。GPP 值… 全球 global-pasture-watch land landcover landuse plant-productivity -
GPWv411:根据联合国 2015 年修订版 WPP 国家/地区总数进行了调整(世界网格化人口版本 4.11)

此数据集包含每 30 角秒网格单元的人数估计值,这些估计值在相对空间分布方面与国家人口普查和人口登记数据保持一致,但经过调整,以符合联合国《2015 年世界人口展望》修订版中的国家/地区总人口数。有一张图片… ciesin gpw nasa population -
GPWv411:基本人口特征(世界网格化人口第 4.11 版)

此数据集包含与国家人口普查和人口登记数据一致的按年龄和性别划分的人口估计数据,以 30 角秒网格单元为单位。每个基于 2010 年人口普查的年龄和性别类别都有一张图片。一般文档“The Gridded Population of … ciesin gpw nasa population -
GPWv411:数据背景信息(世界网格化人口第 4.11 版)
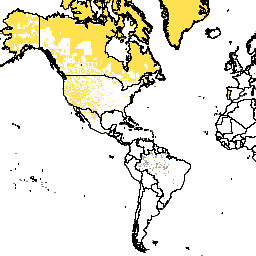
此数据集根据普查文件中提供的信息,对估计人口为零的像素进行分类。一般文档“世界网格化人口”第 4 版 (GPWv4) 修订版 11 针对 2000 年、2005 年、2010 年、2015 年和 2020 年的全球人口分布进行了建模,… ciesin gpw nasa population -
GPWv411:陆地面积(世界网格化人口第 4.11 版)

此数据集包含每个像素内陆地(不包括永久性冰和水)的估计地表面积(以平方公里为单位),用于计算 GPW v4.11 人口密度数据集。一般文档“全球网格化人口版本 4 (GPWv4)”,… ciesin gpw nasa population -
GPWv411:平均行政单位面积(世界网格化人口第 4.11 版)

此数据集包含用于创建人口数量和密度网格的输入单位的平均面积。一般文档“世界网格化人口版本 4 (GPWv4) 修订版 11”对 2000 年、2005 年、2010 年、2015 年等年份的全球人口分布进行了建模。 ciesin gpw nasa population -
GPWv411:国家级网格人口数据(世界网格人口数据第 4.11 版)

此数据集表示用于生成 GPW v4.11 人口估计值的普查数据源。具有相同值的像素表示相同的数据源,通常是国家或地区。一般文档“世界网格化人口第 4 版 (GPWv4),修订版 11”模型… ciesin gpw nasa population -
GPWv411:人口数(世界网格化人口第 4.11 版)

此数据集包含与国家人口普查和人口登记数据一致的每 30 角秒网格单元的人数估计值。每个建模年份都有一张图片。一般文档说明:由于此集合具有 MEAN 金字塔政策,因此缩小会导致… ciesin gpw nasa population -
GPWv411:人口密度(世界网格化人口第 4.11 版)
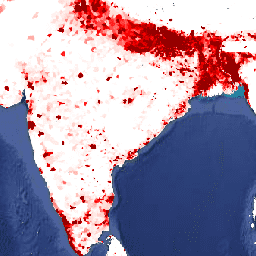
此数据集包含与国家人口普查和人口登记数据一致的每平方公里人口数估计值。每个建模年份都有一张图片。General Documentation The Gridded Population of World Version 4 (GPWv4), Revision 11 models the distribution of global human … ciesin gpw nasa population -
GPWv411:未经联合国调整的人口密度(世界网格化人口第 4.11 版)

此数据集包含每 30 角秒网格单元的人数估计值,这些估计值在相对空间分布方面与国家人口普查和人口登记数据保持一致,但经过调整,以符合联合国《2015 年世界人口展望》修订版中的国家/地区总人口数。有一张图片… ciesin gpw nasa population -
GPWv411:水域(世界网格化人口 4.11 版)

此数据集包含每个像素内的水域(永久性冰和水)估计值,用于计算 GPW v4.11 人口密度数据集。一般文档“世界网格化人口第 4 版 (GPWv4) 修订版 11”对全球人口分布进行了建模… ciesin gpw nasa population surface-ground-water -
GPWv411:水掩码(世界网格化人口第 4.11 版)

此数据集用于识别水像素,非水像素会被遮盖。用水掩码从人口分配中排除水域和永久性冰川区域。一般文档“世界网格化人口第 4 版 (GPWv4) 修订版 11”对全球人口分布进行了建模… ciesin gpw nasa population surface-ground-water -
GRACE 月度质量网格 - 海洋 EOFR
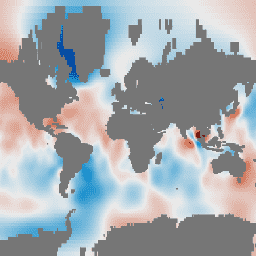
GRACE Tellus Monthly Mass Grids 提供相对于 2004-2010 年时间平均基准的月度重力异常。此数据集中的数据以“等效水厚度”为单位,表示质量偏差(以厘米为单位的水垂直范围)。请参阅提供商的… crs gfz grace gravity jpl mass -
GRACE 月度质量网格版本 06 版本 04 - 陆地

月度陆地网格包含水质量异常,以等效水厚度表示,该厚度是根据指定时间跨度内 GRACE 和 GRACE-FO 时变重力观测结果得出的,并且相对于指定的时间平均参考周期。等效水厚度表示陆地总储水异常… crs gfz grace gravity jpl land -
GRACE 月度质量网格版本 06 版本 04 - 海洋
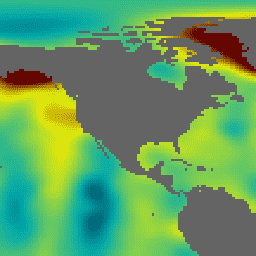
GRACE Tellus Monthly Mass Grids 提供相对于 2004-2010 年时间平均基准的月度重力异常。此数据集中的数据以“等效水厚度”为单位,表示质量偏差(以厘米为单位的水垂直范围)。请参阅提供商的… crs gfz grace gravity jpl mass -
GRACE 月度质量网格版本 6.3 版本 4 - 全球 Mascon

此数据集包含网格化月度全球蓄水/高度异常值(相对于时间平均值),这些数据源自 GRACE 和 GRACE-FO,并由 JPL 使用 Mascon 方法 (RL06.3Mv04) 进行处理。这些数据以 netCDF 格式的单个数据文件提供,可用于分析… grace 重力 jpl mascon 质量 nasa -
GRACE 月度质量网格版本 04 - 全球 Mascon(CRI 过滤)

此数据集包含网格化月度全球蓄水/高度异常值(相对于时间平均值),这些数据源自 GRACE 和 GRACE-FO,并由 JPL 使用 Mascon 方法 (RL06.3Mv04) 进行处理。这些数据以 netCDF 格式的单个数据文件提供,可用于分析… grace 重力 jpl mascon 质量 nasa -
GRIDMET 干旱:美国本土干旱指数

此数据集包含从 4 公里网格化地面气象 (GRIDMET) 日数据集中派生的干旱指数。提供的干旱指数包括标准化降水指数 (SPI)、蒸发干旱需求指数 (EDDI)、标准化降水蒸散指数 (SPEI)、帕默干旱严重程度指数 (PDSI) 和帕默… 气候 conus 作物 干旱 蒸发蒸腾 地球物理 -
GRIDMET:爱达荷大学网格化地面气象数据集

网格化地面气象数据集提供美国本土自 1979 年以来高空间分辨率(约 4 公里)的每日地面温度、降水、风、湿度和辐射场数据。该数据集将 PRISM 的高分辨率空间数据与…的高时间分辨率数据相融合 climate gridmet humidity merced metdata precipitation -
GSMaP Operational:全球降水卫星地图 - V6

全球降水卫星地图 (GSMaP) 提供全球每小时降雨率,分辨率为 0.1 x 0.1 度。GSMaP 是全球降水测量 (GPM) 任务的产品,可提供每隔 3 小时的全球降水观测数据。这些值是使用多频段被动 … 估算的 气候 地球物理 gpm 每小时 jaxa 降水 -
GSMaP 运行版:全球降水卫星地图 - V7

全球降水卫星地图 (GSMaP) 提供全球每小时降雨率,分辨率为 0.1 x 0.1 度。GSMaP 是全球降水测量 (GPM) 任务的产品,可提供每隔 3 小时的全球降水观测数据。这些值是使用多频段被动 … 估算的 气候 地球物理 gpm 每小时 jaxa 降水 -
GSMaP 运行:全球降水卫星地图 - V8

全球降水卫星地图 (GSMaP) 提供全球每小时降雨率,分辨率为 0.1 x 0.1 度。GSMaP 是全球降水测量 (GPM) 任务的产品,可提供每隔 3 小时的全球降水观测数据。这些值是使用多频段被动 … 估算的 气候 地球物理 gpm 每小时 jaxa 降水 -
GSMaP 再分析:全球降水卫星地图

全球降水卫星地图 (GSMaP) 提供全球每小时降雨率,分辨率为 0.1 x 0.1 度。GSMaP 是全球降水测量 (GPM) 任务的产品,可提供每隔 3 小时的全球降水观测数据。这些值是使用多频段被动 … 估算的 气候 地球物理 gpm 每小时 jaxa 降水 -
GTOPO30:全球 30 角秒高程

GTOPO30 是一种全球数字高程模型 (DEM),水平网格间距为 30 角秒(约 1 公里)。DEM 源自多个地形信息栅格和矢量源。GTOPO30 于 1996 年末完成,历时三年开发而成,… dem 海拔 海拔-地形 地球物理 nasa 地形 -
GlobCover:全球土地覆盖地图

GlobCover 2009 是一张全球土地覆被地图,基于 ENVISAT 的中分辨率成像光谱仪 (MERIS) 在全分辨率模式下采集的 1B 级数据,空间分辨率约为 300 米。 esa landcover landuse-landcover -
基于 MCD64A1 的 GlobFire 每日火灾事件检测

基于 MODIS 数据集 MCD64A1 的火灾边界。这些数据是根据一种算法计算得出的,该算法依赖于在图结构中对烧毁区域斑块之间的时空关系进行编码。每起火灾都有一个唯一编号来标识相应事件。 area burnt disaster fire globfire mcd64a1 -
基于 MCD64A1 的 GlobFire 最终火灾事件检测

基于 MODIS 数据集 MCD64A1 的火灾边界。这些数据是根据一种算法计算得出的,该算法依赖于在图结构中对烧毁区域斑块之间的时空关系进行编码。每起火灾都有一个唯一编号来标识相应事件。 area burnt disaster fire globfire mcd64a1 -
全球 2020 年森林分类(IPCC 地上生物质第 1 级估计值),版本 1

此数据集提供 2020 年按状态/条件划分的全球森林类别,分辨率约为 30 米。这些数据有助于根据 2019 年修订版《2006 年 IPCC 国家温室气体清单指南》生成天然林地上干木质生物质密度 (AGBD) 的 1 级估计值。 地上 生物质 碳 分类 森林 森林生物质 -
全球三类 PALSAR-2/PALSAR 森林/非森林地图
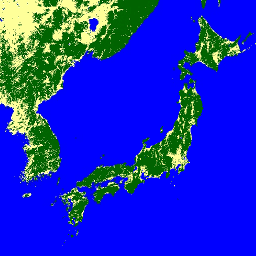
您可以在 JAXA/ALOS/PALSAR/YEARLY/FNF4 中找到此数据集的更新版本,其中包含 2017 年至 2020 年的 4 个类别。全球森林/非森林地图 (FNF) 是通过对全球 25 米分辨率 PALSAR-2/PALSAR SAR 镶嵌中的 SAR 图像(后向散射系数)进行分类而生成的,因此强后向散射像素和低后向散射像素… ALOS alos2 分类 eroc 森林 森林生物质 -
全球 4 类 PALSAR-2/PALSAR 森林/非森林地图

全球森林/非森林 (FNF) 地图是通过对全球 25 米分辨率 PALSAR-2/PALSAR SAR 镶嵌图中的 SAR 图像(后向散射系数)进行分类而生成的,以便将强后向散射像素和低后向散射像素分别指定为“森林”和“非森林”。其中,“森林”是指具有以下特征的天然森林… ALOS alos2 分类 eroc 森林 森林生物质 -
全球 ALOS CHILI(连续热能-日照负荷指数)

CHILI 是日照和地形阴影对蒸散影响的替代变量,通过计算初午时(即太阳高度角相当于春分时)的日照来表示。该数据集基于 JAXA 的 ALOS DEM(在 EE 中以 JAXA/ALOS/AW3D30_V1_1 的形式提供)的 30 米“AVE”波段。保护科学… 坡向 csp 海拔 海拔-地形 ergo 地球物理 -
全球 ALOS 地貌

ALOS 地貌数据集通过组合连续热日照负荷指数 (ALOS CHILI) 和多尺度地形位置指数 (ALOS mTPI) 数据集来提供地貌类别。该数据集基于 JAXA 的 ALOS DEM(在 EE 中以 JAXA/ALOS/AW3D30_V1_1 的形式提供)的 30 米“AVE”波段。保护… 坡向 csp 海拔 海拔-地形 ergo 地球物理 -
全球 ALOS 地形多样性

地形多样性 (D) 是一个替代变量,表示物种作为当地栖息地可获得的温度和湿度条件的多样性。它表达了这样一种逻辑:更多样的地形气候生态位应支持更高的多样性(尤其是植物),并支持物种在气候变化下的持续存在… 坡向 csp 海拔 海拔-地形 ergo 地球物理 -
全球 ALOS mTPI(多尺度地形位置指数)

mTPI 可区分山脊地形和山谷地形。它是通过从每个位置的海拔数据中减去邻域内的平均海拔来计算的。mTPI 使用半径(公里)为 115.8、89.9、35.5、13.1、5.6、2.8 和 1.2 的移动窗口。它基于 30 分钟… 坡向 csp 海拔 海拔-地形 ergo 地球物理 -
全球地上和地下生物质碳密度地图

此数据集提供 2010 年地上和地下生物质碳密度的时态一致且协调的全球地图,空间分辨率为 300 米。地上生物量地图整合了木本、草地、农田和苔原生物量的特定地表覆盖遥感地图。输入源映射为… 地上 生物质 碳 密度 森林 森林生物质 -
全球洪水数据库 v1(2000 年至 2018 年)

全球洪涝数据库包含 2000 年至 2018 年间发生的 913 次洪涝事件的范围和时间分布地图。如需了解详情,请参阅相关期刊文章。洪水事件是从达特茅斯洪水观测站收集的,用于收集 MODIS 影像。所选 913 … 洪水 地表水 地表水-地下水 水 -
全球森林冠层高度,2005 年

此数据集表示全球树高,基于地球科学激光测高仪系统 (GLAS) 的机载激光雷达数据 (2005) 和辅助地理空间数据融合而成。如需了解详情,请参阅 Simard 等人 (2011)。 冠层 森林 森林生物质 地球物理 jpl NASA -
全球森林覆盖变化 (GFCC) 多年全球树木覆盖率(30 米)

Landsat 植被连续场 (VCF) 树木覆盖层包含对每个 30 米像素中被高度超过 5 米的木本植被覆盖的水平地面百分比的估计值。该数据集包含 4 个以 2000 年、2005 年、2010 年为中心的时间段的数据… 森林 森林生物质 glcf Landsat 衍生数据 NASA UMD -
全球红树林分布,版本 1(2000 年)

该数据库是使用 2000 年的 Landsat 卫星数据准备的。使用混合监督式和非监督式数字图像分类技术对从 USGS 地球资源观测与科学中心 (EROS) 获取的 1,000 多个 Landsat 场景进行了分类。此数据库是第一个也是最… 年度 CIESIN 森林生物质 全球 Landsat 衍生 红树林 -
全球油棕榈种植园地图

该数据集是 2019 年全球工业和小农户油棕榈地图,分辨率为 10 米。它涵盖了检测到油棕榈种植园的区域。分类后的图片是基于 Sentinel-1 和 Sentinel-2 半年合成数据的卷积神经网络的输出。如需了解更多…,请参阅相关文章 农业 生物多样性 保护 作物 全球 土地利用 -
全球海洋颜色:生物地球化学,L4,来自卫星观测、光学、多传感器 4KM

全球海洋水色 (Copernicus-GlobColour) 数据集是由 ACRI-ST 开发的生物地球化学 (BGC) 产品。该数据集源自 SeaWiFS、MODIS 和 OLCI 等多个卫星来源。它提供全面的海洋学变量,包括:叶绿素 (CHL)、浮游植物功能类型和大小 (PFT)、初级生产力 (PP)、悬浮… 哥白尼 海洋 大洋 -
全球海洋颜色:生物地球化学,L4,来自卫星观测,浮游生物,多传感器,4KM

全球海洋水色 (Copernicus-GlobColour) 数据集是由 ACRI-ST 开发的生物地球化学 (BGC) 产品。该数据集源自 SeaWiFS、MODIS 和 OLCI 等多个卫星来源。它提供全面的海洋学变量,包括:叶绿素 (CHL)、浮游植物功能类型和大小 (PFT)、初级生产力 (PP)、悬浮… 哥白尼 海洋 大洋 -
全球海洋水色:生物地球化学,L4,来自卫星观测数据,浮游生物,OLCI,300 米

全球海洋水色 (Copernicus-GlobColour) 数据集是由 ACRI-ST 开发的生物地球化学 (BGC) 产品。该数据集源自 SeaWiFS、MODIS 和 OLCI 等多个卫星来源。它提供全面的海洋学变量,包括:叶绿素 (CHL)、浮游植物功能类型和大小 (PFT)、初级生产力 (PP)、悬浮… 哥白尼 海洋 大洋 -
全球海洋水色:生物地球化学,L4,基于卫星观测,初级生产力,多传感器 4KM

全球海洋水色 (Copernicus-GlobColour) 数据集是由 ACRI-ST 开发的生物地球化学 (BGC) 产品。该数据集源自 SeaWiFS、MODIS 和 OLCI 等多个卫星来源。它提供全面的海洋学变量,包括:叶绿素 (CHL)、浮游植物功能类型和大小 (PFT)、初级生产力 (PP)、悬浮… 哥白尼 海洋 大洋 -
全球海洋颜色:生物地球化学,L4,来自卫星观测,反射率,多传感器 4KM

全球海洋水色 (Copernicus-GlobColour) 数据集是由 ACRI-ST 开发的生物地球化学 (BGC) 产品。该数据集源自 SeaWiFS、MODIS 和 OLCI 等多个卫星来源。它提供全面的海洋学变量,包括:叶绿素 (CHL)、浮游植物功能类型和大小 (PFT)、初级生产力 (PP)、悬浮… 哥白尼 海洋 大洋 -
全球海洋水色:生物地球化学,L4,基于卫星观测数据,反射率,OLCI 300M
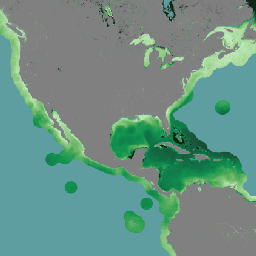
全球海洋水色 (Copernicus-GlobColour) 数据集是由 ACRI-ST 开发的生物地球化学 (BGC) 产品。该数据集源自 SeaWiFS、MODIS 和 OLCI 等多个卫星来源。它提供全面的海洋学变量,包括:叶绿素 (CHL)、浮游植物功能类型和大小 (PFT)、初级生产力 (PP)、悬浮… 哥白尼 海洋 大洋 -
全球海洋颜色:生物地球化学,L4,来自卫星观测,透明度,多传感器,4KM

全球海洋水色 (Copernicus-GlobColour) 数据集是由 ACRI-ST 开发的生物地球化学 (BGC) 产品。该数据集源自 SeaWiFS、MODIS 和 OLCI 等多个卫星来源。它提供全面的海洋学变量,包括:叶绿素 (CHL)、浮游植物功能类型和大小 (PFT)、初级生产力 (PP)、悬浮… 哥白尼 海洋 大洋 -
全球海洋颜色:生物地球化学,L4,来自卫星观测,透明度,OLCI,4KM

全球海洋水色 (Copernicus-GlobColour) 数据集是由 ACRI-ST 开发的生物地球化学 (BGC) 产品。该数据集源自 SeaWiFS、MODIS 和 OLCI 等多个卫星来源。它提供全面的海洋学变量,包括:叶绿素 (CHL)、浮游植物功能类型和大小 (PFT)、初级生产力 (PP)、悬浮… 哥白尼 海洋 大洋 -
全球海洋物理分析和预报(每日)
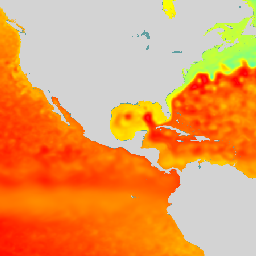
“哥白尼海洋物理学 2D 日平均场”(cmems_mod_glo_phy_anfc_0.083deg_P1D-m) 以 8 公里分辨率提供全球日平均海洋表面和底部变量。Operational Mercator 全球海洋分析和预报系统每天都会更新 10 天的 2D 全球海洋预报。时间序列在以下方面进行了汇总… 哥白尼 每日 预报 海洋 大洋 -
全球海浪分析和预报

Meteo-France 的业务性全球海洋分析和预报系统分辨率为 1/12 度,可提供全球海洋海面波浪的每日分析和 10 天预报。此产品包含总频谱中积分海浪参数的 3 小时瞬时场… 哥白尼 预报 每小时 海洋 大洋 -
全球海洋波浪静态水深测量数据

全球海洋波浪分析和预报系统的静态水深数据。此数据集提供以米为单位的海底深度。Meteo-France 的全球波浪系统基于 MFWAM 波浪模型,该模型属于第三代波浪模型。MFWAM 使用计算代码 … 测深 哥白尼 海洋 大洋 -
全球 PALSAR-2/PALSAR 年度镶嵌图,版本 1
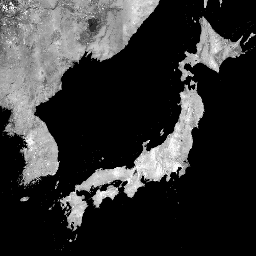
您可以在 JAXA/ALOS/PALSAR/YEARLY/SAR_EPOCH 中找到包含 2015 年至 2021 年数据的此数据集的较新版本。全球 25 米 PALSAR/PALSAR-2 镶嵌图是通过将 PALSAR/PALSAR-2 的条带状 SAR 图像镶嵌在一起而创建的无缝全球 SAR 图像。对于每个年份和位置,我们选择了条带数据… alos alos2 eroc jaxa palsar palsar2 -
全球 PALSAR-2/PALSAR 年度镶嵌图,版本 2.5.0

全球 25 米 PALSAR/PALSAR-2 镶嵌图是一张无缝的全球 SAR 图像,通过将 PALSAR/PALSAR-2 的条带状 SAR 图像镶嵌在一起而创建。对于每个年份和位置,条带数据是通过对相应时间段内可用的浏览镶嵌图进行目视检查来选择的,选择那些显示最小 … alos alos2 eroc jaxa palsar palsar2 -
全球发电厂数据库

Global Power Plant Database 是一个全面的开源数据库,其中包含世界各地的发电厂信息。它集中了发电厂数据,以便用户更轻松地浏览、比较和获取数据洞见。每个发电厂都有地理位置信息,条目包含有关发电厂容量、发电量等信息。 infrastructure-boundaries 表格 wri -
全球 SRTM CHILI(连续热能-日照负荷指数)

CHILI 是日照和地形阴影对蒸散影响的替代变量,通过计算初午时(即太阳高度角相当于春分时)的日照来表示。它基于 30 米 SRTM DEM(在 EE 中以 USGS/SRTMGL1_003 的形式提供)。Conservation Science Partners (CSP) Ecologically Relevant … 坡向 csp 海拔 海拔-地形 ergo 地球物理 -
全球 SRTM 地貌

SRTM 地貌数据集提供通过组合连续热日照负荷指数 (SRTM CHILI) 和多尺度地形位置指数 (SRTM mTPI) 数据集创建的地貌类别。它基于 30 米 SRTM DEM(在 EE 中以 USGS/SRTMGL1_003 的形式提供)。The Conservation Science Partners (CSP) Ecologically … 坡向 csp 海拔 海拔-地形 ergo 地球物理 -
全球 SRTM 地形多样性

地形多样性 (D) 是一个替代变量,表示物种作为当地栖息地可获得的温度和湿度条件的多样性。它表达了这样一种逻辑:更多样的地形气候生态位应支持更高的多样性(尤其是植物),并支持物种在气候变化下的持续存在… 坡向 csp 海拔 海拔-地形 ergo 地球物理 -
全球 SRTM mTPI(多尺度地形位置指数)

mTPI 可区分山脊地形和山谷地形。它是通过从每个位置的海拔数据中减去邻域内的平均海拔来计算的。mTPI 使用半径(公里)为 115.8、89.9、35.5、13.1、5.6、2.8 和 1.2 的移动窗口。它基于 30 分钟… 坡向 csp 海拔 海拔-地形 ergo 地球物理 -
全球季节性 Sentinel-1 干涉相干性和后向散射 V2019 后向散射

该数据集是首个此类空间表示法,可呈现多季节全球 C 波段合成孔径雷达 (SAR) 干涉重复通过相干性和后向散射特征。覆盖范围包括从北纬 82 度到南纬 79 度的陆地和冰盖。该数据集源自多时相… backscatter earth-big-data jpl nasa polarization radar -
全球季节性 Sentinel-1 干涉相干性和后向散射 V2019 相干性

该数据集是首个此类空间表示法,可呈现多季节全球 C 波段合成孔径雷达 (SAR) 干涉重复通过相干性和后向散射特征。覆盖范围包括从北纬 82 度到南纬 79 度的陆地和冰盖。该数据集源自多时相… earth-big-data jpl nasa polarization radar sar -
全球季节性 Sentinel-1 干涉相干性和后向散射 V2019 衰减模型参数

该数据集是首个此类空间表示法,可呈现多季节全球 C 波段合成孔径雷达 (SAR) 干涉重复通过相干性和后向散射特征。覆盖范围包括从北纬 82 度到南纬 79 度的陆地和冰盖。该数据集源自多时相… earth-big-data jpl nasa polarization radar sar -
全球季节性 Sentinel-1 干涉相干性和后向散射 V2019 入射叠掩阴影

该数据集是首个此类空间表示法,可呈现多季节全球 C 波段合成孔径雷达 (SAR) 干涉重复通过相干性和后向散射特征。覆盖范围包括从北纬 82 度到南纬 79 度的陆地和冰盖。该数据集源自多时相… earth-big-data jpl nasa polarization radar sar -
局地气候带全球地图,最新版本

自 2012 年推出局地气候带 (LCZ) 以来,其已成为表征城市景观的新标准,提供了一种综合考虑微观尺度土地覆盖及相关物理属性的整体分类方法。这份全球局地气候带地图代表 2018 基准年,像元大小为 100m … climate landcover landuse-landcover urban -
Google 基于 Landsat 的全球 CCDC 分段(1999 年至 2019 年)

此集合包含对 20 年的 Landsat 地表反射率数据运行连续变化检测和分类 (CCDC) 算法后预先计算的结果。CCDC 是一种断点查找算法,它使用谐波拟合和动态 RMSE 阈值来检测时间序列数据中的断点。… change-detection google landcover landsat-derived landuse landuse-landcover -
Google 街景空气质量:加利福尼亚州高分辨率空气污染地图

此大型矢量数据集包含 2015 年 6 月至 2019 年 6 月期间加利福尼亚州 NO、NO2、O3、CH4、CO2、BC、PN2.5 和 UFP 浓度的高分辨率空气污染地图。该数据集包含使用四辆配备了 Aclima … 的 Google 街景拍摄车收集的测量数据 air-quality atmosphere nitrogen-dioxide pollution table -
格陵兰 DEM - 格陵兰测绘项目 (GIMP)
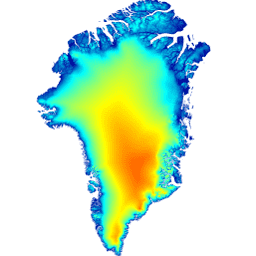
此数字高程模型 (DEM) 是由 ASTER 和 SPOT-5 DEM 组合而成,用于表示大约 82.5°N 以南的冰盖外围和边缘(即低于平衡线高程)以及冰盖内部和极北地区的 AVHRR 光度测斜术(Scambos 和 … 北极 海拔地形 GIMP 格陵兰 NASA 极地 -
格陵兰冰与海洋掩码 - 格陵兰测绘项目 (GIMP)

此数据集提供了格陵兰冰盖的完整陆地冰和海洋分类掩码(分辨率为 15 米)。冰盖是使用以下影像的组合进行测绘的:USGS 分发的 Landsat 7 Enhanced Thematic Mapper Plus (ETM+) 的正射校正全色(波段 8)影像,以及… 北极 冰冻圈 gimp 格陵兰 冰 nasa -
网格化 GEDI 植被结构指标和生物质密度(包含 COUNTS 指标),像素大小为 12 公里

此数据集包含近乎全球范围、可直接用于分析的多分辨率网格化植被结构指标,这些指标源自 NASA 全球生态系统动态调查 (GEDI) 2 级和 4A 级产品,与直径为 25 米的激光雷达足迹相关联。此数据集全面展示了近乎全球的植被结构,包括… 生物质 冠层 森林 森林生物质 GEDI LARSE -
网格化 GEDI 植被结构指标和生物质密度(包含 COUNTS 指标),像素大小为 1 公里

此数据集包含近乎全球范围、可直接用于分析的多分辨率网格化植被结构指标,这些指标源自 NASA 全球生态系统动态调查 (GEDI) 2 级和 4A 级产品,与直径为 25 米的激光雷达足迹相关联。此数据集全面展示了近乎全球的植被结构,包括… 生物质 冠层 森林 森林生物质 GEDI LARSE -
网格化 GEDI 植被结构指标和生物质密度(包含 COUNTS 指标),像素大小为 6 公里

此数据集包含近乎全球范围、可直接用于分析的多分辨率网格化植被结构指标,这些指标源自 NASA 全球生态系统动态调查 (GEDI) 2 级和 4A 级产品,与直径为 25 米的激光雷达足迹相关联。此数据集全面展示了近乎全球的植被结构,包括… 生物质 冠层 森林 森林生物质 GEDI LARSE -
网格化 GEDI 植被结构指标和生物质密度,像素大小为 12 公里

此数据集包含近乎全球范围、可直接用于分析的多分辨率网格化植被结构指标,这些指标源自 NASA 全球生态系统动态调查 (GEDI) 2 级和 4A 级产品,与直径为 25 米的激光雷达足迹相关联。此数据集全面展示了近乎全球的植被结构,包括… 生物质 冠层 森林 森林生物质 GEDI LARSE -
网格化 GEDI 植被结构指标和生物质密度,1KM 像素大小

此数据集包含近乎全球范围、可直接用于分析的多分辨率网格化植被结构指标,这些指标源自 NASA 全球生态系统动态调查 (GEDI) 2 级和 4A 级产品,与直径为 25 米的激光雷达足迹相关联。此数据集全面展示了近乎全球的植被结构,包括… 生物质 冠层 森林 森林生物质 GEDI LARSE -
网格化 GEDI 植被结构指标和生物质密度,像素大小为 6 公里

此数据集包含近乎全球范围、可直接用于分析的多分辨率网格化植被结构指标,这些指标源自 NASA 全球生态系统动态调查 (GEDI) 2 级和 4A 级产品,与直径为 25 米的激光雷达足迹相关联。此数据集全面展示了近乎全球的植被结构,包括… 生物质 冠层 森林 森林生物质 GEDI LARSE -
HLSL30:HLS-2 Landsat Operational Land Imager Surface Reflectance and TOA Brightness Daily Global 30m

Harmonized Landsat Sentinel-2 (HLS) 项目通过虚拟的卫星传感器星座提供一致的地表反射率 (SR) 和大气层顶 (TOA) 亮度数据。Operational Land Imager (OLI) 搭载在 NASA/USGS 联合的 Landsat 8 和 Landsat 9 卫星上,而 Multi-Spectral … 陆地卫星 nasa 卫星影像 哨兵 usgs -
HLSS30:HLS Sentinel-2 多光谱仪地表反射率每日全球 30 米

Harmonized Landsat Sentinel-2 (HLS) 项目可提供一致的地表反射率数据,这些数据来自 NASA/USGS 联合 Landsat 8 卫星上的 Operational Land Imager (OLI) 和欧洲哥白尼 Sentinel-2A 卫星上的 Multi-Spectral Instrument (MSI)。通过综合测量,每 2-3 天即可对全球陆地进行一次观测… 陆地卫星 nasa 卫星影像 哨兵 usgs -
HUC02:美国地质调查局的流域边界数据集(区域)

流域边界数据集 (WBD) 是一套全面的水文单元 (HU) 汇总数据,符合国家级划界和分辨率标准。它定义了地表水排入某一点的面积范围,但在沿海或湖滨地区,… 水文 地表水和地下水 表格 美国地质调查局 水 流域 -
HUC04:美国地质调查局子区域分水岭边界数据集
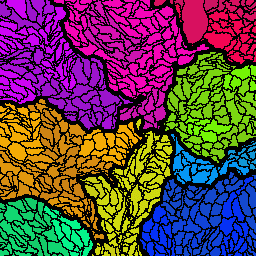
流域边界数据集 (WBD) 是一套全面的水文单元 (HU) 汇总数据,符合国家级划界和分辨率标准。它定义了地表水排入某一点的面积范围,但在沿海或湖滨地区,… 水文 地表水和地下水 表格 美国地质调查局 水 流域 -
HUC06:USGS 流域边界数据集(流域)

流域边界数据集 (WBD) 是一套全面的水文单元 (HU) 汇总数据,符合国家级划界和分辨率标准。它定义了地表水排入某一点的面积范围,但在沿海或湖滨地区,… 水文 地表水和地下水 表格 美国地质调查局 水 流域 -
HUC08:USGS 子流域流域边界数据集

流域边界数据集 (WBD) 是一套全面的水文单元 (HU) 汇总数据,符合国家级划界和分辨率标准。它定义了地表水排入某一点的面积范围,但在沿海或湖滨地区,… 水文 地表水和地下水 表格 美国地质调查局 水 流域 -
HUC10:USGS 流域边界数据集

流域边界数据集 (WBD) 是一套全面的水文单元 (HU) 汇总数据,符合国家级划界和分辨率标准。它定义了地表水排入某一点的面积范围,但在沿海或湖滨地区,… 水文 地表水和地下水 表格 美国地质调查局 水 流域 -
HUC12:USGS 子流域流域边界数据集

流域边界数据集 (WBD) 是一套全面的水文单元 (HU) 汇总数据,符合国家级划界和分辨率标准。它定义了地表水排入某一点的面积范围,但在沿海或湖滨地区,… 水文 地表水和地下水 表格 美国地质调查局 水 流域 -
HYCOM:混合坐标海洋模型,海平面高度
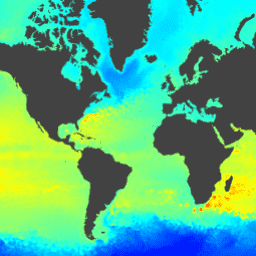
混合坐标海洋模型 (HYCOM) 是一种数据同化混合等密度面-sigma-压力(广义)坐标海洋模型。托管在 EE 中的 HYCOM 数据子集包含盐度、温度、速度和海拔高度变量。它们已插值到 80.48°S 和 … 之间均匀的 0.08 度纬度/经度网格中 海拔 HYCOM NPP 海洋 大洋 水 -
HYCOM:混合坐标海洋模型,水温和盐度

混合坐标海洋模型 (HYCOM) 是一种数据同化混合等密度面-sigma-压力(广义)坐标海洋模型。托管在 EE 中的 HYCOM 数据子集包含盐度、温度、速度和海拔高度变量。它们已插值到 80.48°S 和 … 之间均匀的 0.08 度纬度/经度网格中 hycom nopp ocean oceans sst water -
HYCOM:混合坐标海洋模型,水流速度

混合坐标海洋模型 (HYCOM) 是一种数据同化混合等密度面-sigma-压力(广义)坐标海洋模型。托管在 EE 中的 HYCOM 数据子集包含盐度、温度、速度和海拔高度变量。它们已插值到 80.48°S 和 … 之间均匀的 0.08 度纬度/经度网格中 hycom nopp ocean oceans velocity water -
Hansen 全球森林变化 v1.12(2000-2024 年)

通过对 Landsat 图像进行时间序列分析,表征全球森林范围和变化。“first”和“last”波段是参考多光谱影像,分别来自 Landsat 光谱波段(对应于红光、近红外、短波红外 1 和短波红外 2)的第一个和最后一个可用年份。参考合成影像表示… 森林 森林生物质 地球物理 Landsat 衍生 UMD -
Harmonized Sentinel-2 MSI:多光谱成像仪,Level-1C (TOA)

2022 年 1 月 25 日之后,PROCESSING_BASELINE 为 '04.00' 或更高的 Sentinel-2 场景的 DN(值)范围会偏移 1000。HARMONIZED 集合会将新场景中的数据移至与旧场景相同的范围内。Sentinel-2 是一项宽幅、高分辨率、多光谱成像任务,可为哥白尼… 哥白尼 欧洲航天局 欧盟 多光谱成像仪 辐射 卫星图像 -
Harmonized Sentinel-2 MSI:多光谱成像仪,2 级 A (SR)
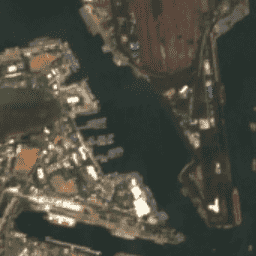
2022 年 1 月 25 日之后,PROCESSING_BASELINE 为 '04.00' 或更高的 Sentinel-2 场景的 DN(值)范围会偏移 1000。HARMONIZED 集合会将新场景中的数据移至与旧场景相同的范围内。Sentinel-2 是一项宽幅、高分辨率、多光谱成像任务,可为哥白尼… copernicus esa eu msi reflectance satellite-imagery -
IPCC AR6 海平面预测(区域性,中等置信度)

IPCC 提供的数据集包含 IPCC 第六次评估报告 (AR6) 中全面的全球和区域海平面预测数据。此集合包含中等置信度海平面上升预测的资源。该数据集涵盖 2020 年至 2150 年,包含各种…的预测数据 ipcc ocean oceans -
IUCN 全球生态系统类型学第 3 级:1.0
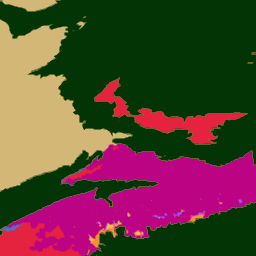
全球生态系统类型学是一种基于生态系统独特特征的生态系统分类法。它是一个全球分类系统,可为描述和分类生态系统提供一致的框架。全球生态系统类型学有六个级别。前三个级别(界、功能性生物群系、… 生态系统 生态系统 全球 表格 -
International Best Track Archive for Climate Stewardship 项目

International Best Track Archive for Climate Stewardship (IBTrACS) 提供全球热带气旋的位置和强度。数据范围从 19 世纪 40 年代至今,通常以 3 小时为间隔提供数据。虽然最佳轨迹数据侧重于位置和强度(最大持续风速… climate hurricane noaa table weather -
伊朗土地覆盖地图 v1 13 类(2017 年)

伊朗全国土地覆被地图是通过在 Google Earth Engine 云平台中处理 Sentinel 影像生成的。为此,我们处理了 2,500 多张 Sentinel-1 影像和 11,000 多张 Sentinel-2 影像,以生成 2017 年的单个镶嵌数据集。然后,基于对象的随机数生成器… landcover landuse-landcover -
IrrMapper 灌溉土地,版本 1.2
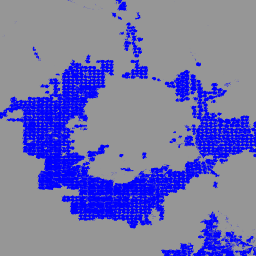
IrrMapper 是一项年度分类,用于确定美国西部 11 个州的灌溉状况,以 Landsat 规模(即 30 米分辨率)进行。30 米)使用随机森林算法,涵盖 1986 年至今。虽然 IrrMapper 论文描述了四类分类(即灌溉地、旱地、未耕地、湿地),但… 农业 Landsat 衍生 -
JRC 全球河流洪灾危险地图版本 2.1
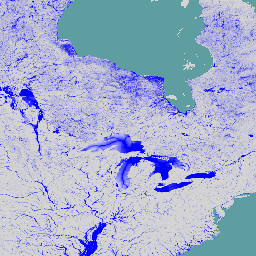
全球河流洪水灾害地图是一个网格化数据集,表示河流网络沿线的淹没情况,涵盖七个不同的洪水重现期(从 10 年一遇到 500 年一遇)。新地图的输入河流流量数据是通过开源水文模型生成的… flood monitoring surface-ground-water wri -
JRC 全球地表水地图层,v1.2 [已弃用]

此数据集包含 1984 年至 2019 年地表水的时空分布地图,并提供有关这些水域的范围和变化情况的统计信息。如需了解详情,请参阅相关期刊文章:High-resolution mapping of global surface water and its … geophysical google jrc landsat-derived surface surface-ground-water -
JRC 全球地表水地图绘制图层,版本 1.4

此数据集包含 1984 年至 2021 年地表水的时空分布地图,并提供有关这些水域的范围和变化情况的统计信息。如需了解详情,请参阅相关期刊文章:High-resolution mapping of global surface water and its … change-detection geophysical google jrc landsat-derived surface -
JRC 全球地表水元数据,版本 1.4

此数据集包含 1984 年至 2021 年地表水的时空分布地图,并提供有关这些水域的范围和变化情况的统计信息。如需了解详情,请参阅相关期刊文章:High-resolution mapping of global surface water and its … geophysical google jrc landsat-derived surface surface-ground-water -
JRC Monthly Water History, v1.4

此数据集包含 1984 年至 2021 年地表水的时空分布地图,并提供有关这些水域的范围和变化情况的统计信息。如需了解详情,请参阅相关期刊文章:High-resolution mapping of global surface water and its … 地球物理 Google 历史记录 jrc Landsat 衍生 月度 -
JRC 月度水资源复发,v1.4

此数据集包含 1984 年至 2021 年地表水的时空分布地图,并提供有关这些水域的范围和变化情况的统计信息。如需了解详情,请参阅相关期刊文章:High-resolution mapping of global surface water and its … 地球物理 Google 历史记录 jrc Landsat 衍生 月度 -
JRC Yearly Water Classification History,v1.4

此数据集包含 1984 年至 2021 年地表水的时空分布地图,并提供有关这些水域的范围和变化情况的统计信息。如需了解详情,请参阅相关期刊文章:High-resolution mapping of global surface water and its … 年度 地球物理 Google 历史记录 jrc Landsat 衍生 -
KBDI:Keetch-Byram 干旱指数

Keetch-Byram 干旱指数 (KBDI) 是一种连续的参考尺度,用于估计土壤和腐殖质层的干燥程度。每逢无雨天,该指数都会增加(增加幅度取决于当天的最高气温);下雨时,该指数会下降。此系统… 干旱 火灾 降雨 -
LANDFIRE BPS(生物物理设置)v1.4.0

LANDFIRE (LF) 的全称为“景观火灾与资源管理规划工具”。该项目由美国农业部林务局、内政部地质调查局以及大自然保护协会共同主导,是各机构野火管理计划的合作共享项目。LANDFIRE (LF) 图层是使用预测性… doi 火灾 森林生物质 土地火灾 自然保护 usda -
LANDFIRE ESP AK(环境场地潜力)v1.2.0

LANDFIRE (LF) 的全称为“景观火灾与资源管理规划工具”。该项目由美国农业部林务局、内政部地质调查局以及大自然保护协会共同主导,是各机构野火管理计划的合作共享项目。LANDFIRE (LF) 图层是使用预测性… doi 火灾 森林生物质 土地火灾 自然保护 usda -
LANDFIRE ESP CONUS(环境立地潜力)v1.2.0

LANDFIRE (LF) 的全称为“景观火灾与资源管理规划工具”。该项目由美国农业部林务局、内政部地质调查局以及大自然保护协会共同主导,是各机构野火管理计划的合作共享项目。LANDFIRE (LF) 图层是使用预测性… doi 火灾 森林生物质 土地火灾 自然保护 usda -
LANDFIRE ESP HI(环境立地潜力)v1.2.0

LANDFIRE (LF) 的全称为“景观火灾与资源管理规划工具”。该项目由美国农业部林务局、内政部地质调查局以及大自然保护协会共同主导,是各机构野火管理计划的合作共享项目。LANDFIRE (LF) 图层是使用预测性… doi 火灾 森林生物质 土地火灾 自然保护 usda -
LANDFIRE EVC(现有植被覆盖率)v1.4.0

LANDFIRE (LF) 的全称为“景观火灾与资源管理规划工具”。该项目由美国农业部林务局、内政部地质调查局以及大自然保护协会共同主导,是各机构野火管理计划的合作共享项目。LANDFIRE (LF) 图层是使用预测性… doi 火灾 森林生物质 土地火灾 自然保护 usda -
LANDFIRE EVH(现有植被高度)v1.4.0

LANDFIRE (LF) 的全称为“景观火灾与资源管理规划工具”。该项目由美国农业部林务局、内政部地质调查局以及大自然保护协会共同主导,是各机构野火管理计划的合作共享项目。LANDFIRE (LF) 图层是使用预测性… doi 火灾 森林生物质 土地火灾 自然保护 usda -
LANDFIRE EVT(现有植被类型)v1.4.0

LANDFIRE (LF) 的全称为“景观火灾与资源管理规划工具”。该项目由美国农业部林务局、内政部地质调查局以及大自然保护协会共同主导,是各机构野火管理计划的合作共享项目。LANDFIRE (LF) 图层是使用预测性… doi 火灾 森林生物质 土地火灾 自然保护 usda -
LANDFIRE FRG(火灾频度组)v1.2.0

LANDFIRE (LF) 的全称为“景观火灾与资源管理规划工具”。该项目由美国农业部林务局、内政部地质调查局以及大自然保护协会共同主导,是各机构野火管理计划的合作共享项目。Landfire (LF) 历史火灾模式、间隔期及… doi 火灾 土地火灾 自然保护 usda usgs -
LANDFIRE MFRI(平均火灾重现间隔)v1.2.0

LANDFIRE (LF) 的全称为“景观火灾与资源管理规划工具”。该项目由美国农业部林务局、内政部地质调查局以及大自然保护协会共同主导,是各机构野火管理计划的合作共享项目。Landfire (LF) 历史火灾模式、间隔期及… doi 火灾 土地火灾 自然保护 usda usgs -
LANDFIRE PLS(低强度火燃烧比例)v1.2.0

LANDFIRE (LF) 的全称为“景观火灾与资源管理规划工具”。该项目由美国农业部林务局、内政部地质调查局以及大自然保护协会共同主导,是各机构野火管理计划的合作共享项目。Landfire (LF) 历史火灾模式、间隔期及… doi 火灾 土地火灾 自然保护 usda usgs -
LANDFIRE PMS(混合强度火燃烧比例)v1.2.0

LANDFIRE (LF) 的全称为“景观火灾与资源管理规划工具”。该项目由美国农业部林务局、内政部地质调查局以及大自然保护协会共同主导,是各机构野火管理计划的合作共享项目。Landfire (LF) 历史火灾模式、间隔期及… doi 火灾 土地火灾 自然保护 usda usgs -
LANDFIRE PRS(更替性火燃烧比例)v1.2.0

LANDFIRE (LF) 的全称为“景观火灾与资源管理规划工具”。该项目由美国农业部林务局、内政部地质调查局以及大自然保护协会共同主导,是各机构野火管理计划的合作共享项目。Landfire (LF) 历史火灾模式、间隔期及… doi 火灾 土地火灾 自然保护 usda usgs -
LANDFIRE SClass(演替类)v1.4.0

LANDFIRE (LF) 的全称为“景观火灾与资源管理规划工具”。该项目由美国农业部林务局、内政部地质调查局以及大自然保护协会共同主导,是各机构野火管理计划的合作共享项目。Landfire (LF) 历史火灾模式、间隔期及… doi 火灾 土地火灾 自然保护 usda usgs -
LANDFIRE VCC(植被状况等级)v1.4.0

LANDFIRE (LF) 的全称为“景观火灾与资源管理规划工具”。该项目由美国农业部林务局、内政部地质调查局以及大自然保护协会共同主导,是各机构野火管理计划的合作共享项目。Landfire (LF) 历史火灾模式、间隔期及… doi 火灾 土地火灾 自然保护 usda usgs -
LANDFIRE VDep(植被偏离度)v1.4.0

LANDFIRE (LF) 的全称为“景观火灾与资源管理规划工具”。该项目由美国农业部林务局、内政部地质调查局以及大自然保护协会共同主导,是各机构野火管理计划的合作共享项目。Landfire (LF) 历史火灾模式、间隔期及… doi 火灾 土地火灾 自然保护 usda usgs -
LSIB 2017:大规模国际边界多边形,详细
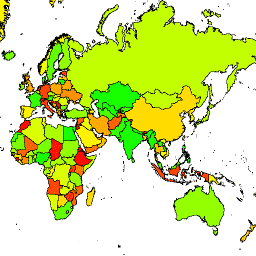
美国地理学家办公室提供了大规模国际边界 (LSIB) 数据集。它源自另外两个数据集:一个 LSIB 线矢量文件和美国国家地理空间情报局 (NGA) 的世界矢量海岸线 (WVS)。内部边界反映了美国政府… 边界 国家/地区 dos 基础设施边界 政治 表格 -
LSIB 2017:大规模国际边界多边形,简化版
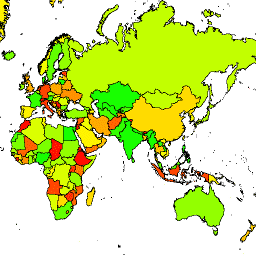
美国地理学家办公室提供了大规模国际边界 (LSIB) 数据集。详细版本 (2013) 派生自另外两个数据集:LSIB 线矢量文件和美国国家地理空间情报局 (NGA) 的世界矢量海岸线 (WVS)。内部边界… 边界 国家/地区 dos 基础设施边界 政治 表格 -
LST Day:Malaria Atlas Project 填充了缺失数据的昼间地表温度(每 8 天 1 千米)

白天陆地表面温度 (LST) 源自约 1 公里的 MODIS MOD11A2 v6.1 产品。将 8 天合成数据转换为摄氏度,然后使用 Weiss 等人 (2014) 概述的方法进行缺口填充,以消除因云覆盖等因素而导致的数据缺失。… climate lst malariaatlasproject map publisher-dataset surface-temperature -
LST Day:Malaria Atlas Project 填充了缺失数据的昼间地表温度(每年 1 千米)

白天陆地表面温度 (LST) 源自约 1 公里的 MODIS MOD11A2 v6.1 产品。将 8 天合成数据转换为摄氏度,然后使用 Weiss 等人 (2014) 概述的方法进行缺口填充,以消除因云覆盖等因素而导致的数据缺失。… climate lst malariaatlasproject map publisher-dataset surface-temperature -
LST Day:Malaria Atlas Project 填充了缺失数据的白天陆地表面温度(每月 1 千米)

白天陆地表面温度 (LST) 源自约 1 公里的 MODIS MOD11A2 v6.1 产品。将 8 天合成数据转换为摄氏度,然后使用 Weiss 等人 (2014) 概述的方法进行缺口填充,以消除因云覆盖等因素而导致的数据缺失。… climate lst malariaatlasproject map publisher-dataset surface-temperature -
LST 夜间:Malaria Atlas Project 填充了缺失数据的夜间地表温度(每 8 天 1 千米)

夜间地表温度 (LST) 源自约 1 公里的 MODIS MOD11A2 v6.1 产品。将 8 天合成数据转换为摄氏度,然后使用 Weiss 等人 (2014) 概述的方法进行缺口填充,以消除因云覆盖等因素而导致的数据缺失。… climate lst malariaatlasproject map publisher-dataset surface-temperature -
LST Night:Malaria Atlas Project 填充了缺失数据的夜间地表温度(每年 1 千米)

夜间地表温度 (LST) 源自约 1 公里的 MODIS MOD11A2 v6.1 产品。将 8 天合成数据转换为摄氏度,然后使用 Weiss 等人 (2014) 概述的方法进行缺口填充,以消除因云覆盖等因素而导致的数据缺失。… climate lst malariaatlasproject map publisher-dataset surface-temperature -
LST Night:Malaria Atlas Project 填充了缺失数据的夜间地表温度(每月 1 千米)

夜间地表温度 (LST) 源自约 1 公里的 MODIS MOD11A2 v6.1 产品。将 8 天合成数据转换为摄氏度,然后使用 Weiss 等人 (2014) 概述的方法进行缺口填充,以消除因云覆盖等因素而导致的数据缺失。… climate lst malariaatlasproject map publisher-dataset surface-temperature -
LUCAS Copernicus(带属性的多边形,2018 年)V1

欧盟 (EU) 的土地利用/覆盖面积框架调查 (LUCAS) 旨在提供统计信息。该计划每三年开展一次原位地表覆盖和土地利用数据收集工作,覆盖整个欧盟地区。LUCAS 收集有关地表覆盖和…的信息 哥白尼 欧盟 jrc 土地覆盖 土地利用 土地利用和土地覆盖 -
LUCAS Harmonized(理论位置,2006-2018 年)V1
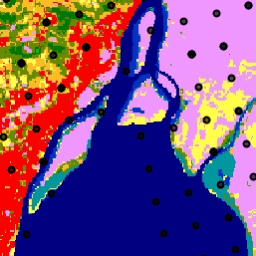
欧盟 (EU) 的土地利用/覆盖面积框架调查 (LUCAS) 旨在提供统计信息。该计划每三年开展一次原位地表覆盖和土地利用数据收集工作,覆盖整个欧盟地区。LUCAS 收集有关地表覆盖和…的信息 eu jrc landcover landuse landuse-landcover lucas -
LUCAS THLOC(含属性的点,2022 年)V1

欧盟 (EU) 的土地利用/覆盖面积框架调查 (LUCAS) 旨在提供统计信息。该计划每三年开展一次原位地表覆盖和土地利用数据收集工作,覆盖整个欧盟地区。LUCAS 收集有关地表覆盖和…的信息 eu jrc landcover landuse landuse-landcover lucas -
2020 年北美土地覆被情况(30 米分辨率)

2020 年北美土地覆盖 30 米数据集是北美土地变化监测系统 (NALCMS) 的一部分,该系统是加拿大自然资源部、美国地质调查局和三个墨西哥组织(包括国家统计和地理研究所)之间的三边合作项目。 landcover landsat landuse-landcover nlcd reflectance -
2022 年 1 月乌克兰 LandScan 高清数据

LandScan High Definition (HD) 以 3 角秒(约 100 米)的分辨率提供网格化的人口估计数据。每个 LandScan HD 单元格的值表示环境(即 24 小时平均)人口数估计值。这样,数据就能捕捉到人们在整个课程中的全部潜在活动空间… landscan population -
LandScan 人口数据(全球,1 公里)
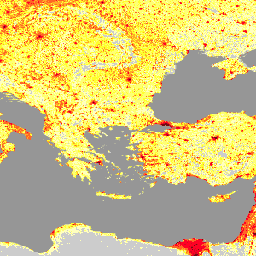
LandScan 数据集由橡树岭国家实验室 (ORNL) 提供,是一个全面且高分辨率的全球人口分布数据集,可作为各种应用的宝贵资源。LandScan 利用先进的空间建模技术和高级地理空间数据源,提供详细的… community-dataset demography landscan population sat-io -
Landsat Collection 2 Tier 1 Level 2 32 天 BAI 合成影像

这些 Landsat Collection 2 Tier 1 Level 2 合成影像由 Tier 1 Level 2 正射校正场景生成。火烧面积指数 (BAI) 是根据红波段和近红外波段生成的,用于衡量每个像素与参考光谱点(… bai 火灾 陆地卫星 陆地卫星合成 usgs 植被指数 -
Landsat Collection 2 Tier 1 Level 2 32 天合成影像

这些 Landsat Collection 2 Tier 1 Level 2 合成影像由 Tier 1 Level 2 正射校正场景制成,包含 SR 波段:蓝色、绿色、红色、近红外、短波红外 1、短波红外 2 和热红外。这些合成影像基于每个 32 天周期(从…开始)内的所有场景生成。 陆地卫星 陆地卫星合成 卫星图像 sr usgs -
Landsat Collection 2 Tier 1 Level 2 32 天 NBR 合成影像

这些 Landsat Collection 2 Tier 1 Level 2 合成影像由 Tier 1 Level 2 正射校正场景生成。归一化烧毁比率热指数 (NBRT) 由近红外、中红外 (2215 nm) 和热波段生成,范围为 -1.0 到 1.0。请参阅… 火灾 陆地卫星 陆地卫星合成 nbrt usgs 植被指数 -
Landsat Collection 2 Tier 1 Level 2 32 天 NDVI 复合数据

这些 Landsat Collection 2 Tier 1 Level 2 合成影像由 Tier 1 Level 2 正射校正场景生成。归一化差异植被指数是根据每个场景的近红外波段和红色波段计算得出的,计算公式为 (NIR - Red) / (NIR + Red),范围为 … 陆地卫星 陆地卫星合成 ndvi usgs 植被 植被指数 -
Landsat Collection 2 Tier 1 Level 2 32 天 NDWI 复合

这些 Landsat Collection 2 Tier 1 Level 2 合成影像由 Tier 1 Level 2 正射校正场景生成。归一化差值水体指数 (NDWI) 旨在描绘开阔水域特征,增强其在影像中的呈现效果,同时消除土壤和陆地植被特征。它… 陆地卫星 陆地卫星合成 ndwi 地表地下水 usgs -
Landsat Collection 2 Tier 1 Level 2 8 天 BAI 复合影像

这些 Landsat Collection 2 Tier 1 Level 2 合成影像由 Tier 1 Level 2 正射校正场景生成。火烧面积指数 (BAI) 是根据红波段和近红外波段生成的,用于衡量每个像素与参考光谱点(… bai 火灾 陆地卫星 陆地卫星合成 usgs 植被指数 -
Landsat Collection 2 Tier 1 Level 2 8 天合成数据
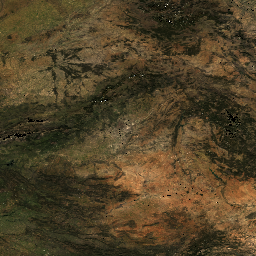
这些 Landsat Collection 2 Tier 1 Level 2 合成影像由 Tier 1 Level 2 正射校正场景制成,包含 SR 波段:蓝色、绿色、红色、近红外、短波红外 1、短波红外 2 和热红外。这些合成影像基于每个 8 天周期(从…开始)内的所有场景生成。 陆地卫星 陆地卫星合成 卫星图像 sr usgs -
Landsat Collection 2 Tier 1 Level 2 8 天 EVI 复合数据

这些 Landsat Collection 2 Tier 1 Level 2 合成影像由 Tier 1 Level 2 正射校正场景生成。增强型植被指数 (EVI) 是根据每个场景的近红外波段、红波段和蓝波段生成的,值范围为 -1.0 到 1.0。参见 Huete… evi 陆地卫星 陆地卫星合成 usgs 植被 植被指数 -
Landsat Collection 2 Tier 1 Level 2 8 天 NBR 复合影像

这些 Landsat Collection 2 Tier 1 Level 2 合成影像由 Tier 1 Level 2 正射校正场景生成。归一化烧毁比率热指数 (NBRT) 由近红外、中红外 (2215 nm) 和热波段生成,范围为 -1.0 到 1.0。请参阅… 火灾 陆地卫星 陆地卫星合成 nbrt usgs 植被指数 -
Landsat Collection 2 Tier 1 Level 2 8 天 NDVI 复合数据

这些 Landsat Collection 2 Tier 1 Level 2 合成影像由 Tier 1 Level 2 正射校正场景生成。归一化差异植被指数是根据每个场景的近红外波段和红色波段计算得出的,计算公式为 (NIR - Red) / (NIR + Red),范围为 … 陆地卫星 陆地卫星合成 ndvi usgs 植被 植被指数 -
Landsat Collection 2 Tier 1 Level 2 8 天 NDWI 复合数据

这些 Landsat Collection 2 Tier 1 Level 2 合成影像由 Tier 1 Level 2 正射校正场景生成。归一化差值水体指数 (NDWI) 旨在描绘开阔水域特征,增强其在影像中的呈现效果,同时消除土壤和陆地植被特征。它… 陆地卫星 陆地卫星合成 ndwi 地表地下水 usgs -
Landsat Collection 2 Tier 1 Level 2 年度 BAI 合成影像

这些 Landsat Collection 2 Tier 1 Level 2 合成影像由 Tier 1 Level 2 正射校正场景生成。火烧面积指数 (BAI) 是根据红波段和近红外波段生成的,用于衡量每个像素与参考光谱点(… bai 火灾 陆地卫星 陆地卫星合成 usgs 植被指数 -
Landsat Collection 2 Tier 1 Level 2 年度合成影像
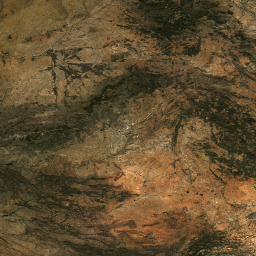
这些 Landsat Collection 2 Tier 1 Level 2 合成影像由 Tier 1 Level 2 正射校正场景制成,包含 SR 波段:蓝色、绿色、红色、近红外、短波红外 1、短波红外 2 和热红外。这些合成影像基于每个年度周期(从…开始)中的所有场景生成 陆地卫星 陆地卫星合成 卫星图像 sr usgs -
Landsat Collection 2 Tier 1 Level 2 年度 EVI 合成影像

这些 Landsat Collection 2 Tier 1 Level 2 合成影像由 Tier 1 Level 2 正射校正场景生成。增强型植被指数 (EVI) 是根据每个场景的近红外波段、红波段和蓝波段生成的,值范围为 -1.0 到 1.0。参见 Huete… evi 陆地卫星 陆地卫星合成 usgs 植被 植被指数 -
Landsat Collection 2 Tier 1 Level 2 年度 NBR 合成影像

这些 Landsat Collection 2 Tier 1 Level 2 合成影像由 Tier 1 Level 2 正射校正场景生成。归一化烧毁比率热指数 (NBRT) 由近红外、中红外 (2215 nm) 和热波段生成,范围为 -1.0 到 1.0。请参阅… 火灾 陆地卫星 陆地卫星合成 nbrt usgs 植被指数 -
Landsat Collection 2 Tier 1 Level 2 年度 NDVI 合成影像

这些 Landsat Collection 2 Tier 1 Level 2 合成影像由 Tier 1 Level 2 正射校正场景生成。归一化差异植被指数是根据每个场景的近红外波段和红色波段计算得出的,计算公式为 (NIR - Red) / (NIR + Red),范围为 … 陆地卫星 陆地卫星合成 ndvi usgs 植被 植被指数 -
Landsat Collection 2 Tier 1 Level 2 年度 NDWI 合成影像
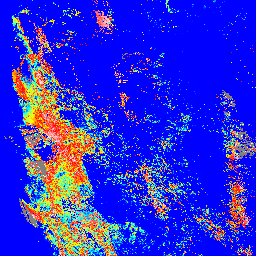
这些 Landsat Collection 2 Tier 1 Level 2 合成影像由 Tier 1 Level 2 正射校正场景生成。归一化差值水体指数 (NDWI) 旨在描绘开阔水域特征,增强其在影像中的呈现效果,同时消除土壤和陆地植被特征。它… 陆地卫星 陆地卫星合成 ndwi 地表地下水 usgs -
Landsat 全球陆地调查 1975 年

全球陆地调查 (GLS) 1975 是 Landsat 多光谱扫描仪 (MSS) 拍摄的全球图像集合。大多数场景都是由 Landsat 1-3 在 1972 年至 1983 年间拍摄的。Landsat 1-3 数据中的一些缺口已用 Landsat 4-5 在 … 期间获取的场景填补 全球 gls 陆地卫星 辐射 卫星图像 usgs -
Landsat 全球陆地调查 2005 年,Landsat 5 场景

GLS2005 数据集包含 9,500 张正射校正的叶茂盛期中分辨率卫星图像,这些图像是在 2004 年至 2007 年间收集的,覆盖了地球的陆地。GLS2005 主要使用 Landsat 5 和经过缺口填充的 Landsat 7 数据,并使用 EO-1 ALI 和 Terra ASTER 数据填充任何… etm gls l5 陆地卫星 辐射 卫星图像 -
Landsat 全球陆地调查 2005 年,Landsat 5+7 场景

GLS2005 数据集包含 9,500 张正射校正的叶茂盛期中分辨率卫星图像,这些图像是在 2004 年至 2007 年间收集的,覆盖了地球的陆地。GLS2005 主要使用 Landsat 5 和经过缺口填充的 Landsat 7 数据,并使用 EO-1 ALI 和 Terra ASTER 数据填充任何… gls landsat radiance satellite-imagery usgs -
Landsat 全球陆地调查 2005 年,Landsat 7 场景

GLS2005 数据集包含 9,500 张正射校正的叶茂盛期中分辨率卫星图像,这些图像是在 2004 年至 2007 年间收集的,覆盖了地球的陆地。GLS2005 主要使用 Landsat 5 和经过缺口填充的 Landsat 7 数据,并使用 EO-1 ALI 和 Terra ASTER 数据填充任何… etm gls l7 landsat 辐射亮度 卫星图像 -
美国本土 Landsat 初级生产总值

Landsat 美国本土初级生产力 (GPP) CONUS 数据集使用美国本土 Landsat 地表反射率来估计 GPP。GPP 是指生态系统中植物捕获的碳量,是净初级生产力 (NPP) 计算中的一个重要组成部分。GPP 的计算方式为… 16 天 conus gpp gridmet-derived landsat mod17 -
南极洲 Landsat 影像镶嵌图 (LIMA) - 处理后的 Landsat 场景(16 位)

南极洲 Landsat 图像拼接图 (LIMA) 是由经过处理的 Landsat 7 ETM+ 场景创建的无缝且几乎无云的拼接图。经过处理的 Landsat 场景(16 位)是指转换为 16 位、经过太阳角度校正并转换为反射率值(Bindschadler…)的 1 级 Gt NLAPS 场景。 antarctica ice landsat-derived lima mosaic satellite-imagery -
南极洲 Landsat 影像镶嵌图 (LIMA) - 处理后的 Landsat 场景(16 位)元数据

南极洲 Landsat 图像拼接图 (LIMA) 是由经过处理的 Landsat 7 ETM+ 场景创建的无缝且几乎无云的拼接图。经过处理的 Landsat 场景(16 位)是指转换为 16 位、经过太阳角度校正并转换为反射率值(Bindschadler…)的 1 级 Gt NLAPS 场景。 antarctica ice landsat-derived lima mosaic satellite-imagery -
南极洲 Landsat 影像镶嵌图 (LIMA) 16 位全色锐化镶嵌图

南极洲 Landsat 图像拼接图 (LIMA) 是由经过处理的 Landsat 7 ETM+ 场景创建的无缝且几乎无云的拼接图。此 LIMA 数据集是 16 位中间 LIMA。镶嵌图由经过全色锐化的归一化地表反射率场景(Landsat ETM+ 波段 1、2、3 和 … antarctica ice landsat-derived lima mosaic satellite-imagery -
美国本土 Landsat 初级生产力

Landsat 美国本土净初级生产力 (NPP) 数据集使用美国本土的 Landsat 地表反射率来估算 NPP。NPP 是指生态系统中植物捕获的碳量,已扣除因呼吸作用而损失的碳量。NPP 是使用 MOD17 算法计算的(请参阅 MOD17 用户… conus gridmet-derived landsat mod17 nlcd-derived npp -
加拿大 2019 年基于 Landsat 的森林年龄数据

加拿大原始森林数据集是一张基于卫星数据的森林年龄地图,涵盖加拿大所有森林生态区,空间分辨率为 30 米,数据年份为 2019 年。我们利用来自 Landsat(扰动、地表反射率合成影像、森林结构)和 MODIS(初级生产总值)的遥感数据来确定年龄。森林年龄可以是… 加拿大 森林 森林生物质 -
拉脱维亚彩色红外 (CIR) 正射影像

在拉脱维亚,正射影像地图是根据 TKS-93 地图分幅(比例为 1:10000 的地图分幅对应于实际 5 x 5 公里的区域)在拉脱维亚坐标系 LKS-92 TM 中制作的。正射影像地图已准备好,覆盖拉脱维亚全境,比例为 … latvia nrg orthophotos -
拉脱维亚 RGB 正射影像

在拉脱维亚,正射影像地图是根据 TKS-93 地图分幅(比例为 1:10000 的地图分幅对应于实际 5 x 5 公里的区域)在拉脱维亚坐标系 LKS-92 TM 中制作的。正射影像地图已准备好,覆盖拉脱维亚全境,比例为 … 拉脱维亚 正射影像 RGB -
MACAv2-METDATA 月度摘要:爱达荷大学,应用于全球气候模型的多变量自适应构建类比

MACAv2-METDATA 数据集包含 20 个覆盖美国本土的全球气候模型。多变量自适应构建类比 (MACA) 方法是一种统计降尺度方法,它利用训练数据集(即气象观测数据集)来消除历史偏差并匹配空间模式… climate conus geophysical idaho maca monthly -
MACAv2-METDATA:爱达荷大学,应用于全球气候模型的多变量自适应构建类比

MACAv2-METDATA 数据集包含 20 个覆盖美国本土的全球气候模型。多变量自适应构建类比 (MACA) 方法是一种统计降尺度方法,它利用训练数据集(即气象观测数据集)来消除历史偏差并匹配空间模式… climate conus geophysical idaho maca monthly -
MCD12C1.061 MODIS 地表覆盖类型年度全球 0.05 度 CMG

Terra 和 Aqua 组合的中等分辨率成像光谱辐射计 (MODIS) 土地覆盖气候模型网格 (CMG) (MCD12C1) 版本 6.1 数据产品提供了平铺 MCD12Q1 版本 6.1 数据产品的空间聚合和重新投影版本。国际地圈-生物圈计划 (IGBP) 的地图,… 大学 土地覆盖 土地利用-土地覆盖 MODIS NASA USGS 每年 -
MCD12Q1.061 MODIS 土地覆盖类型年度全球 500 米
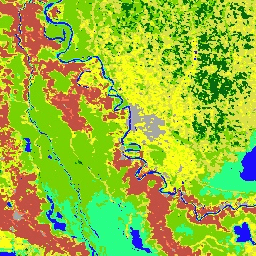
Terra 和 Aqua 卫星组合的中等分辨率成像光谱辐射计 (MODIS) 土地覆盖类型 (MCD12Q1) 版本 6.1 数据产品以年为间隔提供全球土地覆盖类型。MCD12Q1 版本 6.1 数据产品是使用 MODIS Terra 和 Aqua 反射率数据的监督分类得出的。土地… 土地覆盖 土地利用-土地覆盖 MODIS NASA USGS 每年 -
MCD12Q2.006 土地覆被动态年度全球 500 米

Terra 和 Aqua 组合的中等分辨率成像光谱辐射计 (MODIS) 土地覆被动态 (MCD12Q2) 版本 6.1 数据产品以年为间隔提供全球地表物候指标。MCD12Q2 版本 6.1 数据产品源自双波段增强型植被指数 (EVI2) 的时间序列… EVI 全球 土地利用和土地覆盖 MODIS 植被返青期 物候 -
MCD15A3H.061 MODIS 叶面积指数/FPAR 4 天全球 500 米

MCD15A3H 版本 6.1 中等分辨率成像光谱辐射计 (MODIS) 4 级产品,即组合的光合有效辐射吸收比 (FPAR) 和叶面积指数 (LAI) 产品,是一个 4 天合成数据集,像素大小为 500 米。该算法会从所有…中选择最佳可用像素 fpar global lai modis nasa plant-productivity -
MCD18A1.062 地表辐射每日/每 3 小时
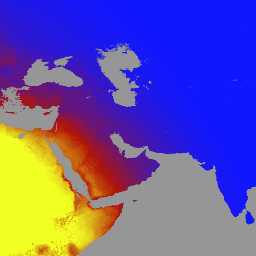
MCD18A1 版本 6.2 是一种中等分辨率成像光谱辐射计 (MODIS) Terra 和 Aqua 组合的向下短波辐射 (DSR) 网格化 3 级产品,每天生成一次,像素分辨率为 1 公里,每 3 小时估计一次 DSR。DSR 是陆地表面的入射太阳辐射… climate par radiation -
MCD18C2.062 光合有效辐射每日 3 小时
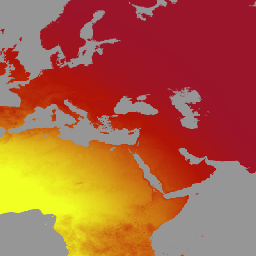
MCD18C2 版本 6.2 是一种中等分辨率成像光谱辐射计 (MODIS) Terra 和 Aqua 组合光合有效辐射 (PAR) 网格化 3 级产品,每天生成一次,分辨率为 0.05 度(赤道处为 5,600 米),每 3 小时估计一次 PAR。PAR 是入射太阳辐射… climate par radiation -
MCD19A1.061:陆地表面 BRF 每日 L2G 全球 500 米和 1 公里

MCD19A1 版本 6.1 数据产品是中等分辨率成像光谱辐射计 (MODIS) Terra 和 Aqua 组合地表双向反射率因子 (BRF) 格网化 2 级产品,以 500 米和 1 千米分辨率每日生成。如需了解详情,请参阅 MAIAC 用户指南。 气溶胶 aod aqua 每日 全球 maiac -
MCD19A2.061:Terra 和 Aqua MAIAC 陆地气溶胶光学深度(每日 1 公里)

MCD19A2 V6.1 数据产品是 MODIS Terra 和 Aqua 组合的多角度大气校正实现 (MAIAC) 陆地气溶胶光学厚度 (AOD) 格网 2 级产品,以 1 公里分辨率每日生成。如需了解详情,请参阅 MAIAC 用户指南。注意:此产品具有… 气溶胶 aod aqua 大气 每日 全球 -
MCD43A1.061 MODIS BRDF-Albedo 模型参数 每日 500 米

MCD43A1 V6.1 双向反射率分布函数和反照率 (BRDF/Albedo) 模型形参数据集是一种 500 米分辨率的每日 16 天产品。儒略日表示 16 天反演周期的第 9 天,因此观测结果会加权以估计当天的 BRDF/反照率。… albedo brdf daily global modis nasa -
MCD43A2.061 MODIS BRDF-Albedo 质量每日 500 米

MCD43A2 V6.1 双向反射率分布函数和反照率 (BRDF/Albedo) 质量数据集是一种 500 米分辨率的每日 16 天产品。它包含相应 16 天 MCD43A3 反照率和 MCD43A4 Nadir-BRDF (NBAR) 产品的所有质量信息。MCD43A2 包含各个波段的质量和观测数据,… albedo brdf daily global modis nasa -
MCD43A3.061 MODIS 反照率每日 500 米

MCD43A3 V6.1 反照率模型数据集是每日 16 天的产品。它为每个 MODIS 地表反射率波段(波段 1 至波段 7)以及 3 个宽光谱波段提供方向半球反射率(黑空反照率)和双半球反射率(白空反照率)… 反照率 黑空 每日 全球 MODIS NASA -
MCD43A4.061 MODIS 天底 BRDF 调整后的反射率每日 500 米

MCD43A4 V6.1 天底双向反射率分布函数调整后的反射率 (NBAR) 产品提供 MODIS“陆地”波段 1-7 的 500 米反射率数据。这些值会使用双向反射率分布函数进行调整,以模拟从天底视角收集的值。… albedo brdf daily global modis nasa -
MCD43C3.061 BRDF/反照率每日 L3 0.05 度 CMG

MCD43C3 版本 6.1 双向反射率分布函数和反照率 (BRDF/Albedo) 反照率数据集采用 Terra 和 Aqua 卫星 MODIS 16 天观测数据,基于 0.05 度(赤道处约 5,600 米)气候模拟网格 (CMG) 每日生成。数据在时间维度上加权至反演周期的第 9 天… 反照率 晴空 BRDF 每日 全球 MODIS -
MCD64A1.061 MODIS 烧毁区域月度全球 500 米

Terra 和 Aqua 组合的 MCD64A1 版本 6.1 烧毁面积数据产品是一种每月更新的全球网格化 500 米产品,包含每个像素的烧毁面积和质量信息。MCD64A1 烧毁面积测绘方法采用 500 米 MODIS 地表反射率影像,并结合 1 公里 MODIS 火点观测数据。该算法… burn change-detection fire geophysical global mcd64a1 -
MERIT DEM:多重错误移除改进型地形 DEM
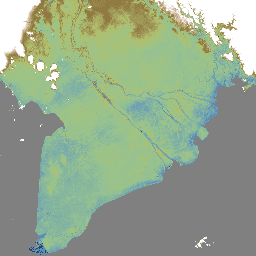
MERIT DEM 是一种高精度全球 DEM,分辨率为 3 弧秒(赤道处约为 90 米),通过消除现有 DEM(NASA SRTM3 DEM、JAXA AW3D DEM、Viewfinder Panoramas DEM)中的主要误差分量生成。MERIT DEM 可分离绝对偏差、条带噪声、斑点噪声和… dem 高程 高程-地形 merit 地形 -
MERIT Hydro:全球水文数据集
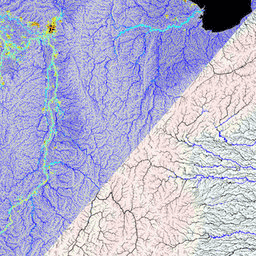
MERIT Hydro 是一张新的全球水流方向地图,分辨率为 3 角秒(赤道附近约为 90 米),基于 MERIT DEM 海拔数据和水体数据集(G1WBM、GSWO 和 OpenStreetMap)的版本 1.0.3 派生而来。MERIT Hydro 包含新 … 的输出 dem elevation flow-direction hand hydrography hydrosheds -
MERIT Hydro:补充可视化图层

MERIT Hydro 的补充可视化图层 dem elevation flow-direction hand hydrography hydrosheds -
MERRA-2 M2I3NVAER:气溶胶混合比 V5.12.4

M2I3NVAER(或 inst3_3d_aer_Nv)是 MERRA-2(现代回顾性分析研究和应用第 2 版)中的一种瞬时三维 3 小时数据集合。此集合包含 72 个模型层中气溶胶混合比参数的同化,例如粉尘、二氧化硫、海盐、黑碳和… 气溶胶 大气 尘埃 质量 merra nasa -
MERRA-2 M2T1NXAER:气溶胶诊断 V5.12.4

M2T1NXAER(或 tavg1_2d_aer_Nx)是现代回顾性分析研究和应用版本 2 (MERRA-2) 中的每小时时间平均二维数据集合。此集合包含同化气溶胶诊断数据,例如气溶胶组分(黑碳、沙尘、海盐、硫酸盐和有机碳)的柱质量密度、地表… 气溶胶 大气 碳 尘埃 质量 merra -
MERRA-2 M2T1NXFLX:地表通量诊断 V5.12.4

M2T1NXFLX(或 tavg1_2d_flx_Nx)是 Modern-Era Retrospective analysis for Research and Applications 版本 2 (MERRA-2) 中的每小时时间平均数据集合。此集合包含同化后的地面通量诊断变量,例如总降水量、偏差校正后的总降水量、地面气温、地面比湿、地面风速、… climate merra precipitation sea-salt so2 so4 -
MERRA-2 M2T1NXLND:陆地表面诊断 V5.12.4

M2T1NXLND(或 tavg1_2d_lnd_Nx)是现代回顾性研究与应用分析第 2 版 (MERRA-2) 中的每小时时间平均数据集合。此集合包含地表诊断数据,例如基流通量、径流、表层土壤湿度、根区土壤湿度、表层水、… climate cryosphere evaporation ice merra precipitation -
MERRA-2 M2T1NXRAD:辐射诊断 V5.12.4

M2T1NXRAD(或 tavg1_2d_rad_Nx)是现代回顾性分析研究和应用第 2 版 (MERRA-2) 中的每小时时间平均数据集合。此集合包含辐射诊断数据,例如地表反照率、云面积分数、云内光学厚度、地表入射短波通量(即太阳辐射)、地表… albedo atmosphere climate emissivity merra shortwave -
MERRA-2 M2T1NXSLV:单层诊断 V5.12.4

M2T1NXSLV(或 tavg1_2d_slv_Nx)是现代研究和应用时代回顾性分析版本 2 (MERRA-2) 中的每小时时间平均二维数据集。此集合包含常用垂直高度的气象诊断信息,例如 2 米(或 10 米、850hPa、500 hPa、250hPa)高度的气温… atmosphere climate humidity merra nasa pressure -
MEaSUREs Greenland Ice Velocity: Selected Glacier Site Velocity Maps from Optical Images Version 2

此数据集是 NASA“在研究环境中制作地球系统数据记录”(MEaSUREs) 计划的一部分,包含所选冰川出口区域的平均月度速度地图。这些地图是通过跟踪 Landsat 获取的光学图像对之间的可见特征生成的… 北极 冰冻圈 gimp 格陵兰 冰 nasa -
MOD08_M3.061 Terra 大气月度全球产品

MOD08_M3 V6.1 是一种大气全球产品,包含大气形参的月度 1x1 度网格平均值。这些参数与大气气溶胶粒子属性、总臭氧负荷、大气水汽、云光学和物理属性以及大气稳定性指数有关。… 大气 气候 地球物理 全球 modis 月度 -
MOD09A1.061 Terra 地表反射率 8 天全球 500 米
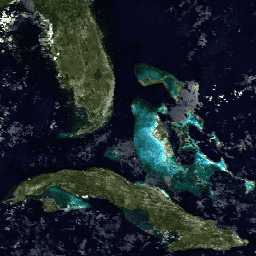
MOD09A1 V6.1 产品提供 Terra MODIS 波段 1-7 在 500 米分辨率下的地表光谱反射率估计值,并针对气体、气溶胶和瑞利散射等大气条件进行了校正。除了七个反射率波段之外,还有一个质量层和四个观测… 8 天 全球 modis nasa 卫星图像 sr -
MOD09CMG.061 Terra 地表反射率每日 L3 全球 0.05 度 CMG
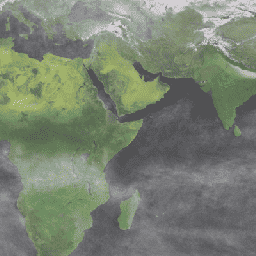
MOD09CMG 版本 6.1 产品提供 Terra 中等分辨率成像光谱辐射计 (MODIS) 波段 1 至 7 的地表光谱反射率估计值,重新采样为 5,600 米像素分辨率,并针对气体、气溶胶和瑞利散射等大气条件进行了校正。MOD09CMG 数据… brightness-temperature ozone satellite-imagery surface-reflectance terra -
MOD09GA.061 Terra 地表反射率每日全球 1 公里和 500 米
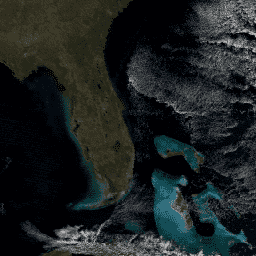
MODIS 地表反射率产品可提供地表光谱反射率的估计值,该值是在没有大气散射或吸收的情况下于地面测得的。低级别数据已针对大气气体和气溶胶进行校正。MOD09GA 版本 6.1 提供波段 1-7,… daily global modis nasa satellite-imagery sr -
MOD09GQ.061 Terra 地表反射率每日全球 250 米
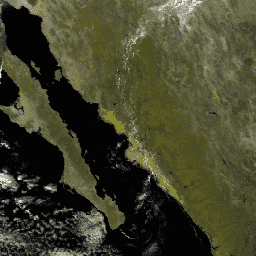
MODIS 地表反射率产品可提供地表光谱反射率的估计值,该值是在没有大气散射或吸收的情况下于地面测得的。低级别数据已针对大气气体和气溶胶进行校正。MOD09GQ 版本 6.1 提供了波段 1 和 … daily global modis nasa satellite-imagery sr -
MOD09Q1.061 Terra 地表反射率 8 天全球 250 米
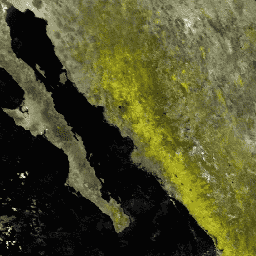
MOD09Q1 产品提供 1 波段和 2 波段在 250 米分辨率下的地表光谱反射率估计值,并针对气体、气溶胶和瑞利散射等大气条件进行了校正。除了这两个反射率波段,还包括一个质量层。对于每个… 8-day global mod09q1 modis nasa satellite-imagery -
MOD10A1.061 Terra 雪盖每日全球 500 米

MOD10A1 V6.1 积雪每日全球 500 米产品包含积雪、积雪反照率、积雪覆盖率和质量评估 (QA) 数据。积雪覆盖率数据基于一种积雪测绘算法,该算法采用归一化差异积雪指数 (NDSI) 和其他标准测试。常规… 反照率 冰冻圈 每日 地球物理 全球 MODIS -
MOD10A2.061 Terra 雪盖 8 天 L3 全球 500 米

MOD10A2 是 Terra 卫星上 MODIS 提供的积雪覆盖数据集。该数据集报告了 8 天内最大积雪范围,分辨率为 500 米。之所以选择 8 天的合成周期,是因为这是精确的地面轨道重复周期… 冰冻圈 每日 地球物理 全球 modis nasa -
MOD11A1.061 Terra 地表温度与发射率每日全球 1 公里

MOD11A1 V6.1 产品以 1200 x 1200 公里网格提供每日地表温度 (LST) 和发射率值。温度值源自 MOD11_L2 观测带产品。在 30 度纬度以上,部分像素可能有多项观测结果,其中晴空条件… climate daily emissivity global lst modis -
MOD11A2.061 Terra 地表温度与发射率 8 天全球 1 公里

MOD11A2 V6.1 产品以 1200 x 1200 公里网格提供平均 8 天地表温度 (LST)。MOD11A2 中的每个像素值都是相应 8 天内收集的所有 MOD11A1 LST 像素的简单平均值。MOD11A2 会执行… 8 天 气候 发射率 全球 lst mod11a2 -
MOD13A1.061 Terra 植被指数 16 天全球 500 米

MOD13A1 V6.1 产品以像素为基础提供植被指数 (VI) 值。主要有两个植被层。第一个是归一化差值植被指数 (NDVI),它被称为现有美国国家海洋和大气管理局 (NOAA) … 16-day evi global modis nasa ndvi -
MOD13A2.061 Terra 植被指数 16 天全球 1 公里

MOD13A2 V6.1 产品提供两种植被指数 (VI):归一化差值植被指数 (NDVI) 和增强型植被指数 (EVI)。NDVI 被称为连续性指数,可与现有的美国国家海洋和大气管理局-高级甚高分辨率辐射计 (NOAA-AVHRR) 派生的 NDVI 进行比较。… 16-day evi global modis nasa ndvi -
MOD13A3.061 植被指数月度 L3 全球 1 公里 SIN 网格

MOD13A3 V6.1 产品数据以 1 公里 (km) 的空间分辨率按月提供。在生成此月度产品时,该算法会纳入与相应月份重叠的所有 MOD13A2 产品,并采用加权时间平均值。植被指数用于在全球范围内监测植被… evi global modis monthly nasa ndvi -
MOD13C1.061:Terra 植被指数 16 天 L3 全球 0.05 度气候模型网格

Terra 中等分辨率成像光谱辐射计 (MODIS) 植被指数 16 天 (MOD13C1) 版本 6.1 产品以像素为基础提供植被指数 (VI) 值。主要有两个植被层。第一个是归一化差值植被指数 (NDVI),它与…保持连续性 16 天 全球 nasa terra usgs 植被 -
MOD13Q1.061 Terra 植被指数 16 天全球 250 米

MOD13Q1 V6.1 产品以像素为单位提供植被指数 (VI) 值。主要有两个植被层。第一个是归一化差值植被指数 (NDVI),它被称为现有美国国家海洋和大气管理局 (NOAA) … 16-day evi global modis nasa ndvi -
MOD14A1.061:Terra 热异常和火灾每日全球 1 公里

MOD14A1 V6.1 数据集提供每日 1 公里分辨率的火灾掩膜合成数据,这些数据源自 MODIS 4 微米和 11 微米辐射率。火灾检测策略基于对火灾的绝对检测(当火势足以检测到时)以及相对于…的检测。 daily fire global modis nasa terra -
MOD14A2.061:Terra 热异常与火灾 8 天全球 1 公里

MOD14A2 V6.1 数据集以 1 公里分辨率提供 8 天的火灾掩码合成数据。它包含合成期内各个像素类的最大值。除了火点掩模之外,还提供了一个关联的质量信息层。文档:用户指南 - 算法理论基础… 8 天 火灾 全球 modis nasa terra -
MOD15A2H.061:Terra 叶面积指数/FPAR 8 天全球 500 米

MOD15A2H V6.1 MODIS 组合叶面积指数 (LAI) 和光合有效辐射吸收比 (FPAR) 产品是一个 8 天合成数据集,分辨率为 500 米。该算法会从 Terra 传感器在 8 天内采集的所有图像中选择“最佳”像素。… 8 天 fpar global lai modis nasa -
MOD16A2.061:Terra 净蒸散量 8 天全球 500 米

MOD16A2 版本 6.1 蒸发蒸腾/潜热通量产品是一种 8 天合成产品,以 500 米像素分辨率生成。用于 MOD16 数据产品集合的算法基于 Penman-Monteith 方程的逻辑,其中包括每日气象再分析数据输入… 8 天 蒸发蒸腾 全球 mod16a2 modis nasa -
MOD16A2:MODIS 全球陆地蒸散量 8 天全球 1 公里

MOD16A2 V105 产品提供有关 8 天全球陆地蒸散的信息,像素分辨率为 1 公里。蒸发蒸腾 (ET) 是指从地球表面到大气层的蒸发量和植物蒸腾量之和。借助长期 ET 数据,可以评估气候、土地利用和… 8 天 蒸发蒸腾 全球 mod16a2 modis 水汽 -
MOD16A2GF.061:Terra 净蒸散量(已填充缺口)8 天全球 500 米

Terra 中等分辨率成像光谱辐射计 (MODIS) MOD16A2GF 版本 6.1 蒸散/潜热通量 (ET/LE) 产品是一种年终间隙填充的 8 天合成数据集,以 500 米 (m) 像素分辨率生成。MOD16 数据产品集合所用的算法基于以下逻辑… 8 天 蒸发蒸腾 全球 modis nasa 水汽 -
MOD17A2H.061:Terra 总初级生产力 8 天全球 500 米

MOD17A2H V6.1 总初级生产力 (GPP) 产品是累积的 8 天合成产品,像素大小为 500 米。该产品基于辐射利用效率概念,可作为数据模型的输入,用于计算陆地能量、碳、水循环过程等。 8 天 全球 gpp modis nasa 光合作用 -
MOD17A2HGF.061:Terra 总初级生产力 8 天全球 500 米

MOD17A2HGF 版本 6.1 总初级生产力 (GPP) 产品是基于辐射利用效率概念的累积 8 天合成值,像素大小为 500 米 (m),可潜在用作数据模型的输入来计算陆地能量、碳、水… 8 天 全球 gpp modis nasa 光合作用 -
MOD17A3HGF.061:Terra 净初级生产力(已填充间隙)年度全球 500 米
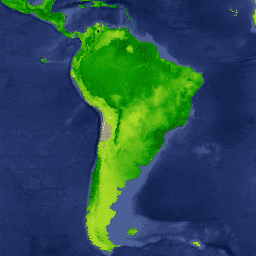
MOD17A3HGF V6.1 产品提供 500 米像素分辨率的年总初级生产力和净初级生产力(GPP 和 NPP)信息。年度 NPP 是根据指定年份的所有 8 天净光合作用(PSN) 产品 (MOD17A2H) 的总和计算得出的。PSN 值是 … 的差值 global gpp nasa npp photosynthesis plant-productivity -
MOD21A1D.061 Terra 地表温度和 3 波段发射率每日全球 1 公里
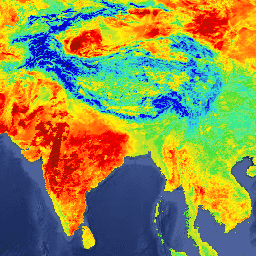
MOD21A1D 数据集每天由白天 2 级格网 (L2G) 中间 LST 产品生成,空间分辨率为 1,000 米。L2G 流程可将每日 MOD21 轨道分片数据映射到正弦 MODIS 网格,并存储落在网格单元格中的所有观测结果… climate daily emissivity global lst nasa -
MOD21A1N.061 Terra 地表温度和 3 波段发射率每日全球 1 公里

MOD21A1N 数据集由夜间 2 级格网 (L2G) 中间 LST 产品每日生成,空间分辨率为 1,000 米。L2G 流程可将每日 MOD21 轨道分片数据映射到正弦 MODIS 网格,并存储落在网格单元格中的所有观测结果… climate daily emissivity global lst nasa -
MOD21C1.061 Terra 地表温度和 3 波段发射率每日 L3 全球 0.05 度 CMG

MOD21C1 数据集基于白天 2 级格网 (L2G) 中间 LST 产品,采用 0.05 度(赤道处约 5,600 米)气候模拟网格 (CMG) 每日生成。L2G 流程可将每日 MOD21 轨道分片数据映射到正弦 MODIS 网格,并存储所有… climate daily emissivity global lst nasa -
MOD21C2.061 Terra 地表温度和 3 波段发射率 8 天 L3 全球 0.05 度 CMG
MOD21C2 数据集是一种 8 天合成 LST 产品,它使用基于简单平均方法的算法。该算法会计算 8 天内所有无云 MOD21A1D 和 MOD21A1N 每日采集数据的平均值。与 MOD21A1 数据集不同,… climate emissivity global lst nasa surface-temperature -
MOD21C3.061 Terra 地表温度和 3 波段发射率月度 L3 全球 0.05 度 CMG
MOD21C3 数据集是一种月度合成 LST 产品,它使用基于简单平均方法的算法。该算法会计算 8 天内所有无云 MOD21A1D 和 MOD21A1N 每日采集数据的平均值。与 MOD21A1 数据集不同,… climate emissivity global lst monthly nasa -
MOD44B.061 Terra 植被连续场年度全球 250 米

Terra MODIS 植被连续场 (VCF) 产品是全球地表植被覆盖估计值的亚像素级表示。该模型旨在以基本植被特征的比例连续表示地球陆地表面,可提供三种地表覆盖成分的梯度:树木覆盖百分比、… 年度 地球物理 全球 土地利用和土地覆盖 MODIS NASA -
MOD44W.005 基于 MODIS 和 SRTM 得出的陆地水体掩码

全球水体掩膜使用 SWBD(SRTM 水体数据)与 MODIS 250 米数据相结合,创建了一张完整的全球地表水地图,空间分辨率为 250 米,时间约为 2000-2002 年。此数据集旨在用于处理栅格数据,并用于… 地球物理 mod44w modis srtm 地表地下水 水掩膜 -
MOD44W.006 Terra 陆地水体掩码,基于 MODIS 和 SRTM 年度全球 250 米数据得出

MOD44W V6 陆地/水体掩码 250 米产品是使用经过 MODIS 数据训练并经过 MOD44W V5 产品验证的决策树分类器得出的。应用一系列掩码来解决地形阴影、烧伤痕迹、多云或冰盖造成的已知问题… 地球物理 mod44w modis nasa srtm 地表地下水 -
美国本土 MODIS 初级生产总值

MODIS 美国本土初级生产总值 (GPP) 数据集使用美国本土的 MODIS 地表反射率来估计 GPP。GPP 是指生态系统中植物捕获的碳量,是净初级生产力 (NPP) 计算中的一个重要组成部分。GPP 的计算方式为… 8 天 美国本土 gpp gridmet 派生 mod09q1 mod17 -
美国本土 MODIS 初级净生产力

MODIS 美国本土净初级生产力 (NPP) 数据集使用美国本土的 MODIS 地表反射率来估计 NPP。NPP 是指生态系统中植物捕获的碳量,已扣除因呼吸作用而损失的碳量。NPP 是使用 MOD17 算法计算的(请参阅 MOD17 用户… conus gridmet-derived mod09q1 mod17 modis nlcd-derived -
MODOCGA.006 Terra 海洋反射率每日全球 1 公里
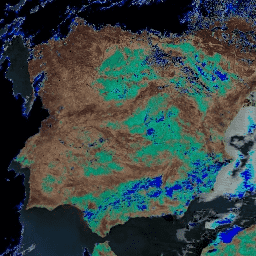
MODOCGA V6 海洋反射率产品包含来自 Terra MODIS 波段 8-16 的 1 公里反射率数据。该产品被称为海洋反射率,因为波段 8-16 主要用于生成海洋产品,但由于图块…,因此该产品并非海洋产品 daily global modis nasa ocean reflectance -
MTBS 过火面积边界

“燃烧严重程度监测趋势”(MTBS) 烧毁区域边界数据集包含美国本土、阿拉斯加、夏威夷和波多黎各所有当前已完成的 MTBS 火灾的烧毁区域范围多边形。NBR 下方是“归一化燃烧比”,而 dNBR 是指… EROS 火灾 gtac MTBS 表格 美国农业部 -
MYD08_M3.061 Aqua 大气月度全球产品

MYD08_M3 V6.1 是一种大气全球产品,包含大气形参的月度 1x1 度网格平均值。这些参数与大气气溶胶粒子属性、总臭氧负荷、大气水汽、云光学和物理属性以及大气稳定性指数有关。… aqua 大气 气候 地球物理 全球 modis -
MYD09A1.061 Aqua 地表反射率 8 天全球 500 米
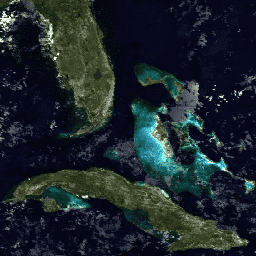
MYD09A1 V6.1 产品提供 Aqua MODIS 波段 1-7 在 500 米分辨率下的地表光谱反射率估计值,并针对气体、气溶胶和瑞利散射等大气条件进行了校正。除了七个反射率波段之外,还有一个质量层和四个观测… 8 天 aqua 全球 modis nasa 卫星图像 -
MYD09CMG.061 Aqua 地表反射率每日 L3 全球 0.05 度 CMG

MYD09CMG 版本 6.1 产品提供 Aqua 中等分辨率成像光谱辐射计 (MODIS) 波段 1 至 7 的地表光谱反射率估计值,这些值已重新采样为 5,600 米像素分辨率,并针对气体、气溶胶和瑞利散射等大气条件进行了校正。MYD09CMG 数据… aqua brightness-temperature ozone satellite-imagery surface-reflectance -
MYD09GA.061 Aqua 地表反射率每日全球 1 公里和 500 米
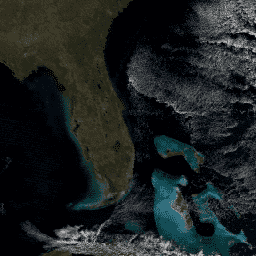
MODIS 地表反射率产品可提供地表光谱反射率的估计值,该值是在没有大气散射或吸收的情况下于地面测得的。低级别数据已针对大气气体和气溶胶进行校正。MYD09GA 版本 6.1 以 … 格式提供波段 1-7。 aqua daily global modis nasa satellite-imagery -
MYD09GQ.061 Aqua 地表反射率每日全球 250 米
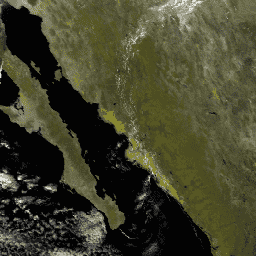
MODIS 地表反射率产品可提供地表光谱反射率的估计值,该值是在没有大气散射或吸收的情况下于地面测得的。低级别数据已针对大气气体和气溶胶进行校正。MYD09GQ 版本 6.1 提供波段 1 和 … aqua daily global modis nasa satellite-imagery -
MYD09Q1.061 Aqua 地表反射率 8 天全球 250 米
MYD09Q1 产品提供 250 米分辨率下波段 1 和 2 的地表光谱反射率估计值,并针对气体、气溶胶和瑞利散射等大气条件进行了校正。除了这两个反射率波段,还包括一个质量层。对于每个… 8 天 aqua 全球 modis nasa 卫星图像 -
MYD10A1.061 Aqua 积雪每日全球 500 米

MYD10A1 V6 Snow Cover Daily Global 500m 产品包含积雪覆盖率、积雪反照率、部分积雪覆盖率和质量评估 (QA) 数据。积雪覆盖率数据基于一种积雪测绘算法,该算法采用归一化差异积雪指数 (NDSI) 和其他标准测试。常规… albedo aqua cryosphere daily geophysical global -
MYD11A1.061 Aqua 地表温度与发射率每日全球 1 公里

MYD11A1 V6.1 产品以 1200 x 1200 公里网格提供每日地表温度 (LST) 和发射率值。温度值源自 MYD11_L2 扫描带产品。在 30 度纬度以上,部分像素可能有多项观测结果,其中晴空条件… aqua climate daily emissivity global lst -
MYD11A2.061 Aqua 地表温度与发射率 8 天全球 1 公里
MYD11A2 V6.1 产品以 1200 x 1200 公里网格提供平均 8 天地表温度 (LST)。MYD11A2 中的每个像素值都是在相应 8 天内收集的所有相应 MYD11A1 LST 像素的简单平均值。MYD11A2 会执行… 8 天 aqua climate emissivity global lst -
MYD13A1.061 Aqua 植被指数 16 天全球 500 米

MYD13A1 V6.1 产品以每个像素为基础提供植被指数 (VI) 值。主要有两个植被层。第一个是归一化差值植被指数 (NDVI),它被称为现有美国国家海洋和大气管理局 (NOAA) … 16-day aqua evi global modis nasa -
MYD13A2.061 Aqua 植被指数 16 天全球 1 公里

MYD13A2 V6.1 产品提供两种植被指数 (VI):归一化差值植被指数 (NDVI) 和增强型植被指数 (EVI)。NDVI 被称为连续性指数,可与现有的美国国家海洋和大气管理局-高级甚高分辨率辐射计 (NOAA-AVHRR) 派生的 NDVI 进行比较。… 16-day aqua evi global modis nasa -
MYD13A3.061 Aqua 植被指数月度 L3 全球 1 公里 SIN 网格
Aqua 中等分辨率成像光谱辐射计 (MODIS) 植被指数 (MYD13A3) 版本 6.1 数据以正弦投影网格化 3 级产品的形式按月提供,空间分辨率为 1 公里 (km)。在生成此月度产品时,该算法会提取所有 MYD13A2 产品,这些产品… aqua evi global modis monthly nasa -
MYD13C1.061:Aqua 植被指数 16 天 L3 全球 0.05 度 CMG

Aqua 中等分辨率成像光谱辐射计 (MODIS) 植被指数 16 天 (MYD13C1) 版本 6.1 产品以像素为单位提供植被指数 (VI) 值。主要有两个植被层。第一个是归一化差值植被指数 (NDVI),它与…保持连续性 16 天 aqua 全球 nasa usgs 植被 -
MYD13Q1.061 Aqua 植被指数 16 天全球 250 米

MYD13Q1 V6.1 产品以像素为单位提供植被指数 (VI) 值。主要有两个植被层。第一个是归一化差值植被指数 (NDVI),它被称为现有美国国家海洋和大气管理局 (NOAA) … 16-day aqua evi global modis nasa -
MYD14A1.061:Aqua 热异常和火灾每日全球 1 公里

MYD14A1 V6.1 数据集提供每日火灾掩膜合成数据,分辨率为 1 公里,基于 MODIS 4 微米和 11 微米辐射率得出。火灾检测策略基于对火灾的绝对检测(当火势足以检测到时)以及相对于…的检测。 aqua daily fire global modis nasa -
MYD14A2.061:Aqua 热异常与火灾 8 天全球 1 公里

MYD14A2 V6.1 数据集提供 1 公里分辨率的 8 天火灾掩码合成数据。它包含合成期内各个像素类的最大值。除了火点掩模之外,还提供了一个关联的质量信息层。文档:用户指南 - 算法理论基础… 8 天 aqua fire global modis nasa -
MYD15A2H.061:Aqua 叶面积指数/FPAR 8 天全球 500 米

MYD15A2H V6.1 MODIS 组合叶面积指数 (LAI) 和光合有效辐射吸收比 (FPAR) 产品是一个 8 天合成数据集,分辨率为 500 米。该算法会从 Aqua 传感器在 8 天内采集的所有像素中选择“最佳”像素。… 8 天 aqua fpar global lai modis -
MYD16A2.061:Aqua 净蒸发量 8 天 L4 全球 500 米 SIN 网格 V061
MYD16A2 版本 6.1 蒸散/潜热通量产品是一种 8 天合成产品,像素分辨率为 500 米。用于 MOD16 数据产品集合的算法基于 Penman-Monteith 方程的逻辑,其中包括每日气象再分析数据输入以及… 8 天 蒸发蒸腾 全球 modis nasa 水汽 -
MYD17A2H.061:Aqua 总初级生产力 8 天全球 500 米

MYD17A2H V6.1 总初级生产力 (GPP) 产品是 8 天的累积合成产品,分辨率为 500 米。该产品基于辐射利用效率概念,可作为数据模型的输入,用于计算陆地能量、碳、水循环过程以及… 8 天 aqua global gpp modis nasa -
MYD17A3HGF.061:Aqua 净初级生产力缺口填充年度全球 500 米

MYD17A3HGF V6.1 产品提供有关年总初级生产力 (GPP) 和净初级生产力 (NPP) 的信息,像素分辨率为 500 米。年 NPP 是根据指定年份的所有 8 天净光合作用(PSN) 产品 (MYD17A2H) 的总和得出的。PSN 值是 … 的差值 aqua global gpp nasa npp photosynthesis -
MYD21A1D.061 Aqua 地表温度和 3 波段发射率每日全球 1 公里
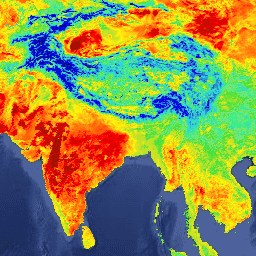
MYD21A1D 数据集每天由白天 2 级格网 (L2G) 中间 LST 产品生成,空间分辨率为 1,000 米。L2G 流程可将每日 MOD21 轨道分片数据映射到正弦 MODIS 网格,并存储落在网格单元格中的所有观测结果… aqua climate daily emissivity global lst -
MYD21A1N.061 Aqua 地表温度和 3 波段发射率每日全球 1 公里
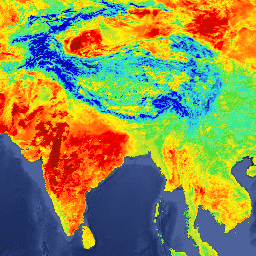
MYD21A1N 数据集每天由夜间 2 级格网 (L2G) 中间 LST 产品生成,空间分辨率为 1,000 米。L2G 流程可将每日 MOD21 轨道分片数据映射到正弦 MODIS 网格,并存储落在网格单元格中的所有观测结果… aqua climate daily emissivity global lst -
MYD21C1.061 Aqua 地表温度和 3 波段发射率每日 L3 全球 0.05 度 CMG

MYD21C1 数据集基于白天 2 级格网 (L2G) 中间 LST 产品,采用 0.05 度(赤道处约 5,600 米)气候模拟网格 (CMG) 每日生成。L2G 流程可将每日 MYD21 轨道分片数据映射到正弦 MODIS 网格,并存储所有… aqua climate daily emissivity global lst -
MYD21C2.061 Aqua 地表温度和 3 波段发射率 8 天 L3 全球 0.05 度 CMG

MYD21C2 数据集是一种 8 天合成 LST 产品,它使用基于简单平均方法的算法。该算法会计算 8 天内所有无云 MYD21A1D 和 MYD21A1N 每日采集的平均值。与 MYD21A1 数据集不同,… aqua climate emissivity global lst nasa -
MYD21C3.061 Aqua 地表温度和 3 波段发射率月度 L3 全球 0.05 度 CMG

MYD21C3 数据集是一种月度合成 LST 产品,它使用基于简单平均方法的算法。该算法会计算 8 天内所有无云 MYD21A1D 和 MYD21A1N 每日采集的平均值。与 MYD21A1 数据集不同,… aqua climate emissivity global lst monthly -
MYDOCGA.006 Aqua 海洋反射率每日全球 1 公里
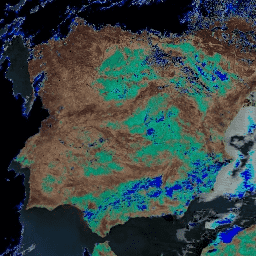
MYDOCGA V6 海洋反射率产品包含来自 Aqua MODIS 波段 8-16 的 1 公里反射率数据。该产品被称为海洋反射率,因为波段 8-16 主要用于生成海洋产品,但由于图块…,因此该产品并非海洋产品 aqua daily global modis nasa ocean -
Malaria Atlas Project 2015 年城市可达性

此全球可达性地图列出了 2015 年(基准年)北纬 85 度至南纬 60 度之间所有区域到达最近人口稠密区域的陆路旅行时间。人口稠密地区是指每平方公里有 1,500 名或更多居民的连续区域,或… 无障碍 malariaatlasproject 地图 人口 publisher-dataset -
Malaria Atlas Project 医疗保健可及性 2019 年

此全球可达性地图列出了 2019 年基准年期间,北纬 85 度至南纬 60 度之间所有区域到达最近医院或诊所的陆路旅行时间(以分钟为单位)。OpenStreetMap、Google 地图和学术研究人员正在开展大规模数据收集工作,… 无障碍 malariaatlasproject 地图 人口 publisher-dataset -
Malaria Atlas Project 2019 年医疗保健可及性(仅限步行)

此全球可达性地图列出了 2019 年基准年期间,北纬 85 度至南纬 60 度之间所有区域到达最近医院或诊所的陆路旅行时间(以分钟为单位)。此表面基于“仅步行”的出行时间,使用非机动交通工具… 无障碍 malariaatlasproject 地图 人口 publisher-dataset -
Malaria Atlas Project 全球摩擦表面 2015 年

Friction Surface 2019”。此全球摩擦表面列出了 2015 年基准年所有陆地像素(位于北纬 85 度和南纬 60 度之间)的陆地旅行速度。此地图由牛津大学疟疾地图集项目 (MAP)、Google、… 无障碍 malariaatlasproject 地图 人口 publisher-dataset -
Malaria Atlas Project 全球摩擦表面 2019 年

此全球摩擦表面列出了 2019 年基准年北纬 85 度至南纬 60 度之间所有陆地像素的陆地旅行速度。此地图由 MAP(牛津大学)、Telethon Kids Institute(澳大利亚珀斯)、Google 和 … 无障碍 malariaatlasproject 地图 人口 publisher-dataset -
Malaria Atlas Project 全球摩擦表面 2019 年(仅限步行)

此全球摩擦表面列出了 2019 年基准年北纬 85 度至南纬 60 度之间所有陆地像素的陆地旅行速度。此面积是根据“仅步行”的出行速度计算的,仅使用非机动交通工具。此地图是通过… 无障碍 malariaatlasproject 地图 人口 publisher-dataset -
MapBiomas 土地利用和土地覆盖 - 巴西 V1.0

巴西的 MapBiomas 土地利用和土地覆盖 (LULC) 数据集由 MapBiomas 项目每年使用 Landsat 卫星图像和机器学习分类技术生成。该数据集以 30 米的分辨率提供一致且主题详细的地图,涵盖数十年,每年都会更新。每个图片… 基于 Landsat 的 土地利用-土地覆盖 发布者-数据集 -
MethaneAIR L3 浓度 v1

此数据集提供甲烷空气成像光谱仪观测到的大气中甲烷总柱干空气摩尔分数“XCH4”的地理空间数据。XCH4 定义为甲烷(“CH4”)的总柱含量(分子数)除以总含量… 大气 气候 edf 排放 ghg 甲烷 -
MethaneAIR L4 面积源 v1

区域排放模型仍在开发中,不代表最终产品。此数据集使用 MethaneAIR 飞行测量数据(专注于美国各地产油气地区)提供空间上分解的甲烷排放通量 (kg/hr)。调查的总排放量… 大气 气候 edf 排放 ghg 甲烷 -
MethaneAIR L4 点源 v1

此数据集提供了以下区域的高排放甲烷点源检测数据(千克/小时):从西部的科罗拉多州、新墨西哥州和得克萨斯州到东部的宾夕法尼亚州、俄亥俄州和西弗吉尼亚州的 13 个石油和天然气或煤炭开采区,以及 3 个城市区域(纽约市、… 大气 气候 edf 排放 ghg 甲烷 -
MethaneSAT L3 浓度公开预览版 V1.0.0
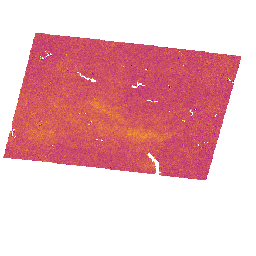
此早期“公开预览版”数据集提供从 MethaneSAT 成像光谱仪的测量结果中检索到的甲烷在大气中的柱平均干空气摩尔分数“XCH4”的地理空间数据。XCH4 定义为…的总柱含量(单位表面积上方的分子数量) atmosphere climate edf edf-methanesat-ee emissions ghg -
MethaneSAT L4 区域源公开预览版 V1.0.0
分散区域排放模型仍在开发中,不代表最终产品。此早期“公开预览版”数据集可提供分散区域源的甲烷排放高精度数据。这些排放数据来自美国… atmosphere climate edf edf-methanesat-ee emissions ghg -
MethaneSAT L4 区域源公开预览版 V2.0.0
分散区域排放模型仍在开发中,不代表最终产品。此早期“公开预览版”数据集可提供分散区域源的甲烷排放高精度数据。这些新颖的测量结果表明,高精度量化甲烷总排放量对于…至关重要 atmosphere climate edf edf-methanesat-ee emissions ghg -
MethaneSAT L4 点源公开预览版 V1.0.0

此早期“公开预览版”数据集可提供来自离散点源的甲烷排放高精度数据。这些甲烷排放通量是使用专门用于利用… atmosphere climate edf edf-methanesat-ee emissions ghg -
监测烧伤严重程度趋势 (MTBS) 烧伤严重程度图片

火灾严重程度镶嵌图包含美国本土、阿拉斯加、夏威夷和波多黎各所有当前已完成的 MTBS 火灾的 MTBS 火灾严重程度类别专题栅格图像。镶嵌的烧伤严重程度图像每年都会按美国各州和… EROS 火灾 森林 gtac 土地覆盖 Landsat 衍生 -
多源观测全球海洋表层盐度与表层密度:每日、多年重新处理
“多源观测全球海洋表层盐度与表层密度”是一种海洋学产品,可提供每日、全球范围、无数据缺口的 1/8 度高分辨率海表盐度 (SSS) 和海表密度 (SSD) L4 级分析结果。此商品由…生成 哥白尼 海洋 大洋 -
多源观测全球海洋表层盐度与表层密度:每日近实时数据集
“多源观测全球海洋表层盐度与表层密度”是一种海洋学产品,可提供每日、全球范围、无数据缺口的 1/8 度高分辨率海表盐度 (SSS) 和海表密度 (SSD) L4 级分析结果。此商品由…生成 哥白尼 海洋 大洋 -
Murray 全球潮间带变化分类

Murray 全球潮间带变化数据集包含潮滩生态系统的全球地图,这些地图是通过对 707,528 张 Landsat 归档图像进行监督分类而生成的。每个像素都参考一组全球分布的训练数据,被分类为潮滩、永久性水体或其他。… coastal google intertidal landsat-derived murray surface-ground-water -
Murray 全球潮间带变化数据掩码

Murray 全球潮间带变化数据集包含潮滩生态系统的全球地图,这些地图是通过对 707,528 张 Landsat 归档图像进行监督分类而生成的。每个像素都参考一组全球分布的训练数据,被分类为潮滩、永久性水体或其他。… coastal google intertidal landsat-derived murray surface-ground-water -
Murray 全球潮间带变化 QA 像素数

Murray 全球潮间带变化数据集包含潮滩生态系统的全球地图,这些地图是通过对 707,528 张 Landsat 归档图像进行监督分类而生成的。每个像素都参考一组全球分布的训练数据,被分类为潮滩、永久性水体或其他。… coastal google intertidal landsat-derived murray surface-ground-water -
Murray 全球潮汐湿地变化 v1.0 (1999-2019)

Murray Global Tidal Wetland Change Dataset 包含潮汐湿地的全球范围及其变化的地图。这些地图是根据三阶段分类法开发的,旨在 (i) 估计潮汐湿地(定义为潮汐沼泽、潮汐…)的全球分布, 沿海 生态系统 潮间带 Landsat 衍生 红树林 默里 -
NAIP:美国国家农业影像计划

美国国家农业影像计划 (NAIP) 在美国大陆的农业生长季期间获取航空影像。NAIP 项目每年都会根据可用资金和影像获取周期签订合同。自 2003 年起,NAIP 以 5 年为周期进行采集。2008 年是… 农业 高分辨率 影像 正射影像 美国农业部 -
NASA SRTM 数字高程 30 米
航天飞机雷达地形测绘任务 (SRTM,参见 Farr 等人,2007 年) 数字高程数据是一项国际研究工作,旨在获取近乎全球范围的数字高程模型。此 SRTM V3 产品 (SRTM Plus) 由 NASA JPL 提供,分辨率为 1 角秒… dem 海拔 海拔地形 地球物理 nasa srtm -
NASADEM:NASA 30 米数字高程模型
NASADEM 是对 SRTM 数据的重新处理,通过纳入来自 ASTER GDEM、ICESat GLAS 和 PRISM 数据集的辅助数据,提高了准确性。最重要的处理改进包括通过改进的相位解包裹来减少空隙,以及使用 ICESat GLAS 数据进行控制。文档:用户指南 dem 海拔 海拔地形 地球物理 nasa srtm -
NCEP-DOE 再分析 2(高斯网格),总云量

NCEP-DOE Reanalysis 2 项目使用最先进的分析/预测系统,利用 1979 年到前一年的历史数据执行数据同化。 atmosphere climate cloud geophysical ncep noaa -
NCEP/NCAR 再分析数据,海平面气压

NCEP/NCAR 再分析项目是美国国家环境预报中心(NCEP,前身为“NMC”)和美国国家大气研究中心(NCAR)的联合项目。这项联合工作的目标是使用历史数据生成新的大气分析,并… atmosphere climate geophysical ncep noaa pressure -
NCEP/NCAR 再分析数据,地表温度

NCEP/NCAR 再分析项目是美国国家环境预报中心(NCEP,前身为“NMC”)和美国国家大气研究中心(NCAR)的联合项目。这项联合工作的目标是使用历史数据生成新的大气分析,并… 大气 气候 地球物理 ncep noaa 重新分析 -
NCEP/NCAR 再分析数据,水蒸气

NCEP/NCAR 再分析项目是美国国家环境预报中心(NCEP,前身为“NMC”)和美国国家大气研究中心(NCAR)的联合项目。这项联合工作的目标是使用历史数据生成新的大气分析,并… 大气 气候 地球物理 ncep noaa 重新分析 -
NEON 冠层高度模型 (CHM)

冠层顶部相对于裸地的海拔高度(冠层高度模型;CHM)。CHM 源自 NEON LiDAR 点云,通过在 LiDAR 调查的整个空间域内创建连续的冠层高度估计值表面来生成。… 机载 冠层 森林 森林生物质 激光雷达 NEON -
NEON 数字高程模型 (DEM)
根据 NEON LiDAR 数据得出的地表 (DSM) 和地形 (DTM) 数字模型。DSM:地表特征(包含植被和人造结构的地形信息)。DTM:裸地海拔(已移除植被和人造结构的地形信息)。图片以米为单位显示了平均海平面以上的… 机载 DEM 海拔地形 森林 激光雷达 NEON -
NEON RGB 相机图像

高分辨率红-绿-蓝 (RGB) 正射校正相机图像,使用最近邻重采样进行镶嵌并输出到固定的均匀空间网格;空间分辨率为 0.1 米。数码相机是 NEON 机载观测平台 (AOP) 上的一套仪器的一部分,该平台还包括… airborne forest highres neon neon-prod-earthengine orthophoto -
NEON 表面双向反射率

NEON AOP 地表双向反射率是一种高光谱 VSWIR(可见光到短波红外)数据产品,包含 426 个波段,波长范围约为 380 nm 至 2510 nm。反射率按 10000 的系数进行缩放。将 1340-1445 nm 和 1790-1955 nm 之间的波长设置为… 机载 森林 高光谱 neon neon-prod-earthengine publisher-dataset -
NEON 表面定向反射率

NEON AOP 地表定向反射率是一种高光谱 VSWIR(可见光到短波红外)数据产品,包含 426 个波段,波长范围约为 380 nm 到 2510 nm。反射率按 10000 的系数进行缩放。将 1340-1445 nm 和 1790-1955 nm 之间的波长设置为… 机载 森林 高光谱 neon neon-prod-earthengine publisher-dataset -
NEX-DCP30:NASA 地球交换降尺度气候预测的集成统计数据

NASA NEX-DCP30 数据集包含美国本土的降尺度气候情景,这些情景源自在耦合模式比较项目第 5 阶段(CMIP5,参见 Taylor 等人,2012 年)下开展的通用环流模型 (GCM) 运行,并涵盖四种温室气体… cag climate cmip5 geophysical ipcc nasa -
NEX-DCP30:NASA Earth Exchange 降尺度气候预测

NASA NEX-DCP30 数据集包含美国本土的降尺度气候情景,这些情景源自在耦合模式比较项目第 5 阶段(CMIP5,参见 Taylor 等人,2012 年)下开展的通用环流模型 (GCM) 运行,并涵盖四种温室气体… cag climate cmip5 geophysical ipcc nasa -
NEX-GDDP-CMIP6:NASA 地球交换全球每日降尺度气候预测

NEX-GDDP-CMIP6 数据集包含全球降尺度气候情景,这些情景源自在耦合模式比较项目第 6 阶段 (CMIP6,参见 Thrasher 等人,2022 年) 下进行的一般环流模型 (GCM) 运行,并涵盖四种“第 1 级”温室气体排放情景中的两种… cag climate gddp geophysical ipcc nasa -
NEX-GDDP:NASA Earth Exchange 全球每日降尺度气候预测

NASA NEX-GDDP 数据集包含全球降尺度气候情景,这些情景源自在耦合模式比较项目第 5 阶段 (CMIP5,参见 Taylor 等人,2012 年) 下开展的通用环流模型 (GCM) 运行,并涵盖四种温室气体排放情景中的两种。 cag climate cmip5 gddp geophysical ipcc -
NICFI 卫星数据计划 - 热带森林监测底图 - 非洲
此图片集提供对热带地区的高分辨率卫星监测数据,主要目的是减少和扭转热带森林的损失,助力应对气候变化、保护生物多样性、促进森林再生、恢复和增强,以及推动可持续发展,所有这些都… basemaps forest nicfi planet planet-nicfi publisher-dataset -
NICFI 卫星数据计划热带森林监测基本地图 - 美洲
此图片集提供对热带地区的高分辨率卫星监测数据,主要目的是减少和扭转热带森林的损失,助力应对气候变化、保护生物多样性、促进森林再生、恢复和增强,以及推动可持续发展,所有这些都… basemaps forest nicfi planet planet-nicfi publisher-dataset -
NICFI 卫星数据计划热带森林监测基本地图 - 亚洲
此图片集提供对热带地区的高分辨率卫星监测数据,主要目的是减少和扭转热带森林的损失,助力应对气候变化、保护生物多样性、促进森林再生、恢复和增强,以及推动可持续发展,所有这些都… basemaps forest nicfi planet planet-nicfi publisher-dataset -
NLCD 2019:美国地质调查局国家土地覆盖数据库,2019 年发布
NLCD(美国国家土地覆盖数据库)是一个基于 Landsat 的 30 米土地覆盖数据库,涵盖 8 个时间段(2001 年、2004 年、2006 年、2008 年、2011 年、2013 年、2016 年和 2019 年)。您还可以在此处查看 2021 年的第九个周期。这些图片依赖于不透水性数据层来显示城市… blm landcover landuse-landcover mrlc nlcd usgs -
NLCD 2021:美国地质调查局国家土地覆盖数据库,2021 年发布
美国地质调查局 (USGS) 与多个联邦机构合作,现已开发并发布了七个国家土地覆盖数据库 (NLCD) 产品:NLCD 1992、2001、2006、2011、2016、2019 和 2021。自 2016 年发布以来,地表覆盖产品每隔 2-3 年创建一次… blm landcover landuse-landcover mrlc nlcd usgs -
NLDAS-2:北美陆面数据同化系统驱动场

陆面数据同化系统 (LDAS) 会结合多种观测源(例如雨量计数据、卫星数据和雷达降水测量数据),生成地表或近地表气候属性的估计值。此数据集是北美陆面数据同化系统 (NLDAS-2) 第 2 阶段的主要(默认)驱动文件(文件 A)… climate evaporation forcing geophysical hourly humidity -
NOAA AVHRR Pathfinder 第 5.3 版整理的全球 4 公里海表温度

AVHRR Pathfinder 第 5.3 版海面温度数据集 (PFV53) 是由 NOAA 国家海洋数据中心和迈阿密大学的 Rosenstiel 海洋与大气科学学院合作制作的全球性海面温度数据,每天更新两次,分辨率为 4 公里。PFV53 … avhrr noaa oceans sst temperature wind -
NOAA CDR AVHRR AOT:全球海洋上的每日气溶胶光学厚度,版本 04

气溶胶光学厚度 (AOT) 的 NOAA 气候数据记录 (CDR) 是一组全球每日 0.1 度派生数据,这些数据来自 PATMOS-x AVHRR 2b 级通道 1(0.63 微米)轨道晴空辐射。气溶胶产品是在无云条件下,根据 … 期间的 AVHRR 影像生成的 aerosol atmosphere atmospheric avhrr cdr daily -
NOAA CDR AVHRR LAI FAPAR:叶面积指数和光合有效辐射吸收比,版本 5

AVHRR 叶面积指数 (LAI) 和光合有效辐射吸收比 (FAPAR) NOAA 气候数据记录 (CDR) 数据集包含表征植物冠层和光合活动的派生值。此数据集派生自 NOAA AVHRR 地表反射率产品,并且… avhrr cdr daily fapar lai land -
NOAA CDR AVHRR NDVI:归一化差值植被指数,版本 5

AVHRR 常态化差值植生指标 (NDVI) 的 NOAA 气候数据记录 (CDR) 包含从 NOAA AVHRR 地表反射率产品中得出的网格化每日 NDVI。它提供了一种地表植被覆盖活动测量方法,以 0.05° 的分辨率进行网格化,并在全球陆地上进行计算… avhrr cdr daily land ndvi noaa -
NOAA CDR AVHRR:地表反射率,版本 5

AVHRR 地表反射率的 NOAA 气候数据记录 (CDR) 包含网格化每日地表反射率和亮度温度,这些数据源自七颗 NOAA 极地轨道卫星上搭载的高级甚高分辨率辐射计 (AVHRR) 传感器。数据以 0.05° 的分辨率网格化,并计算… avhrr cdr daily land noaa reflectance -
NOAA CDR GRIDSAT-B1:地球静止红外通道亮度温度

注意:由于基础设施正在更新,自 2024-03-31 以来,提供方一直未更新此数据集。目前尚无数据集更新恢复时间表。此数据集提供来自地球静止卫星的全球红外测量高质量气候数据记录 (CDR)。… 亮度 cdr 气候 红外 noaa 反射率 -
NOAA CDR OISST v02r01:最佳插值海面温度

NOAA 1/4 度每日最佳插值海表温度 (OISST) 通过在规则的全球网格上合并来自不同平台(卫星、船舶、浮标)的偏差调整观测结果来构建完整海洋温度场,并通过插值填充缺口。来自高级甚高分辨率…的卫星数据 avhrr cdr daily ice noaa ocean -
NOAA CDR PATMOSX:云属性、反射率和亮度温度,版本 5.3

此数据集提供多种云属性的高质量气候数据记录 (CDR),以及高级甚高分辨率辐射计 (AVHRR) Pathfinder Atmospheres Extended (PATMOS-x) 亮度温度和反射率。这些数据已拟合到 0.1 x 0.1 的等角度网格,其中包含升序和… atmospheric avhrr brightness cdr climate cloud -
NOAA CDR VIIRS LAI FAPAR:叶面积指数和光合有效辐射吸收比,版本 1

此气候数据记录 (CDR) 结合了叶面积指数 (LAI) 和光合有效辐射吸收比 (FAPAR) 数据集,这两个生物物理变量可用于评估植被压力、预测农业产量并支持其他建模和资源管理工作。LAI 跟踪单位地表面积的单侧… cdr daily fapar lai land noaa -
NOAA CDR VIIRS NDVI:归一化差值植被指数,版本 1

此数据集包含网格化每日归一化差值植被指数 (NDVI),该指数源自 NOAA 可见光红外成像辐射计套件 (VIIRS) 地表反射率的气候数据记录 (CDR)。数据记录涵盖了 2014 年至今,使用的是 NOAA 极地轨道卫星的数据。这些数据是根据…预测的 cdr daily land ndvi noaa vegetation-indices -
NOAA CDR WHOI:海面温度,版本 2

“海面温度 - WHOI”数据集是 NOAA 海洋表面数据包 (OSB) 的一部分,可提供无冰海洋的高质量海面温度气候数据记录 (CDR)。SST 值是通过对昼夜变化进行建模并结合…来确定的 atmospheric cdr hourly noaa ocean oceans -
NOAA CDR:海洋热通量,版本 2

海洋热通量数据集是 NOAA 海洋表面捆绑包 (OSB) 的一部分,提供无冰海洋上空空气/海洋热通量的高质量气候数据记录 (CDR)。此数据集是根据近地表大气和海洋的 OSB CDR 形参计算得出的,… atmospheric cdr flux heat hourly noaa -
NOAA CDR:海洋近地表大气属性,版本 2

“海洋近地表大气属性”数据集是 NOAA 海洋表面捆绑包 (OSB) 的一部分,可提供冰封海洋表面上方空气温度、风速和比湿的高质量气候数据记录 (CDR)。这些大气属性是根据亮度温度计算得出的… atmospheric cdr hourly humidity noaa ocean -
NOAA NHC HURDAT2 大西洋飓风目录

飓风最佳轨迹数据库 (HURDAT2)。大西洋盆地,1851 年至 2018 年。 climate hurricane nhc noaa table weather -
NOAA NHC HURDAT2 太平洋飓风目录

飓风最佳轨迹数据库 (HURDAT2)。太平洋盆地,1949-2018 年。 climate hurricane nhc noaa table weather -
2020 年世界天然森林

“世界天然森林 2020”提供了一张 2020 年全球天然森林概率地图,分辨率为 10 米。该工具的开发旨在支持欧盟的《森林砍伐法规》(EUDR) 等举措,以及其他森林保护和监测工作。地图… biodiversity climate conservation deforestation eudr forest -
荷兰正射影像
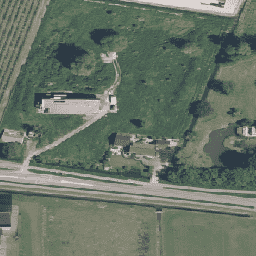
荷兰正射影像是一组彩色正射影像。每年收集两张全国范围的航空照片:一张是春季拍摄的无叶照片,分辨率为 7.5 厘米;另一张是夏季拍摄的树木有叶照片,分辨率为 25 厘米。如需了解详情,请参阅… 荷兰 正射影像 RGB -
OGIM:石油和天然气基础设施测绘数据库 v2.5.1
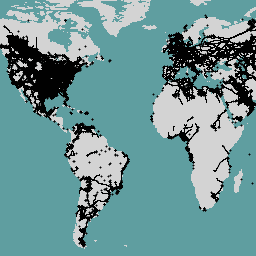
此数据集提供全球石油和天然气 (O&G) 相关基础设施的位置信息。石油和天然气基础设施地图 (OGIM) 数据库是由美国环保协会 (EDF) 和 MethaneSAT LLC(EDF 的全资子公司)共同开发的项目。开发…的主要目标是… edf 排放 ghg 基础设施边界 甲烷 甲烷空气 -
海洋颜色 SMI:标准映射图像 MODIS Aqua 数据

此 3 级产品包括在 EOSDIS 下生成或收集的海洋颜色和卫星海洋生物学数据。此数据集可用于研究沿海地区的生物学和水文学、沿海海洋生境的多样性和地理分布变化、生物地球化学通量和… 生物学 叶绿素 modis nasa 海洋 oceandata -
海洋颜色 SMI:标准映射图像 MODIS Terra 数据

此 3 级产品包括在 EOSDIS 下生成或收集的海洋颜色和卫星海洋生物学数据。此数据集可用于研究沿海地区的生物学和水文学、沿海海洋生境的多样性和地理分布变化、生物地球化学通量和… 生物学 叶绿素 modis nasa 海洋 oceandata -
海洋颜色 SMI:标准映射图像 SeaWiFS 数据

此 3 级产品包括在 EOSDIS 下生成或收集的海洋颜色和卫星海洋生物学数据。此数据集可用于研究沿海地区的生物学和水文学、沿海海洋生境的多样性和地理分布变化、生物地球化学通量和… biology chlorophyll nasa ocean oceandata oceans -
Open Buildings Temporal V1
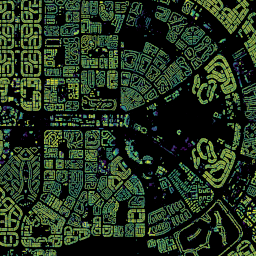
Open Buildings 2.5D Temporal Dataset 包含 2016 年至 2023 年间以每年为周期的数据,这些数据涉及建筑物存在情况、建筑物数量(以分数表示)和建筑物高度,有效空间分辨率为 4 米(栅格分辨率为 0.5 米)。它是由来自…的开源低分辨率图像制作而成 africa annual asia built-up height open-buildings -
Open Buildings V3 多边形
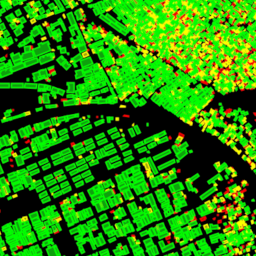
此大规模开放数据集包含从高分辨率 50 厘米卫星图像中提取的建筑物轮廓。该数据集包含非洲、拉丁美洲、加勒比地区、南亚和东南亚的 18 亿个建筑物检测结果。推断范围覆盖了 5,800 万平方公里的区域。对于此数据集中的每栋建筑物… africa asia building built-up open-buildings population -
OpenET DisALEXI 月度蒸散量 v2.0

大气-陆地交换逆向 / 大气-陆地交换逆向的分解 (ALEXI/DisALEXI) DisALEXI 最近已作为 OpenET 框架的一部分移植到 Google Earth Engine,Anderson 等人 (2012 年、2018 年) 介绍了基准 ALEXI/DisALEXI 模型结构。ALEXI 蒸发蒸腾 (ET) 模型专门用于… 蒸发蒸腾 基于 GridMET 的 基于 Landsat 的 月度 OpenET 水 -
OpenET Ensemble Monthly Evapotranspiration v2.0

OpenET 数据集包含基于卫星的数据,这些数据反映了通过蒸发蒸腾 (ET) 过程从地表转移到大气中的总水量。OpenET 提供来自多个卫星驱动模型的 ET 数据,还会根据这些数据计算出一个“集成值”,… 蒸发蒸腾 基于 GridMET 的 基于 Landsat 的 月度 OpenET 水 -
OpenET PT-JPL 月度蒸发蒸腾 v2.0

Priestley-Taylor Jet Propulsion Laboratory (PT-JPL) OpenET 框架中 PT-JPL 模型的核心公式与 Fisher 等人 (2008) 详述的原始公式相比没有变化。不过,我们对 PT-JPL 的模型输入和时间积分进行了增强和更新,以考虑… 蒸发蒸腾 基于 GridMET 的 基于 Landsat 的 月度 OpenET 水 -
OpenET SIMS 月度蒸散量 v2.0

卫星灌溉管理支持 NASA 卫星灌溉管理支持 (SIMS) 模型最初旨在支持对灌溉土地的作物系数和蒸发蒸腾 (ET) 进行卫星测绘,并增加对这些数据的访问权限,以支持在灌溉调度和区域评估中使用这些数据… 蒸发蒸腾 基于 GridMET 的 基于 Landsat 的 月度 OpenET 水 -
OpenET SSEBop 月度蒸发蒸腾量 v2.0

简化版业务化地表能量平衡模型 (SSEBop) Senay 等人 (2013 年、2017 年) 提出的简化版业务化地表能量平衡模型 (SSEBop) 是一种基于热量的简化地表能量模型,用于根据卫星湿度测量原理 (Senay 2018 年) 估算实际蒸散量。OpenET SSEBop 实现使用 … 蒸发蒸腾 基于 GridMET 的 基于 Landsat 的 月度 OpenET 水 -
OpenET eeMETRIC 月度蒸发蒸腾量 v2.0

Google Earth Engine 对 Mapping Evapotranspiration at high Resolution with Internalized Calibration 模型 (eeMETRIC) 的实现 eeMETRIC 应用了 Allen 等人 (2007 年;2015 年) 和 Allen 等人 (2013b 年) 的高级 METRIC 算法和流程,其中近地表气温与… 蒸发蒸腾 基于 GridMET 的 基于 Landsat 的 月度 OpenET 水 -
OpenET geeSEBAL 月度蒸发蒸腾 v2.0

最近,我们已在 OpenET 框架内完成 geeSEBAL 的实现,您可以在 Laipelt 等人 (2021) 的论文中找到当前 geeSEBAL 版本的概览,该版本基于 Bastiaanssen 等人 (1998) 开发的原始算法。OpenET geeSEBAL 实现使用土地… 蒸发蒸腾 基于 GridMET 的 基于 Landsat 的 月度 OpenET 水 -
OpenLandMap 粘土含量

6 个标准深度(0、10、30、60、100 和 200 厘米)的黏土含量(以百分比表示,单位为千克 / 千克),分辨率为 250 米。基于对全球土壤剖面和样本的机器学习预测。您可以点击此处详细了解处理步骤。南极洲是… clay envirometrix opengeohub openlandmap soil usda -
OpenLandMap 长期地表温度月度白天中位数

地表温度昼间月度平均值(2000 年至 2017 年)。基于 R 语言的 data.table 包和分位函数推导。如需详细了解 MODIS LST 产品,请参阅此页面。不包括南极洲。如需在 Earth Engine 之外访问和直观呈现地图,请使用此页面。… climate envirometrix lst mod11a2 modis monthly -
OpenLandMap 长期地表温度昼间月度标准差

基于 2000-2017 年时间序列的 1 公里分辨率 MODIS 地表温度长期昼夜温差标准差。基于 R 语言的 data.table 包和分位函数推导。如需详细了解 MODIS LST 产品,请参阅此页面。不包括南极洲。如需访问… climate envirometrix lst mod11a2 modis monthly -
OpenLandMap 长期地表温度月度昼夜差

基于 2000-2017 年时间序列的 1 公里分辨率 MODIS 地表温度长期昼夜差。基于 R 语言的 data.table 包和分位函数推导。如需详细了解 MODIS LST 产品,请参阅此页面。不包括南极洲。如需访问和直观呈现… climate day envirometrix lst mod11a2 modis -
OpenLandMap 生物群系的潜在分布

潜在的天然植被生物群系类别全球预测(基于使用 BIOMES 6000 数据集的“当前生物群系”类别进行的预测)。潜在天然植被 (PNV) 是与气候处于平衡状态的植被覆盖,存在于未受人类活动影响的给定位置。PNV 非常有用… ecosystems envirometrix opengeohub openlandmap potential -
OpenLandMap 潜在 FAPAR 月度数据

潜在的天然植被 FAPAR 预测月度中位数(基于 PROB-V FAPAR 2014-2017)。说明。如需在 Earth Engine 之外访问和直观呈现地图,请使用此页面。如果您在 LandGIS 地图中发现 bug、伪影或不一致之处,或者有任何疑问,请使用… envirometrix fapar monthly opengeohub openlandmap plant-productivity -
OpenLandMap 月度降水

基于 SM2RAIN-ASCAT 2007-2018、IMERG、CHELSA Climate 和 WorldClim 的月降水量(毫米),分辨率为 1 公里。使用 gdalwarp(三次样条)和 WorldClim、CHELSA Climate 与 IMERG 月度产品之间的平均值(例如,请参阅“3B-MO-L.GIS.IMERG.20180601.V05B.tif”)将分辨率下调至 1 公里。权重高出 3 倍… envirometrix imerg monthly opengeohub openlandmap precipitation -
OpenLandMap 预测的 Hapludalfs 概率

预测的 250 米 USDA 土壤大群组(概率)。基于全球土壤剖面汇编的机器学习预测结果的美国农业部土壤大组分布。如需详细了解土壤大类群,请参阅《Illustrated Guide to Soil Taxonomy - NRCS》(土壤分类图解指南 - NRCS)… envirometrix opengeohub openlandmap soil -
OpenLandMap 沙含量

沙含量(以百分比表示,单位为 kg / kg),以 250 米分辨率显示 6 个标准深度(0、10、30、60、100 和 200 厘米)的沙含量。基于对全球土壤剖面和样本的机器学习预测。您可以点击此处详细了解处理步骤。南极洲是… envirometrix opengeohub openlandmap sand soil usda -
OpenLandMap 土壤容重

土壤容重(细土)10 x kg / m3,分辨率为 250 米,有 6 个标准深度(0、10、30、60、100 和 200 厘米)。您可以点击此处详细了解处理步骤。不包括南极洲。如需访问和直观呈现 Google 地球以外的地图… density envirometrix opengeohub openlandmap soil -
OpenLandMap 土壤有机碳含量

土壤有机碳含量(单位:5 克 / 千克),以 250 米分辨率预测,基于全球土壤点汇编,在 6 个标准深度(0、10、30、60、100 和 200 厘米)下进行预测。您可以点击此处详细了解处理步骤。不包括南极洲。… carbon envirometrix opengeohub openlandmap soil -
OpenLandMap 土壤质地类别(美国农业部系统)

6 个土壤深度(0、10、30、60、100 和 200 厘米)的土壤质地类别(美国农业部系统),以 250 米为单位。根据预测的土壤质地分数得出,使用 R 中的 soiltexture 软件包。您可以点击此处详细了解处理步骤。不包括南极洲。如需访问… envirometrix opengeohub openlandmap 土壤 usda -
OpenLandMap 33kPa(田间持水量)下的土壤含水量

在 6 个标准深度(0、10、30、60、100 和 200 厘米)以 250 米分辨率预测的 33kPa 和 1500kPa 吸力下的土壤含水量(体积百分比)训练点基于全球土壤剖面汇编:USDA NCSS AfSPDB ISRIC WISE EGRPR SPADE… envirometrix opengeohub openlandmap soil -
OpenLandMap 土壤 pH 值(在 H2O 中)

6 个标准深度(0、10、30、60、100 和 200 厘米)的土壤 pH 值(以 H2O 为单位),分辨率为 250 米。处理步骤在此处进行了详细说明。不包括南极洲。如需在 Earth Engine 之外访问和直观呈现地图,请使用此页面。如果您… envirometrix opengeohub openlandmap ph soil -
OpenLandMap USDA 土壤分类大群组

250 米分辨率下预测的美国农业部土壤大组概率。基于全球土壤剖面汇编的机器学习预测结果的美国农业部土壤大组分布。如需详细了解土壤大类群,请参阅《Illustrated Guide to Soil Taxonomy》- NRCS - … envirometrix opengeohub openlandmap 土壤 usda -
牛津 MAP:疟疾地图集项目分数国际地圈-生物圈计划地表覆盖

此地表覆盖产品的基础数据集是 MODIS 年度地表覆盖产品 (MCD12Q1) 中的 IGBP 层。此数据从类别格式(分辨率约为 500 米)转换为分数产品,表示输出的整数百分比 (0-100) … landcover landuse-landcover map -
Oya:5 公里准全球降水估计

降水估计,尚未经过正式的同行评审。很快就会在 arXiv 上发布。** Oya 是一个准全球高分辨率降水估计数据集,源自静止轨道 (GEO) 卫星观测数据。Oya 模型利用了来自 … 的全光谱可见光和红外 (VIS-IR) 通道 气候 地球物理 gpm 预审核 降水 publisher-dataset -
PALSAR-2 ScanSAR Level 2.2

25 米 PALSAR-2 ScanSAR 是 PALSAR-2 广域观测模式的归一化后向散射数据,观测宽度为 350 公里。SAR 影像使用 ALOS World 3D - 30 米 (AW3D30) 数字地表模型进行了正射校正和坡度校正。偏振数据存储在… alos2 eroc jaxa palsar2 radar sar -
PERSIANN-CDR:使用人工神经网络从遥感信息中估计降水 - 气候数据记录

PERSIANN-CDR 是一种准全球每日降水产品,涵盖 1983 年 1 月 1 日至今的时期。数据按季度生成,通常会有三个月的延迟。该产品由加利福尼亚大学尔湾分校的水文气象学和遥感中心开发… cdr climate geophysical noaa precipitation weather -
PML_V2.2a:耦合的蒸发蒸腾和初级生产总值 (GPP)

该数据集由大规模水文实验室制作,该实验室专门通过将多源地球观测数据与基于过程的建模相结合,推进全球和区域水循环研究。PML-V2.2a 产品提供 500 米分辨率的 8 天全球陆地蒸散量 (ET) 和总初级生产力 (GPP),数据来自… 蒸发蒸腾 gpp 植物生产力 publisher-dataset 水汽 -
PRISM 每日空间气候数据集

PRISM 日度数据集和月度数据集是由俄勒冈州立大学 PRISM 气候小组制作的美国本土网格化气候数据集。此集合包含 AN81 和 AN91 数据,由“dataset_type”属性指示。网格是使用 PRISM(Parameter-elevation Regressions … climate daily geophysical oregonstate precipitation pressure -
PRISM 长期平均气候数据集 Norm91m

PRISM 日度数据集和月度数据集是由俄勒冈州立大学 PRISM 气候小组制作的美国本土网格化气候数据集。网格是使用 PRISM(独立斜率模型上的形参-海拔回归)开发的。PRISM 插值例程可模拟天气和气候的变化方式… 气候 地球物理 俄勒冈州立大学 降水 压力 prism -
PRISM 月度空间气候数据集 ANm

PRISM 日度数据集和月度数据集是由俄勒冈州立大学 PRISM 气候小组制作的美国本土网格化气候数据集。此集合包含 AN81 和 AN91 数据,如“dataset_type”属性所示。网格是使用 PRISM(Parameter-elevation … climate geophysical monthly oregonstate precipitation pressure -
PROBA-V C1 冠层顶部每日合成 100 米

Proba-V 是一项卫星任务,旨在绘制地表覆盖和植被生长地图。该传感器旨在为 SPOT-4 和 SPOT-5 任务中的 VGT 光学仪器提供连续性。该传感器以三个 VNIR(可见光和近红外)波段和一个 SWIR(短波… esa multispectral nir proba probav satellite-imagery -
PROBA-V C1 冠层顶部每日合成 333 米
Proba-V 是一项卫星任务,旨在绘制地表覆盖和植被生长地图。该传感器旨在为 SPOT-4 和 SPOT-5 任务中的 VGT 光学仪器提供连续性。该传感器以三个 VNIR(可见光和近红外)波段和一个 SWIR(短波… esa multispectral nir proba probav satellite-imagery -
Palm 概率模型 2025a

注意:此数据集尚未经过同行评审。如需了解详情,请参阅此 GitHub README。此影像集提供估计的每像素概率,表示相应区域被相应商品占据的可能性。概率估计值以 10 米为单位提供,由…生成 农业 生物多样性 保护 作物 eudr forestdatapartnership -
Planet SkySat 公共正射影像,多光谱

这些数据来自 Planet Labs Inc. 的 SkySat 卫星,于 2015 年收集,用于实验性“Skybox for Good Beta”计划,以及各种灾难应对活动和其他一些项目。该数据既包含 5 波段多光谱/全色影像集,也包含… highres multispectral pansharpened planet satellite-imagery skysat -
Planet SkySat 公共正射影像,RGB

这些数据来自 Planet Labs Inc. 的 SkySat 卫星,于 2015 年收集,用于实验性“Skybox for Good Beta”计划,以及各种灾难应对活动和其他一些项目。该数据既包含 5 波段多光谱/全色影像集,也包含… highres pansharpened planet rgb satellite-imagery skysat -
预览国家潮间带数字高程模型 25 米 1.0.0

国家潮间带数字高程模型 (NIDEM; Bishop-Taylor et al. 2018, 2019) 是澳大利亚裸露潮间带的大陆级高程数据集。NIDEM 首次以三维形式呈现了澳大利亚潮间带沙滩和海岸、潮滩以及岩石海岸和礁石,分辨率为 25 米… 澳大利亚 dem elevation-topography ga -
原生湿润热带森林

原生湿热带森林可提供众多全球生态系统服务,但仍面临因经济因素而持续遭到砍伐的威胁。为了促进国家土地利用规划,并平衡经济发展和维护生态系统服务的目标,我们创建了一张主要的热带湿润森林地图… 森林 森林生物质 全球 Landsat 衍生 UMD -
公告:USGS GAP PAD-US v2.0
PAD-US 是美国官方的国家级陆地和海洋保护区清单,这些保护区致力于保护生物多样性以及其他自然、休闲和文化用途,并通过法律或其他有效手段进行管理,以实现这些目的。此数据库分为… conservation-easements designation infrastructure-boundaries management ownership protected-areas -
RCMAP Rangeland Component Timeseries (1985-2023),v06

“RCMAP(牧草地状况监测评估和预测)数据集使用 1985 年至 2023 年的 Landsat 影像,量化了北美西部牧草地组成部分的覆盖百分比。RCMAP 产品套件包含 10 个分数组件:一年生草本植物、裸地、草本植物、凋落物、非山艾灌木、多年生草本植物、山艾灌木等。 climate-change disturbance landsat-derived landuse-landcover nlcd rangeland -
RCMAP 草地趋势年(1985-2023 年),v06

此合集包含 1985 年至 2023 年的 RCMAP 年度产品。RCMAP(牧草地状况监测评估和预测)数据集使用 1985 年至 2023 年的 Landsat 影像,量化了北美西部牧草地组成部分的覆盖百分比。RCMAP 产品套件包含 10 个分数组件:年限、… climate-change disturbance landsat-derived landuse-landcover nlcd rangeland -
RCMAP 草地分量时间序列趋势(1985 年至 2023 年),版本 06

RCMAP(牧草地状况监测评估和预测)数据集使用 1985 年至 2023 年的 Landsat 影像,量化了北美西部牧草地组成部分的覆盖百分比。RCMAP 产品套件包含 10 个分数组件:一年生草本植物、裸地、草本植物、凋落物、非山艾灌木、多年生草本植物、山艾灌木等。 climate-change disturbance landsat-derived landuse-landcover nlcd rangeland -
REMA Mosaic

南极洲参考高程模型 (REMA) 是一种高分辨率、带时间戳的南极洲数字表面模型 (DSM),空间分辨率为 2 米和 8 米。镶嵌式 DEM 文件由多个已共同注册、混合和羽化的条带编译而成,可减少边缘匹配伪影。 dem elevation-topography geophysical pgc rema umn -
REMA Strips 2m

南极洲参考高程模型 (REMA) 是一种高分辨率、带时间戳的南极洲数字表面模型 (DSM),空间分辨率为 2 米和 8 米。条带 DEM 文件对应于输入立体影像对条带的重叠区域,因为它们是由 DigitalGlobe 的 … dem elevation-topography geophysical pgc rema umn -
REMA Strips 8m

南极洲参考高程模型 (REMA) 是一种高分辨率、带时间戳的南极洲数字表面模型 (DSM),空间分辨率为 2 米和 8 米。条带 DEM 文件对应于输入立体影像对条带的重叠区域,因为它们是由 DigitalGlobe 的 … dem elevation-topography geophysical pgc rema umn -
RESOLVE 生态区域 2017 年
RESOLVE 生态区域数据集于 2017 年更新,其中描绘了代表我们这个生机勃勃的星球的 846 个陆地生态区域。您可以在 https://ecoregions2017.appspot.com/ 或 Earth Engine 中查看样式化地图。从最简单的定义来看,生态区域是指具有区域范围的生态系统。具体而言,生态区代表着不同的组合… 生物多样性 保护 生态区 生态系统 全球 表格 -
RGE ALTI:IGN RGE ALTI 数字高程 1 米
RGE ALTI 数据集描述了法国的数字高程模型 (DEM),像素大小为 1 米。它是根据通过机载激光雷达获得的测量数据或通过关联航拍图像创建的。Lidar 已部署在易发生洪灾的沿海地区和大型森林地区。纵向… dem elevation elevation-topography geophysical -
RTMA:实时中尺度分析

实时中尺度分析 (RTMA) 是一种针对近地表天气条件的高空间和时间分辨率分析。此数据集包含美国本土的每小时分析数据(分辨率为 2.5 公里)。 atmosphere climate cloud geophysical humidity noaa -
重新处理的 GLDAS-2.0:全球陆面数据同化系统

NASA 全球陆面数据同化系统第 2 版 (GLDAS-2) 包含三个组成部分:GLDAS-2.0、GLDAS-2.1 和 GLDAS-2.2。GLDAS-2.0 完全由普林斯顿气象强迫输入数据强迫,并提供 1948 年至 2014 年的时间上一致的序列。GLDAS-2.1 采用模型…的组合进行强制 3 小时 气候 冰冻圈 蒸发 强迫 地球物理 -
橡胶树概率模型 2025a

注意:此数据集尚未经过同行评审。如需了解详情,请参阅此 GitHub README。此影像集提供估计的每像素概率,表示相应区域被相应商品占据的可能性。概率估计值以 10 米为单位提供,由…生成 农业 生物多样性 保护 作物 eudr forestdatapartnership -
SBTN Natural Lands Map v1
SBTN 自然土地地图 v1 是一张 2020 年的自然和非自然土地覆盖基准地图,旨在供制定基于科学的自然目标的公司使用,特别是 SBTN 土地目标 1:不转换自然生态系统。“自然”和“非自然”的定义改编自… 生态系统 landcover landuse-landcover wri -
SBTN Natural Lands Map v1.1
SBTN Natural Lands Map v1.1 是一张 2020 年的自然和非自然地表覆盖基准地图,旨在供企业在制定基于科学的自然目标时使用,特别是 SBTN Land 目标 1:不转换自然生态系统。“自然”和“非自然”的定义改编自… 生态系统 landcover landuse-landcover wri -
SCANFI:加拿大空间化国家森林清查数据产品 1.2

此数据发布包含一组 30 米分辨率的栅格文件,表示 2020 年加拿大全境的广义土地覆盖类型、森林冠层高度、郁闭度和地上树木生物量地图,以及几种主要树种的物种组成。The Spatialized CAnadian National … 加拿大 森林 森林生物质 发布者-数据集 树木覆盖率 -
SLGA:澳大利亚土壤和景观网格(土壤属性)

澳大利亚土壤和景观网格 (SLGA) 是一个全面的数据集,包含澳大利亚各地土壤属性,分辨率为 3 角秒(约 90 米像素)。地表是模型分析的结果,它使用现有的土壤数据和环境数据来描述土壤属性的空间分布… 澳大利亚 澳大利亚联邦科学与工业研究组织 土壤 澳大利亚陆地生态系统研究网络 -
SPEIbase:标准化降水蒸散指数数据库,版本 2.10

全球 SPEI 数据库 (SPEIbase) 提供了全球范围内有关干旱情况的长期可靠信息,像素大小为 0.5 度,频率为每月一次。它提供 1 到 48 个月的 SPEI 时间尺度。标准化降水蒸散指数 (SPEI) 以标准化变量的形式表示… climate climate-change drought evapotranspiration global monthly -
SPL3SMP_E.005 SMAP L3 Radiometer Global Daily 9 km Soil Moisture

自 2023-12-04 起的数据可在 NASA/SMAP/SPL3SMP_E/006 集合中获取。此 3 级 (L3) 土壤湿度产品提供由土壤湿度主动被动 (SMAP) L 波段辐射计检索到的全球陆地表面状况的每日合成数据。此处显示的每日数据是从降序(本地… drought nasa smap soil soil-moisture surface -
SPL3SMP_E.006 SMAP L3 辐射计全球每日 9 公里土壤湿度
2023-12-04 之前的数据可在旧版 NASA/SMAP/SPL3SMP_E/005 集合中找到。这些图片最终会重新处理并添加到此合集中。此 L3 级土壤湿度产品提供由土壤湿度主动被动 (SMAP) L 波段雷达检索到的全球陆地表面状况的每日合成数据… drought nasa smap soil soil-moisture surface -
SPL4SMGP.008 SMAP L4 全球 3 小时 9 公里地表和根区土壤湿度
SMAP L4 级土壤湿度产品包括地表土壤湿度(0-5 厘米垂直平均值)、根区土壤湿度(0-100 厘米垂直平均值)和其他研究产品(未经过验证),包括地表气象强迫变量、土壤温度、蒸散和净辐射。此数据集正式称为… drought nasa smap soil soil-moisture surface -
SRTM 数字高程数据版本 4
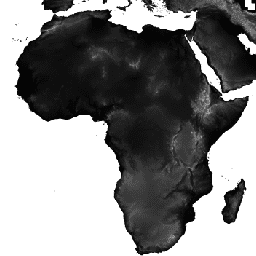
航天飞机雷达地形测绘任务 (SRTM) 数字高程数据集最初的目的是提供近乎全球范围的一致、高质量的高程数据。此版本的 SRTM 数字高程数据经过处理,可填补数据空白,并方便用户使用。 dem elevation elevation-topography geophysical srtm topography -
SWISSIMAGE 10 厘米 RGB 影像

SWISSIMAGE 10 厘米正射影像镶嵌图是瑞士全境的新彩色数字航拍图像的集合,在平原和主要阿尔卑斯山谷中的地面分辨率为 10 厘米,在阿尔卑斯山中的地面分辨率为 25 厘米。每年更新一次。… 正射影像 rgb -
卫星嵌入 V1
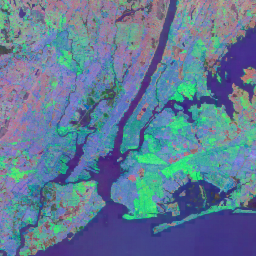
Google Satellite Embedding 数据集是一个全球性的、随时可供分析的地理空间嵌入内容集合。此数据集中的每个 10 米像素都是一个 64 维表示形式(或“嵌入向量”),用于对该像素及其周围的地表状况的时间轨迹进行编码,这些轨迹是通过各种地球观测… annual global google landsat-derived satellite-imagery sentinel1-derived -
Sentinel-1 SAR GRD:C 频段合成孔径雷达地面距离检测,对数缩放
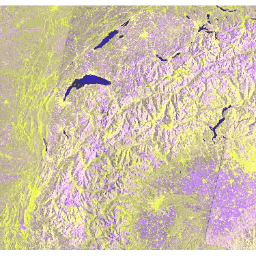
Sentinel-1 任务通过双极化 C 频段合成孔径雷达 (SAR) 仪器(频率为 5.405GHz,即 C 频段)提供数据。此合集包含使用 Sentinel-1 Toolbox 处理的 S1 地面探测范围 (GRD) 场景,可生成经过校准的正射校正产品。此合集每天更新一次。新… 后向散射 哥白尼 ESA 欧盟 极化 雷达 -
Sentinel-2:云概率

S2 云概率数据集通过 sentinel2-cloud-detector 库(基于 LightGBM 构建)创建。在应用梯度提升基础算法之前,所有波段都使用双线性插值上采样到 10 米分辨率。生成的 0-1 浮点型概率值将缩放至 0-100 范围,并以 UINT8 格式存储。… 云 哥白尼 欧洲航天局 欧盟 多光谱成像仪 辐射 -
Sentinel-3 OLCI EFR:海洋和陆地彩色仪器地球观测全分辨率

海洋和陆地色彩仪器 (OLCI) 地球观测全分辨率 (EFR) 数据集包含 21 个光谱波段的大气层顶部辐射亮度,中心波长介于 0.4µm 和 1.02µm 之间,空间分辨率为 300 米,覆盖全球,每隔约 2 天更新一次。OLCI 是以下之一… 哥白尼 esa eu 辐射 卫星图像 哨兵 -
Sentinel-5P NRTI AER AI:近乎实时的紫外气溶胶指数

NRTI/L3_AER_AI 本数据集提供近乎实时的高分辨率紫外气溶胶指数 (UVAI) 影像,该指数也称为吸收性气溶胶指数 (AAI)。AAI 基于紫外光谱范围内一对特定波长的瑞利散射效应随波长变化的关系进行计算。“观测到的…”与“预测的…”之间的区别 aai 气溶胶 空气质量 大气 哥白尼 esa -
Sentinel-5P NRTI AER LH:近乎实时的紫外气溶胶层高度

NRTI/L3_AER_LH 该数据集提供紫外气溶胶指数 (UVAI) 的离线高分辨率影像,该指数也称为吸收层高度 (ALH)。ALH 对云污染非常敏感。然而,气溶胶和云可能难以区分,因此仅当 FRESCO 有效… 气溶胶 空气质量 alh 大气 哥白尼 esa -
Sentinel-5P NRTI CLOUD:近乎实时的云属性

NRTI/L3_CLOUD 该数据集提供近乎实时的云参数高分辨率图像。TROPOMI/S5P 云属性检索基于目前在 GOME 和 GOME-2 业务产品中使用的 OCRA 和 ROCINN 算法。OCRA 使用紫外线/可见光谱中的测量结果检索云分数… 大气 云 哥白尼 德国航空航天中心 欧洲航天局 欧盟 -
Sentinel-5P NRTI CO:近乎实时的一氧化碳数据

NRTI/L3_CO 该数据集提供近乎实时的 CO 浓度高分辨率图像。一氧化碳 (CO) 是一种重要的大气痕量气体,有助于了解对流层化学。在某些城市地区,它是主要的大气污染物。CO 的主要来源是化石燃料燃烧、生物质燃烧,… 空气质量 大气 一氧化碳 哥白尼计划 欧洲航天局 欧盟 -
Sentinel-5P NRTI HCHO:近乎实时的甲醛数据

NRTI/L3_HCHO 此数据集提供大气中甲醛 (HCHO) 浓度的近乎实时高分辨率图像。甲醛是几乎所有非甲烷挥发性有机化合物 (NMVOC) 氧化链中的中间气体,最终会生成 CO2。非甲烷挥发性有机化合物 (NMVOC) 与 NOx、CO 和 CH4 一起,… air-quality atmosphere bira copernicus dlr esa -
Sentinel-5P NRTI NO2:近乎实时的二氧化氮数据

NRTI/L3_NO2 本数据集提供近乎实时的高分辨率 NO2 浓度影像。氮氧化物(NO2 和 NO)是地球大气层中重要的痕量气体,存在于对流层和平流层中,主要来源于人类活动(特别是化石燃料... air-quality atmosphere copernicus esa eu knmi -
Sentinel-5P NRTI O3:近乎实时的臭氧数据

NRTI/L3_O3 本数据集提供近乎实时的高分辨率总柱臭氧浓度影像。另请参阅 COPERNICUS/S5P/OFFL/L3_O3_TCL,了解对流层柱数据。在平流层中,臭氧层可保护生物圈免受危险的太阳紫外线辐射。在对流层中,它是一种高效的清洁剂,但… 空气质量 大气 哥白尼 欧洲航天局 欧盟 o3 -
Sentinel-5P NRTI SO2:近乎实时的二氧化硫数据

NRTI/L3_SO2 此数据集提供大气中二氧化硫 (SO2) 浓度的近乎实时的高分辨率图像。二氧化硫 (SO2) 通过自然过程和人为过程进入地球大气层。它在局部和全球范围内的化学反应中发挥着重要作用。小到短期… air-quality atmosphere bira copernicus dlr esa -
Sentinel-5P OFFL AER AI:离线紫外气溶胶指数

该数据集提供紫外气溶胶指数 (UVAI) 的离线高分辨率影像,该指数也称为吸收性气溶胶指数 (AAI)。AAI 基于紫外光谱范围内一对特定波长的瑞利散射效应随波长变化的关系进行计算。观测到的与…之间的差异 aai 气溶胶 空气质量 大气 哥白尼 esa -
Sentinel-5P OFFL AER LH:离线紫外气溶胶层高度

该数据集提供紫外气溶胶指数 (UVAI) 的离线高分辨率影像,该指数也称为吸收层高度 (ALH)。ALH 对云污染非常敏感。然而,气溶胶和云可能难以区分,因此仅当 FRESCO 有效… 气溶胶 空气质量 alh 大气 哥白尼 esa -
Sentinel-5P OFFL CH4:离线甲烷

OFFL/L3_CH4 此数据集提供甲烷浓度的离线高分辨率图像。甲烷 (CH4) 是继二氧化碳 (CO2) 之后,对人为增强的温室效应贡献最大的气体。大约四分之三的甲烷排放是人为造成的,因此,继续记录…非常重要 atmosphere climate copernicus esa eu knmi -
Sentinel-5P OFFL CLOUD:离线云属性

OFFL/L3_CLOUD 该数据集提供云参数的离线高分辨率影像。TROPOMI/S5P 云属性检索基于目前在 GOME 和 GOME-2 业务产品中使用的 OCRA 和 ROCINN 算法。OCRA 使用 UV/VIS 光谱区域的测量结果检索云分数… 大气 云 哥白尼 德国航空航天中心 欧洲航天局 欧盟 -
Sentinel-5P OFFL CO:离线一氧化碳

OFFL/L3_CO 此数据集提供 CO 浓度的离线高分辨率图像。一氧化碳 (CO) 是一种重要的大气痕量气体,有助于了解对流层化学。在某些城市地区,它是主要的大气污染物。CO 的主要来源是化石燃料燃烧、生物质燃烧,以及... 空气质量 大气 一氧化碳 哥白尼计划 欧洲航天局 欧盟 -
Sentinel-5P OFFL HCHO:离线甲醛

OFFL/L3_HCHO 此数据集提供大气中甲醛 (HCHO) 浓度的离线高分辨率图像。甲醛是几乎所有非甲烷挥发性有机化合物 (NMVOC) 氧化链中的中间气体,最终会生成 CO2。非甲烷挥发性有机化合物 (NMVOC) 与 NOx、CO 和 CH4 一起,是… air-quality atmosphere bira copernicus dlr esa -
Sentinel-5P OFFL NO2:离线二氧化氮数据

OFFL/L3_NO2 本数据集提供 NO2 浓度的离线高分辨率影像。氮氧化物(NO2 和 NO)是地球大气层中重要的痕量气体,存在于对流层和平流层中,主要来源于人类活动(特别是化石燃料燃烧... air-quality atmosphere copernicus esa eu knmi -
Sentinel-5P OFFL O3 TCL:离线对流层臭氧

OFFL/L3_O3_TCL 此数据集提供对 20N 和 20S 之间臭氧浓度的离线高分辨率对流层图像。另请参阅 COPERNICUS/S5P/OFFL/L3_O3 和 COPERNICUS/S5P/NRTI/L3_O3,了解总列数据。在平流层中,臭氧层可保护生物圈免受危险的太阳紫外线辐射。在对流层中,它充当… 空气质量 大气 哥白尼 欧洲航天局 欧盟 o3 -
Sentinel-5P OFFL O3:离线臭氧

OFFL/L3_O3 此数据集提供总柱臭氧浓度的离线高分辨率图像。另请参阅 COPERNICUS/S5P/OFFL/L3_O3_TCL,了解对流层柱数据。在平流层中,臭氧层可保护生物圈免受危险的太阳紫外线辐射。在对流层中,它是一种高效的清洁剂,但… 空气质量 大气 哥白尼 欧洲航天局 欧盟 o3 -
Sentinel-5P OFFL SO2:离线二氧化硫

OFFL/L3_SO2 此数据集提供大气中二氧化硫 (SO2) 浓度的离线高分辨率图像。二氧化硫 (SO2) 通过自然过程和人为过程进入地球大气层。它在局部和全球范围内的化学反应中发挥着重要作用。小到短期污染… air-quality atmosphere bira copernicus dlr esa -
斯洛伐克正射影像

斯洛伐克共和国的正射影像镶嵌图是一组彩色正射影像,这些影像没有重叠、间隙,并且沿连接线没有明显的亮度和颜色差异。如需了解详情,请参阅斯洛伐正射影像文档 正射影像 rgb -
SoilGrids250m 2.0 - 体积含水量
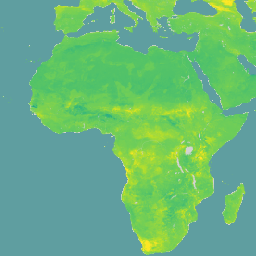
在 6 个标准深度(0-5 厘米、5-15 厘米、15-30 厘米、30-60 厘米、60-100 厘米、100-200 厘米)下,吸力分别为 10kPa、33kPa 和 1500kPa 时的体积含水量,单位为 10^-3 立方厘米/立方厘米(0.1 体积百分比或 1 毫米/米)。预测结果是根据基于分位数随机森林的数字土壤测绘方法得出的,该方法利用了全球… 土壤 土壤湿度 水 -
西班牙 RGB 正射影像 10 厘米

由各种公共管理机构在 2007 年至 2018 年间拍摄的正射影像的镶嵌图,像素分辨率为 10 厘米。这些数据由西班牙国家航空正射影像计划 (PNOA) 提供。如需了解详情,请参阅西班牙正射影像文档 正射影像 rgb -
物种分布,澳大利亚哺乳动物

这些物种分布模型输出由 Google 与 QCIF 和 EcoCommons 合作开发,表示物种的相对出现可能性估计值(即,值越高表示在给定调查方法和给定调查… 生物多样性 保护 生态系统 自然轨迹 预审核 发布者数据集 -
TCB:Malaria Atlas Project 填充了缺失数据的 Tasseled Cap 亮度(每 8 天 1 千米)

此填充了缺失数据的 Tasseled Cap 亮度 (TCB) 数据集是将 Lobser 和 Cohen (2007) 中定义的 tasseled-cap 方程应用于 MODIS BRDF 校正后的影像 (MCD43B4) 而创建的。使用 Weiss 等人 (2014) 概述的方法对生成的数据进行了缺口填充,以消除因…而导致的数据缺失。 亮度 malariaatlasproject 地图 publisher-dataset tasseled-cap tcb -
TCB:Malaria Atlas Project 填充了缺失数据的 Tasseled Cap 亮度(每年 1 千米)

此填充了缺失数据的 Tasseled Cap 亮度 (TCB) 数据集是将 Lobser 和 Cohen (2007) 中定义的 tasseled-cap 方程应用于 MODIS BRDF 校正后的影像 (MCD43B4) 而创建的。使用 Weiss 等人 (2014) 概述的方法对生成的数据进行了缺口填充,以消除因…而导致的数据缺失。 亮度 malariaatlasproject 地图 publisher-dataset tasseled-cap tcb -
TCB:Malaria Atlas Project 填充了缺失数据的 Tasseled Cap 亮度(每月 1 千米)

此填充了缺失数据的 Tasseled Cap 亮度 (TCB) 数据集是将 Lobser 和 Cohen (2007) 中定义的 tasseled-cap 方程应用于 MODIS BRDF 校正后的影像 (MCD43B4) 而创建的。使用 Weiss 等人 (2014) 概述的方法对生成的数据进行了缺口填充,以消除因…而导致的数据缺失。 亮度 malariaatlasproject 地图 publisher-dataset tasseled-cap tcb -
TCW:Malaria Atlas Project 填充了缺失数据的 Tasseled Cap 湿度(每 8 天 1 千米)

此填充了缺失数据的 Tasseled Cap 湿度 (TCW) 数据集是将 Lobser 和 Cohen (2007) 中定义的 tasseled-cap 方程应用于 MODIS BRDF 校正后的影像 (MCD43B4) 而创建的。使用 Weiss 等人 (2014) 概述的方法对生成的数据进行了缺口填充,以消除因…而导致的数据缺失。 malariaatlasproject map publisher-dataset tasseled-cap tcw vegetation -
TCW:Malaria Atlas Project 填充了缺失数据的 Tasseled Cap 湿度(每年 1 千米)

此填充了缺失数据的 Tasseled Cap 湿度 (TCW) 数据集是将 Lobser 和 Cohen (2007) 中定义的 tasseled-cap 方程应用于 MODIS BRDF 校正后的影像 (MCD43B4) 而创建的。使用 Weiss 等人 (2014) 概述的方法对生成的数据进行了缺口填充,以消除因…而导致的数据缺失。 malariaatlasproject map publisher-dataset tasseled-cap tcw vegetation -
TCW:Malaria Atlas Project 填充了缺失数据的 Tasseled Cap 湿度(每月 1 千米)

此填充了缺失数据的 Tasseled Cap 湿度 (TCW) 数据集是将 Lobser 和 Cohen (2007) 中定义的 tasseled-cap 方程应用于 MODIS BRDF 校正后的影像 (MCD43B4) 而创建的。使用 Weiss 等人 (2014) 概述的方法对生成的数据进行了缺口填充,以消除因…而导致的数据缺失。 malariaatlasproject map publisher-dataset tasseled-cap tcw vegetation -
TEMPO 网格化 HCHO(经过质量保证过滤)垂直列 V03
甲醛 Level 3 集合可提供常规网格上的微量气体信息,涵盖 TEMPO 正常观测的视场。3 级文件是通过合并构成 TEMPO 东西向扫描周期的所有 2 级文件中的信息得出的。栅格包含以下信息… air-quality formaldehyde nasa pollution satellite-imagery tempo -
TEMPO 网格化 HCHO 垂直柱 V03
甲醛 Level 3 集合可提供常规网格上的微量气体信息,涵盖 TEMPO 正常观测的视场。3 级文件是通过合并构成 TEMPO 东西向扫描周期的所有 2 级文件中的信息得出的。栅格包含以下信息… air-quality formaldehyde nasa pollution satellite-imagery tempo -
TEMPO 网格化 NO2(经过质量检查过滤)对流层和同温层柱浓度 V03
二氧化氮 Level 3 文件以规则网格形式提供微量气体信息,涵盖 TEMPO 的视场,用于名义 TEMPO 观测。3 级文件是通过合并构成 TEMPO 东西向扫描周期的所有 2 级文件中的信息得出的。栅格包含… air-quality nasa nitrogen-dioxide pollution satellite-imagery tempo -
TEMPO 网格化 NO2 对流层和同温层柱浓度 V03
二氧化氮 Level 3 文件以规则网格形式提供微量气体信息,涵盖 TEMPO 的视场,用于名义 TEMPO 观测。3 级文件是通过合并构成 TEMPO 东西向扫描周期的所有 2 级文件中的信息得出的。栅格包含… air-quality nasa nitrogen-dioxide pollution satellite-imagery tempo -
TEMPO 网格化臭氧总柱 V03(临时)

TEMPO 网格化臭氧总柱 V03(临时)是一个 3 级数据集,可在北美洲的常规网格上提供基本的臭氧总柱信息。该数据由 IS-40e 平台上的 TEMPO 仪器生成,通过组合和重新网格化 2 级数据创建而成。 air-quality nasa ozone pollution satellite-imagery tempo -
TIGER:2020 年统计(人口普查)区块
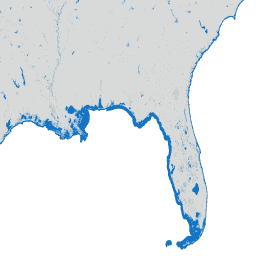
美国人口调查局会定期发布名为 TIGER 的地理数据库。此数据集包含 2020 年人口普查街区,大致相当于一个城市街区。有 800 多万个多边形要素,覆盖美国、哥伦比亚特区、波多黎各和岛屿… 人口普查 城市 基础设施边界 社区 表格 TIGER -
TIGER:美国人口普查街区组 (BG) 2010 年
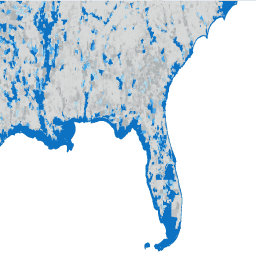
美国人口调查局会定期发布名为 TIGER 的地理数据库。此数据集包含 2010 年人口普查街区组,即同一人口普查区内的一组街区,这些街区的四位数人口普查街区编号的第一位数字相同。只有… 人口普查 城市 基础设施边界 社区 表格 TIGER -
TIGER:美国人口普查街区组 (BG) 2020
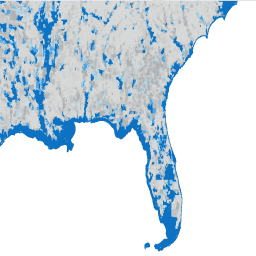
美国人口调查局会定期发布名为 TIGER 的地理数据库。此数据集包含 2020 年人口普查街区组,即同一人口普查区内的一组街区,这些街区的四位数人口普查街区编号的第一位数字相同。只有… 人口普查 城市 基础设施边界 社区 表格 TIGER -
TIGER:美国人口普查区
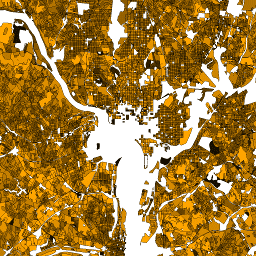
美国人口调查局会定期发布名为 TIGER 的地理数据库。此数据集包含 2010 年的人口普查街区,大致相当于一个城市街区。有 1,100 多万个多边形要素,覆盖美国、哥伦比亚特区、波多黎各和岛屿… 人口普查 城市 基础设施边界 社区 表格 TIGER -
TIGER:美国人口普查县(2016 年)

美国人口普查局 TIGER 数据集包含美国各州主要法定行政区划的 2016 年边界。在大多数州,这些实体被称为“县”。在路易斯安那州,这些行政区称为“parishes”。阿拉斯加州有称为“自治市”的政府实体,其政府职能与…类似 人口普查 县 基础设施边界 表格 TIGER 美国 -
TIGER:美国人口普查县 2018 年

美国人口普查局 TIGER 数据集包含美国各州主要法定行政区划的 2018 年边界。在大多数州,这些实体被称为“县”。在路易斯安那州,这些行政区称为“parishes”。阿拉斯加州有称为“自治市”的政府实体,其政府职能与…类似 人口普查 县 基础设施边界 表格 TIGER 美国 -
TIGER:美国人口普查道路
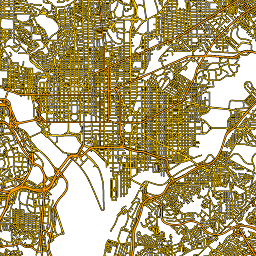
此美国人口普查局 TIGER 数据集包含 2016 年版本中的所有路段,其中包含超过 1,900 万个覆盖美国、哥伦比亚特区、波多黎各和岛屿地区的单独线要素。每个特征都表示一个路段几何图形(一个… census infrastructure-boundaries roads table tiger us -
TIGER:美国人口普查州(2016 年)

美国人口调查局 TIGER 数据集包含美国主要政府部门的 2016 年边界。除了 50 个州之外,美国人口普查局还将哥伦比亚特区、波多黎各和每个岛屿地区(美属萨摩亚、… 人口普查 infrastructure-boundaries 州 州 表 tiger -
TIGER:美国人口普查州数据(2018 年)
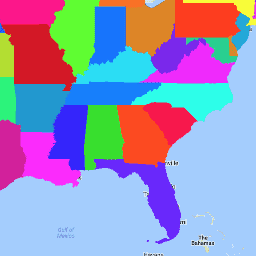
美国人口普查局 TIGER 数据集包含美国主要政府部门的 2018 年边界。除了 50 个州之外,美国人口普查局还将哥伦比亚特区、波多黎各和每个岛屿地区(美属萨摩亚、… 人口普查 infrastructure-boundaries 州 州 表 tiger -
TIGER:美国人口普查区

美国人口调查局会定期发布名为 TIGER 的地理数据库。此数据集包含 2020 年的人口普查区。人口普查区面积差异很大,但在城市地区大致相当于一个社区。有 85, 000 多个多边形地图项覆盖美国、哥伦比亚特区… 人口普查 城市 基础设施边界 社区 表格 TIGER -
TIGER:美国人口普查区人口统计信息 - 资料 1

美国人口调查局会定期发布名为 TIGER 的地理数据库。此表包含按人口普查区汇总的 2010 年人口普查人口统计资料 1 值。人口普查区面积差异很大,但在城市地区大致相当于一个社区。大约有 74,000 个多边形要素… 人口普查 infrastructure-boundaries 表格 tiger 美国 -
TOMS 和 OMI 合并的臭氧数据
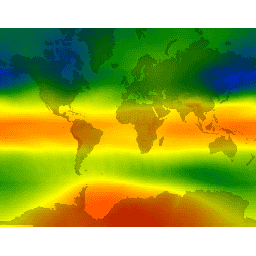
全臭氧测绘光谱仪 (TOMS) 数据是主要的长期连续卫星观测记录,可用于监测过去 25 年全球和区域总臭氧的变化趋势。这些数据由 NASA 戈达德太空飞行中心的 Laboratory for Atmospheres 制作… atmosphere climate geophysical nasa ozone -
TRMM 3B42:3 小时降水估计值

热带降雨测量任务 (TRMM) 是 NASA 与日本宇宙航空研究开发机构 (JAXA) 之间的联合任务,旨在监测和研究热带降雨。34B2 产品包含网格化、经 TRMM 调整的合并红外降水(毫米/小时)和 RMS 降水误差估计值,时间分辨率为 3 小时… 3 小时 气候 地球物理 jaxa nasa 降水 -
TRMM 3B43:月度降水估计值

此合集已不再更新。请参阅 IMERG 月度数据集,该数据集通过算法合并了来自多颗卫星(包括 SSMI、SSMIS、MHS、AMSU-B 和 AMSR-E)的微波数据,每颗卫星都经过了与 TRMM 组合仪器的相互校准。算法 3B43 每月执行一次,以生成单个… climate geophysical jaxa nasa precipitation rainfall -
TUBerlin/BigEarthNet/v1

BigEarthNet 是一个全新的大规模 Sentinel-2 基准归档,包含 590,326 个 Sentinel-2 图像块。为了构建 BigEarthNet,我们于 2017 年 6 月至 2018 年 5 月期间在欧洲的 10 个国家/地区(奥地利、比利时、芬兰、爱尔兰、科索沃、立陶宛、卢森堡、葡萄牙、塞尔维亚、瑞士)获取了 125 个 Sentinel-2 地块。所有… 哥白尼 landuse-landcover sentinel -
TerraClimate:全球陆地表面的月度气候和气候水平衡,爱达荷大学

TerraClimate 是一个数据集,其中包含全球陆地表面的月度气候和气候水文平衡数据。它使用气候辅助插值,将 WorldClim 数据集中的高空间分辨率气候平均值与 CRU Ts4.0 和日本 55 年再分析 (JRA55) 中的较低空间分辨率但随时间变化的数据相结合。… 气候 干旱 蒸发蒸腾 地球物理 全球 梅赛德 -
气候危害中心 (CHC) 耦合模型比较项目第 6 阶段 (CHC-CMIP6)
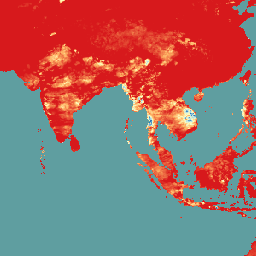
CHC-CMIP6 专门用于支持分析近期的气候相关灾害和近期的未来气候相关灾害。此气候预测数据集包含观测期(1983 年至 2016 年)和预测期(2030 年和 2050 年)的全球每日网格化数据,可用于识别和… climate geophysical precipitation ucsb weather -
Tree proximate people (TPP) 1.0

“Tree Proximate People”(TPP) 是有助于开发森林合作伙伴关系 (CPF) 全球核心森林相关指标集 (GCS) 中指标 13(极度贫困的森林依赖人口)的数据集之一。TPP 数据集提供了 4 种不同的估计值… 农业 粮农组织 森林 全球 植物生产力 人口 -
清华大学 FROM-GLC 年份变化到不透水地表

此数据集包含 1985 年至 2018 年间全球不透水地表面积的年度变化信息,分辨率为 30 米。从透水到不透水的变化是通过监督分类和时间一致性检查相结合的方法确定的。不透水像素是指不透水率高于 50% 的像素。… 建成 人口 清华 城市 -
联合国粮农组织排水有机土壤面积(年度)1.0

关于排水有机土壤的两个相关粮农组织数据集提供了以下估计值:DROSA-A:为农业活动(耕地和放牧草地)而排水的有机土壤面积(以公顷为单位);DROSE-A:有机土壤农业排水的碳 (C) 和一氧化二氮 (N2O) 估计值(以千兆克为单位),… agriculture climate climate-change emissions fao ghg -
美国环保署生态区(III 级)

美国环境保护署 (USEPA) 提供生态区域数据集,作为研究、评估、管理和监控生态系统及生态系统组成部分的空间框架。生态区是指在生态系统以及环境类型、质量和数量方面大致相似的区域… 生态区域 生态系统 epa 表格 -
美国环保署生态区(IV 级)

美国环境保护署 (USEPA) 提供生态区域数据集,作为研究、评估、管理和监控生态系统及生态系统组成部分的空间框架。生态区是指在生态系统以及环境类型、质量和数量方面大致相似的区域… 生态区域 生态系统 epa 表格 -
美国岩性
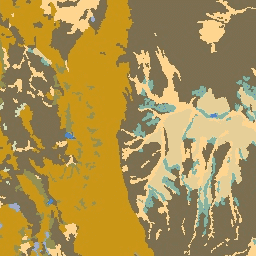
岩性数据集提供了地表土壤母质的一般类型。它并非源自任何 DEM。“Conservation Science Partners (CSP) Ecologically Relevant Geomorphology (ERGo) Datasets, Landforms and Physiography”(Conservation Science Partners [CSP] 生态相关地貌 [ERGo] 数据集、地形和地貌)包含有关地形和地貌的详细多尺度数据… 坡向 csp 海拔 海拔-地形 ergo 地球物理 -
美国 NED CHILI(连续热日照负荷指数)

CHILI 是日照和地形阴影对蒸散影响的替代变量,通过计算初午时(即太阳高度角相当于春分时)的日照来表示。该数据集基于美国地质调查局 (USGS) 的 10 米 NED DEM(在 EE 中以 USGS/NED 的形式提供)。The Conservation Science Partners (CSP) Ecologically … 坡向 csp 海拔 海拔-地形 ergo 地球物理 -
美国 NED 地貌数据

ALOS 地貌数据集提供通过组合连续热日照负荷指数 (CHILI) 和多尺度地形位置指数 (mTPI) 数据集创建的地貌类别。该数据集基于美国地质调查局 (USGS) 的 10 米 NED DEM(在 EE 中以 USGS/NED 的形式提供)。Conservation Science Partners (CSP) Ecologically Relevant … 坡向 csp 海拔 海拔-地形 ergo 地球物理 -
美国 NED 地理多样性
地形多样性数据集提供了地形类型多样性的指数。它是使用多种尺度(公里)下的香农多样性指数计算的:115.8、89.9、35.5、13.1、5.6、2.8 和 1.2。它基于 USGS 的 10 米 NED DEM(可在 EE 中获取 … 坡向 csp 海拔 海拔-地形 ergo 地球物理 -
美国 NED 地形多样性

地形多样性 (D) 是一个替代变量,表示物种作为当地栖息地可获得的温度和湿度条件的多样性。它表达了这样一种逻辑:更多样的地形气候生态位应支持更高的多样性(尤其是植物),并支持物种在气候变化下的持续存在… 坡向 csp 海拔 海拔-地形 ergo 地球物理 -
美国 NED mTPI(多尺度地形位置指数)
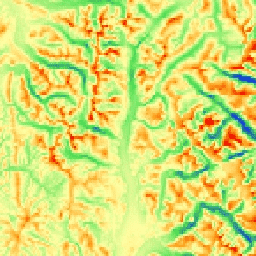
mTPI 可区分山脊地形和山谷地形。它是通过从每个位置的海拔数据中减去邻域内的平均海拔来计算的。mTPI 使用半径(公里)为 115.8、89.9、35.5、13.1、5.6、2.8 和 1.2 的移动窗口。该模型基于美国地质调查局 (USGS) 的… 坡向 csp 海拔 海拔-地形 ergo 地球物理 -
美国地形
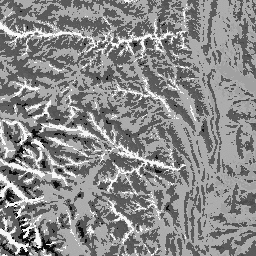
地形地貌数据集表示地形(在 EE 中以 ERGo/1_0/US/landforms 提供)和岩性(在 EE 中以 ERGo/1_0/US/lithology 提供)数据层的空间交集。它提供了 247 种独特的组合,而可能的组合总共有 270 种。每种类型的值是通过连接地貌和…形成的 坡向 csp 海拔 海拔-地形 ergo 地球物理 -
美国农业部 NASS 农田数据层
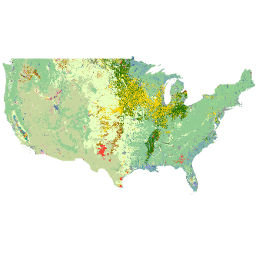
农田数据层 (CDL) 是一种针对特定作物的土地覆盖数据层,每年都会使用中等分辨率的卫星图像和广泛的农业标准答案数据为美国大陆创建。CDL 由美国农业部国家农业统计局 (NASS) 研究与开发部门创建,… 农业 农作物 土地覆盖 美国农业部 -
美国森林服务局景观变化监控系统 v2024.10(美国本土和美国境外)
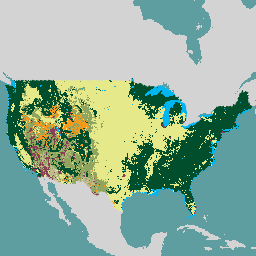
此产品是景观变化监测系统 (LCMS) 数据套件的一部分。该数据集显示了每个年份的 LCMS 建模变化、土地覆盖和/或土地利用类别,涵盖美国本土 (CONUS) 以及 CONUS 以外的地区 (OCONUS),包括阿拉斯加 (AK)、波多黎各… change-detection forest gtac landcover landuse landuse-landcover -
美国林务局树冠覆盖率 v2023-5(CONUS 和 OCONUS)

概览树冠覆盖率 (TCC) 数据套件由美国农业部林务局 (USFS) 制作,是基于遥感的年度地图输出,涵盖 1985 年至 2023 年。这些数据支持美国地质调查局 (US Geological) 管理的国家土地覆盖数据库 (NLCD) 项目… 森林 gtac landuse-landcover redcastle-resources usda usfs -
美国林务局 TreeMap v2016(美国本土)

此产品是 TreeMap 数据套件的一部分。该数据集提供了 2016 年美国大陆整个森林覆盖范围内的森林特征(包括活树和死树的数量、生物量和碳)的详细空间信息。TreeMap v2016 包含一张图片,即… 生物质 碳 气候变化 美国本土 森林 森林生物质 -
USFS TreeMap v2020
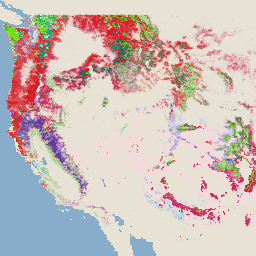
此产品是 TreeMap 数据套件的一部分。该数据集提供了 2020 年美国整个森林覆盖范围内的森林特征(包括活树和死树的数量、生物量和碳)的详细空间信息。TreeMap v2020 包含 22 个波段的 30 x 30 米… 地上 生物质 碳 气候变化 美国本土 森林 -
USFS TreeMap v2022
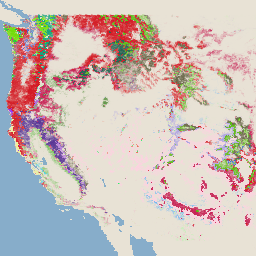
此产品是 TreeMap 数据套件的一部分。该数据集提供了 2022 年美国整个森林覆盖范围内的森林特征(包括活树和死树的数量、生物量和碳)的详细空间信息。TreeMap v2022 包含 22 个波段的 30 x 30 米… 地上 生物质 碳 气候变化 美国本土 森林 -
USGS 3DEP 10 米国家地图无缝数据集(1/3 角秒)
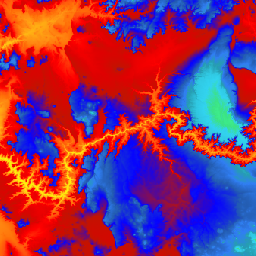
这是美国无缝 3DEP DEM 数据集,全面覆盖美国本土 48 个州、夏威夷和美国属地。阿拉斯加州的部分地区现已覆盖,并且正在扩大覆盖范围,以实现全州覆盖,这是阿拉斯加州地图绘制计划的一部分。地面间距为… 3DEP DEM 海拔 海拔-地形 地球物理 地形 -
USGS 3DEP 1 米国家地图
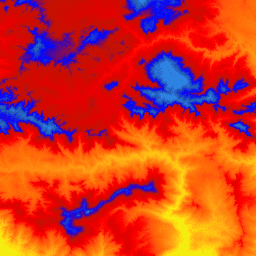
这是 3D 高程计划 (3DEP) 提供的像素大小为 1 米的平铺图像集合。3DEP 数据集是美国国家地图的海拔图层,可为地球科学研究和美国境内的地图应用提供基础海拔信息。 3DEP DEM 海拔 海拔-地形 地球物理 地形 -
USGS 3DEP National Map Spatial Metadata 1/3 Arc-Second (10m)
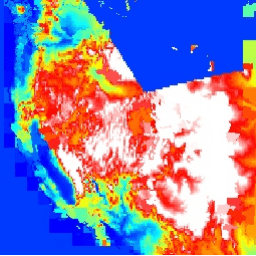
此表包含 3DEP 10 米 DEM 资产的元数据。工作单元范围空间元数据 (WESM) 包含当前的激光雷达数据可用性以及有关激光雷达项目的基本信息,包括激光雷达质量级别、数据采集日期以及指向项目级元数据的链接。查看更多详情… 3dep elevation-topography table usgs -
USGS GAP Alaska 2001

GAP/LANDFIRE 全国陆地生态系统数据代表了美国本土的详细植被和土地覆盖分类,阿拉斯加、夏威夷和波多黎各。美国本土的 GAP/LF 2011 生态系统是国家间隙分析计划土地覆盖数据 - 版本 2.2 的更新版。阿拉斯加… 生态系统 gap landcover landfire usgs 植被 -
USGS GAP CONUS 2011

GAP/LANDFIRE 全国陆地生态系统数据代表了美国本土的详细植被和土地覆盖分类,阿拉斯加、夏威夷和波多黎各。美国本土的 GAP/LF 2011 生态系统是国家间隙分析计划土地覆盖数据 - 版本 2.2 的更新版。阿拉斯加… 生态系统 gap landcover landfire usgs 植被 -
USGS GAP 夏威夷 2001 年

GAP/LANDFIRE 全国陆地生态系统数据代表了美国本土的详细植被和土地覆盖分类,阿拉斯加、夏威夷和波多黎各。美国本土的 GAP/LF 2011 生态系统是国家间隙分析计划土地覆盖数据 - 版本 2.2 的更新版。阿拉斯加… 生态系统 gap landcover landfire usgs 植被 -
USGS GAP 波多黎各 2001 年

GAP/LANDFIRE 全国陆地生态系统数据代表了美国本土的详细植被和土地覆盖分类,阿拉斯加、夏威夷和波多黎各。美国本土的 GAP/LF 2011 生态系统是国家间隙分析计划土地覆盖数据 - 版本 2.2 的更新版。阿拉斯加… 生态系统 gap landcover landfire usgs 植被 -
USGS Landsat 1 MSS Collection 2 Tier 1 原始场景

Landsat 1 MSS Collection 2 Tier 1 DN 值,表示经过缩放、校准的传感器处辐射亮度。数据质量最高的 Landsat 场景会归入第 1 级,并被认为适合进行时间序列处理分析。第 1 级包括经过 Level-1 精确地形 (L1TP) 处理的数据,这些数据… c2 global l1 landsat lm1 mss -
USGS Landsat 1 MSS Collection 2 Tier 2 原始场景

Landsat 1 MSS Collection 2 Tier 2 DN 值,表示经过缩放、校准的传感器处辐射亮度。在处理过程中,不符合第 1 层级条件的场景会被分配到第 2 层级。这包括系统地形 (L1GT) 和系统 (L1GS) 处理后的场景,以及任何 L1TP 场景,只要这些场景… c2 global l1 landsat lm1 mss -
USGS Landsat 2 MSS Collection 2 Tier 1 原始场景

Landsat 2 MSS Collection 2 Tier 1 DN 值,表示经过缩放、校准的传感器处辐射亮度。数据质量最高的 Landsat 场景会归入第 1 级,并被认为适合进行时间序列处理分析。第 1 级包括经过 Level-1 精确地形 (L1TP) 处理的数据,这些数据… c2 global l2 landsat lm2 mss -
USGS Landsat 2 MSS Collection 2 Tier 2 原始场景

Landsat 2 MSS Collection 2 Tier 2 DN 值,表示经过缩放和校准的传感器处辐射亮度。在处理过程中,不符合第 1 层级条件的场景会被分配到第 2 层级。这包括系统地形 (L1GT) 和系统 (L1GS) 处理后的场景,以及任何 L1TP 场景,只要这些场景… c2 global l2 landsat lm2 mss -
USGS Landsat 3 MSS Collection 2 Tier 1 原始场景

Landsat 3 MSS Collection 2 Tier 1 DN 值,表示经过缩放和校准的传感器处辐射亮度。数据质量最高的 Landsat 场景会归入第 1 级,并被认为适合进行时间序列处理分析。第 1 级包括经过 Level-1 精确地形 (L1TP) 处理的数据,这些数据… c2 全球 l3 陆地卫星 lm3 mss -
USGS Landsat 3 MSS Collection 2 Tier 2 原始场景

Landsat 3 MSS Collection 2 Tier 2 DN 值,表示经过缩放和校准的传感器处辐射亮度。在处理过程中,不符合第 1 层级条件的场景会被分配到第 2 层级。这包括系统地形 (L1GT) 和系统 (L1GS) 处理后的场景,以及任何 L1TP 场景,只要这些场景… c2 全球 l3 陆地卫星 lm3 mss -
USGS Landsat 4 Level 2, Collection 2, Tier 1

此数据集包含由 Landsat TM 传感器生成的数据得出的经过大气校正的地表反射率和地表温度。这些影像包含 4 个可见光和近红外 (VNIR) 波段以及 2 个经过处理的短波红外 (SWIR) 波段(正射校正后的地表反射率),以及 1 个热红外波段。 cfmask cloud fmask global landsat lasrc -
USGS Landsat 4 Level 2,Collection 2,Tier 2
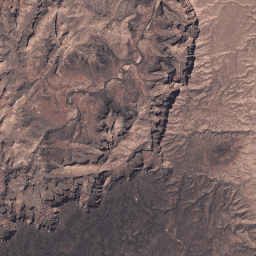
此数据集包含由 Landsat TM 传感器生成的数据得出的经过大气校正的地表反射率和地表温度。这些影像包含 4 个可见光和近红外 (VNIR) 波段以及 2 个经过处理的短波红外 (SWIR) 波段(正射校正后的地表反射率),以及 1 个热红外波段。 cfmask cloud fmask global landsat lasrc -
USGS Landsat 4 MSS Collection 2 Tier 1 原始场景

Landsat 4 MSS Collection 2 Tier 1 DN 值,表示经过缩放和校准的传感器处辐射率。数据质量最高的 Landsat 场景会归入第 1 级,并被认为适合进行时间序列处理分析。第 1 级包括经过 Level-1 精确地形 (L1TP) 处理的数据,这些数据… c2 全球 l4 陆地卫星 lm4 mss -
USGS Landsat 4 MSS Collection 2 Tier 2 原始场景
Landsat 4 MSS Collection 2 Tier 2 DN 值,表示经过缩放、校准的传感器处辐射率。在处理过程中,不符合第 1 层级条件的场景会被分配到第 2 层级。这包括系统地形 (L1GT) 和系统 (L1GS) 处理后的场景,以及任何 L1TP 场景,只要这些场景… c2 全球 l4 陆地卫星 lm4 mss -
USGS Landsat 4 TM Collection 2 Tier 1 原始场景

Landsat 4 TM Collection 2 Tier 1 DN 值,表示经过缩放和校准的传感器处辐射亮度。数据质量最高的 Landsat 场景会归入第 1 级,并被认为适合进行时间序列处理分析。第 1 级包括经过 Level-1 精确地形 (L1TP) 处理的数据,这些数据… c2 global l4 landsat lt4 radiance -
USGS Landsat 4 TM Collection 2 Tier 1 TOA 反射率

Landsat 4 TM Collection 2 Tier 1 经过校准的大气表观 (TOA) 反射率。从图片元数据中提取校准系数。如需详细了解 TOA 计算,请参阅 Chander 等人 (2009) 的文章。 全球 陆地卫星 卫星图像 toa usgs -
USGS Landsat 4 TM Collection 2 Tier 2 原始场景

Landsat 4 TM Collection 2 Tier 2 DN 值,表示经过缩放、校准的传感器处辐射亮度。在处理过程中,不符合第 1 层级条件的场景会被分配到第 2 层级。这包括系统地形 (L1GT) 和系统 (L1GS) 处理后的场景,以及任何 L1TP 场景,只要这些场景… c2 global l4 landsat lt4 radiance -
USGS Landsat 4 TM Collection 2 Tier 2 TOA 反射率
Landsat 4 TM Collection 2 Tier 2 经过校准的大气表观 (TOA) 反射率。从图片元数据中提取校准系数。如需详细了解 TOA 计算,请参阅 Chander 等人 (2009) 的文章。 全球 陆地卫星 卫星图像 toa usgs -
USGS Landsat 5 Level 2, Collection 2, Tier 1
此数据集包含由 Landsat TM 传感器生成的数据得出的经过大气校正的地表反射率和地表温度。这些影像包含 4 个可见光和近红外 (VNIR) 波段以及 2 个经过处理的短波红外 (SWIR) 波段(正射校正后的地表反射率),以及 1 个热红外波段。 cfmask cloud fmask global landsat lasrc -
USGS Landsat 5 Level 2,Collection 2,Tier 2
此数据集包含由 Landsat TM 传感器生成的数据得出的经过大气校正的地表反射率和地表温度。这些影像包含 4 个可见光和近红外 (VNIR) 波段以及 2 个经过处理的短波红外 (SWIR) 波段(正射校正后的地表反射率),以及 1 个热红外波段。 cfmask cloud fmask global landsat lasrc -
USGS Landsat 5 MSS Collection 2 Tier 1 原始场景

Landsat 5 MSS Collection 2 Tier 1 DN 值,表示经过缩放和校准的传感器处辐射度。数据质量最高的 Landsat 场景会归入第 1 级,并被认为适合进行时间序列处理分析。第 1 级包括经过 Level-1 精确地形 (L1TP) 处理的数据,这些数据… c2 全球 l5 陆地卫星 lm5 mss -
USGS Landsat 5 MSS Collection 2 Tier 2 原始场景

Landsat 5 MSS Collection 2 Tier 2 DN 值,表示经过缩放和校准的传感器处辐射亮度。在处理过程中,不符合第 1 层级条件的场景会被分配到第 2 层级。这包括系统地形 (L1GT) 和系统 (L1GS) 处理后的场景,以及任何 L1TP 场景,只要这些场景… c2 全球 l5 陆地卫星 lm5 mss -
USGS Landsat 5 TM Collection 2 Tier 1 原始场景

Landsat 5 TM Collection 2 Tier 1 DN 值,表示经过缩放和校准的传感器处辐射亮度。数据质量最高的 Landsat 场景会归入第 1 级,并被认为适合进行时间序列处理分析。第 1 级包括经过 Level-1 精确地形 (L1TP) 处理的数据,这些数据… c2 全球 l5 陆地卫星 lt5 辐射亮度 -
USGS Landsat 5 TM Collection 2 Tier 1 TOA 反射率

Landsat 5 TM Collection 2 第 1 级经过校准的大气表观 (TOA) 反射率。从图片元数据中提取校准系数。如需详细了解 TOA 计算,请参阅 Chander 等人 (2009) 的文章。 全球 陆地卫星 卫星图像 toa usgs -
USGS Landsat 5 TM Collection 2 Tier 2 原始场景

Landsat 5 TM Collection 2 Tier 2 DN 值,表示经过缩放和校准的传感器处辐射亮度。在处理过程中,不符合第 1 层级条件的场景会被分配到第 2 层级。这包括系统地形 (L1GT) 和系统 (L1GS) 处理后的场景,以及任何 L1TP 场景,只要这些场景… c2 全球 l5 陆地卫星 lt5 辐射亮度 -
USGS Landsat 5 TM Collection 2 Tier 2 TOA 反射率

Landsat 5 TM Collection 2 Tier 2 经过校准的大气表观 (TOA) 反射率。从图片元数据中提取校准系数。如需详细了解 TOA 计算,请参阅 Chander 等人 (2009) 的文章。 全球 陆地卫星 卫星图像 toa usgs -
USGS Landsat 7 Collection 2 Tier 1 原始场景

Landsat 7 Collection 2 Tier 1 DN 值,表示经过缩放和校准的传感器处辐射亮度。数据质量最高的 Landsat 场景会归入第 1 级,并被认为适合进行时间序列处理分析。第 1 级包括经过 L1TP 处理的数据,这些数据具有… c2 etm 全球 l7 陆地卫星 le7 -
USGS Landsat 7 Collection 2 Tier 1 TOA 反射率

Landsat 7 Collection 2 Tier 1 经过校准的大气表观 (TOA) 反射率。从图片元数据中提取校准系数。有关 TOA 计算的详细信息,请参阅 Chander 等人 (2009)。请注意,自 2017 年以来,Landsat 7 的轨道一直在漂移,导致采集时间提前。 c2 全球 陆地卫星 卫星影像 toa usgs -
USGS Landsat 7 Collection 2 Tier 1 和实时数据原始场景
Landsat 7 Collection 2 Tier 1 和实时数据 DN 值,表示经过缩放和校准的传感器处辐射率。数据质量最高的 Landsat 场景会归入第 1 级,并被认为适合进行时间序列处理分析。第 1 级包括经过处理的 1 级精确地形 (L1TP) … c2 etm 全球 l7 陆地卫星 le7 -
USGS Landsat 7 Collection 2 Tier 1 和实时数据的大气表观反射率

Landsat 7 Collection 2 Tier 1 和实时数据经过校准的大气表观 (TOA) 反射率。从图片元数据中提取校准系数。有关 TOA 计算的详细信息,请参阅 Chander 等人 (2009)。请注意,Landsat 7 的轨道一直在漂移,导致采集时间越来越早… c2 全球 陆地卫星 卫星影像 toa usgs -
USGS Landsat 7 Collection 2 Tier 2 原始场景
Landsat 7 Collection 2 Tier 2 DN 值,表示经过缩放和校准的传感器处辐射亮度。在处理过程中,不符合第 1 层级条件的场景会被分配到第 2 层级。这包括系统性地形 (L1GT) 和系统性 (L1GS) 处理后的场景,以及任何不…的 L1TP 场景 c2 etm 全球 l7 陆地卫星 le7 -
USGS Landsat 7 Collection 2 Tier 2 TOA 反射率
Landsat 7 Collection 2 Tier 2 经过校准的大气表观 (TOA) 反射率。从图片元数据中提取校准系数。有关 TOA 计算的详细信息,请参阅 Chander 等人 (2009)。请注意,自 2017 年以来,Landsat 7 的轨道一直在漂移,导致采集时间提前。 c2 全球 陆地卫星 卫星影像 toa usgs -
USGS Landsat 7 Level 2,Collection 2,Tier 1
此数据集包含由 Landsat 7 ETM+ 传感器生成的数据得出的经过大气校正的地面反射率和地表温度。这些影像包含 4 个可见光和近红外 (VNIR) 波段以及 2 个经过处理的短波红外 (SWIR) 波段(正射校正的地表反射率),以及 1 个热红外波段。 cfmask cloud etm fmask global landsat -
USGS Landsat 7 Level 2,Collection 2,Tier 2
此数据集包含由 Landsat 7 ETM+ 传感器生成的数据得出的经过大气校正的地面反射率和地表温度。这些影像包含 4 个可见光和近红外 (VNIR) 波段以及 2 个经过处理的短波红外 (SWIR) 波段(正射校正的地表反射率),以及 1 个热红外波段。 cfmask cloud etm fmask global landsat -
USGS Landsat 8 Collection 2 Tier 1 原始场景

Landsat 8 Collection 2 Tier 1 DN 值,表示经过缩放和校准的传感器处辐射亮度。数据质量最高的 Landsat 场景会归入第 1 级,并被认为适合进行时间序列处理分析。第 1 级包括经过 L1TP 处理的数据,这些数据具有… c2 全球 l8 陆地卫星 lc8 oli-tirs -
USGS Landsat 8 Collection 2 Tier 1 TOA 反射率

Landsat 8 Collection 2 Tier 1 经过校准的大气表观 (TOA) 反射率。从图片元数据中提取校准系数。有关 TOA 计算的详细信息,请参阅 Chander 等人 (2009)。数据质量最高的 Landsat 场景会归入层级 1,并被视为… c2 全球 陆地卫星 卫星影像 toa usgs -
USGS Landsat 8 Collection 2 Tier 1 和实时数据原始场景
Landsat 8 集合 2 Tier 1 和实时数据 DN 值,表示经过缩放的校准传感器处辐射亮度。数据质量最高的 Landsat 场景会归入第 1 级,并被认为适合进行时间序列处理分析。第 1 级包括经过处理的 1 级精确地形 (L1TP) … c2 global l8 landsat lc8 nrt -
USGS Landsat 8 Collection 2 Tier 1 和实时数据的大气表观反射率

Landsat 8 Collection 2 Tier 1 和实时数据经过校准的大气表观 (TOA) 反射率。从图片元数据中提取校准系数。有关 TOA 计算的详细信息,请参阅 Chander 等人 (2009)。数据质量最高的 Landsat 场景会放入第 1 级… c2 global l8 landsat lc8 satellite-imagery -
USGS Landsat 8 Collection 2 Tier 2 原始场景

Landsat 8 Collection 2 Tier 2 DN 值,表示经过缩放、校准的传感器处辐射亮度。在处理过程中,不符合第 1 层级条件的场景会被分配到第 2 层级。这包括系统性地形 (L1GT) 和系统性 (L1GS) 处理后的场景,以及任何不…的 L1TP 场景 c2 全球 l8 陆地卫星 lc8 oli-tirs -
USGS Landsat 8 Collection 2 Tier 2 TOA 反射率
Landsat 8 Collection 2 Tier 2 经过校准的大气表观 (TOA) 反射率。从图片元数据中提取校准系数。有关 TOA 计算的详细信息,请参阅 Chander 等人 (2009)。在处理过程中,不符合第 1 层级条件的场景会被分配到第 2 层级。这包括“系统性…” c2 全球 陆地卫星 卫星影像 toa usgs -
USGS Landsat 8 Level 2,Collection 2,Tier 1
此数据集包含大气校正后的地表反射率和地表温度,这些数据均源自 Landsat 8 OLI/TIRS 传感器生成的数据。这些图像包含 5 个可见光和近红外 (VNIR) 波段以及 2 个经过处理的短波红外 (SWIR) 波段(正射校正的地表反射率),以及 1 个热红外波段。 cfmask cloud fmask global l8sr landsat -
USGS Landsat 8 第 2 级、集合 2、层级 2
此数据集包含大气校正后的地表反射率和地表温度,这些数据均源自 Landsat 8 OLI/TIRS 传感器生成的数据。这些图像包含 5 个可见光和近红外 (VNIR) 波段以及 2 个经过处理的短波红外 (SWIR) 波段(正射校正的地表反射率),以及 1 个热红外波段。 cfmask cloud fmask global l8sr landsat -
USGS Landsat 9 Collection 2 Tier 1 原始场景
Landsat 9 Collection 2 Tier 1 DN 值,表示经过缩放、校准的传感器处辐射亮度。数据质量最高的 Landsat 场景会归入第 1 级,并被认为适合进行时间序列处理分析。第 1 级包括经过 L1TP 处理的数据,这些数据具有… c2 全球 l9 陆地卫星 lc9 oli-tirs -
USGS Landsat 9 Collection 2 Tier 1 TOA 反射率
Landsat 9 Collection 2 Tier 1 经过校准的大气表观 (TOA) 反射率。从图片元数据中提取校准系数。有关 TOA 计算的详细信息,请参阅 Chander 等人 (2009)。数据质量最高的 Landsat 场景会归入层级 1,并被视为… c2 全球 陆地卫星 卫星影像 toa usgs -
USGS Landsat 9 Collection 2 Tier 2 原始场景
Landsat 9 Collection 2 Tier 2 DN 值,表示经过缩放和校准的传感器处辐射亮度。在处理过程中,不符合第 1 层级条件的场景会被分配到第 2 层级。这包括系统性地形 (L1GT) 和系统性 (L1GS) 处理后的场景,以及任何不…的 L1TP 场景 c2 全球 l9 陆地卫星 lc9 oli-tirs -
USGS Landsat 9 Collection 2 Tier 2 TOA 反射率
Landsat 9 Collection 2 Tier 2 经过校准的大气表观 (TOA) 反射率。从图片元数据中提取校准系数。有关 TOA 计算的详细信息,请参阅 Chander 等人 (2009)。在处理过程中,不符合第 1 层级条件的场景会被分配到第 2 层级。这包括“系统性…” c2 global l9 landsat lc9 satellite-imagery -
USGS Landsat 9 Level 2,Collection 2,Tier 1
此数据集包含大气校正后的地表反射率和地表温度,这些数据均源自 Landsat 9 OLI/TIRS 传感器生成的数据。这些图像包含 5 个可见光和近红外 (VNIR) 波段以及 2 个经过处理的短波红外 (SWIR) 波段(正射校正的地表反射率),以及 1 个热红外波段。 cfmask cloud fmask global l9sr landsat -
USGS Landsat 9 Level 2,Collection 2,Tier 2
此数据集包含大气校正后的地表反射率和地表温度,这些数据均源自 Landsat 9 OLI/TIRS 传感器生成的数据。这些图像包含 5 个可见光和近红外 (VNIR) 波段以及 2 个经过处理的短波红外 (SWIR) 波段(正射校正的地表反射率),以及 1 个热红外波段。 cfmask cloud fmask global l9sr landsat -
联合国地理空间数据:BNDA_simplified
联合国地理空间数据(简称“地理数据”)是联合国在全球范围内收集的地理空间数据集。联合国地理数据旨在帮助联合国准备地图资料,其中包含几何图形、属性和标签,以便充分描绘和命名… 边界 国家/地区 基础设施边界 表格 -
美国干旱监测

美国干旱监测图每周四发布,显示美国境内出现干旱的地区。该地图使用五种分类:异常干旱 (D0),表示可能正进入或走出干旱的区域;以及四种干旱程度:… community-dataset drought noaa precipitation sat-io usda -
VIIRS 夜间日间/夜间年度波段合成 V2.1

年度全球 VIIRS 夜间灯光数据集是一个时间序列,由 2013 年至 2021 年的月度无云平均辐射网格生成。2022 年的数据可在 NOAA/VIIRS/DNB/ANNUAL_V22 数据集中找到。初始过滤步骤移除了阳光照射、月光照射和多云的像素,从而生成粗略的合成图像,… annual dnb eog lights nighttime noaa -
VIIRS 夜间日间年度波段合成影像 V2.2

年度全球 VIIRS 夜间灯光数据集是一个时间序列,由 2022 年的月度无云平均辐射网格生成。如需查看更早年份的数据,请参阅 NOAA/VIIRS/DNB/ANNUAL_V21 数据集。初始过滤步骤移除了阳光照射、月光照射和多云的像素,从而生成包含以下内容的粗略合成图像… annual dnb eog lights nighttime noaa -
VIIRS 夜间昼夜波段合成图版本 1

使用可见光红外成像辐射计套件 (VIIRS) 昼夜频段 (DNB) 的夜间数据生成的月平均辐射合成图像。由于这些数据是按月合成的,因此全球许多地区都无法获得当月优质的数据覆盖。… dnb eog lights monthly nighttime noaa -
VIIRS 杂散光校正夜间昼夜波段合成影像版本 1

使用可见光红外成像辐射计套件 (VIIRS) 昼夜频段 (DNB) 的夜间数据生成的月平均辐射合成图像。由于这些数据是按月合成的,因此全球许多地区都无法获得当月优质的数据覆盖。… dnb eog lights monthly nighttime noaa -
VJ114IMGTDL_NRT 日常栅格:VIIRS (NOAA-20) 375 米活动火点

NOAA-20 (JPSS-1) 可见光红外成像辐射计套件 (VIIRS) 主动火点探测产品基于该仪器的 375 米标称分辨率数据。与其他粗分辨率(≥ 1 公里)卫星火灾探测产品相比,改进后的 375 米数据在探测相对较小的火灾时具有更高的响应能力… eosdis 火灾 firms 地球物理 热点 lance -
VNP09GA:VIIRS 地表反射率每日 500 米和 1 公里

可见光红外成像辐射计套件 (VIIRS) 每日地表反射率 (VNP09GA) 产品可提供来自 Suomi 国家极地轨道合作伙伴卫星计划 (S-NPP) VIIRS 传感器的陆地表面反射率估计值。提供的数据包含三个影像波段(I1、I2、I3),名义分辨率为 500 米(约 463 米)… daily nasa noaa npp reflectance satellite-imagery -
VNP09H1:VIIRS 地表反射率 8 天 L3 全球 500 米

8 天可见光红外成像辐射仪套件 (VIIRS) 地表反射率 (VNP09H1) 第 1 版合成产品可提供 Suomi 国家极轨伙伴卫星 (Suomi NPP) VIIRS 传感器在标称分辨率 500 米(约 463 米)的三个影像波段(I1、I2、I3)的地表反射率估计值。… daily nasa noaa npp reflectance satellite-imagery -
VNP13A1.002:VIIRS 植被指数 16 天 500 米

Suomi 国家极地轨道合作伙伴卫星计划 (S-NPP) NASA 可见光红外成像辐射计套件 (VIIRS) 植被指数 (VNP13A1) 数据产品通过在 16 天的采集期内选择最佳可用像素(分辨率为 500 米)来提供植被指数。VNP13 数据产品的设计目标是… 16 天 evi nasa ndvi noaa npp -
VNP14A1.002:热异常/火灾每日 L3 全球 1 公里 SIN 网格

Suomi 国家极地轨道合作伙伴卫星计划 NASA 可见光红外成像辐射计套件 (VIIRS) 热异常/火灾 (VNP14A1) 第 1 版数据产品可提供有关活跃火灾和其他热异常的每日信息。VNP14A1 数据产品是全球 1 公里网格化火灾像素合成数据,这些像素是从 … fire land nasa noaa surface viirs -
VNP14IMGTDL_NRT 日光栅:VIIRS (S-NPP) 375 米波段活动火点

Suomi NPP 可见光红外成像辐射计套件 (VIIRS) 主动火点探测产品基于该仪器的 375 米标称分辨率数据。与其他粗分辨率(≥ 1 公里)卫星火灾探测产品相比,改进后的 375 米数据在探测相对较小的火灾时具有更高的响应能力… eosdis 火灾 firms 地球物理 热点 lance -
VNP15A2H:LAI/FPAR 8 天 L4 全球 500 米 SIN 网格

可见光红外成像辐射计套件 (VIIRS) 叶面积指数 (LAI) 和光合有效辐射吸收比 (FPAR) 版本 1 数据产品以 500 米分辨率 (VNP15A2H) 提供有关植被冠层的信息。VIIRS 传感器位于 NOAA/NASA 联合 Suomi 国家… land nasa noaa surface vegetation-indices viirs -
VNP21A1D.002:1 公里逐日白天陆地表面温度与发射率
NASA Suomi 国家极地轨道合作伙伴卫星计划 (Suomi NPP) 可见光红外成像辐射计套件 (VIIRS) 地表温度与发射率 (LST&E) 昼间第 1 版产品 (VNP21A1D),系由昼间 2 级格网 (L2G) 中间产品每日汇编而成。L2G 流程可将每日 VNP21 轨道分片数据映射到… climate daily day land nasa noaa -
VNP21A1N.002:1 公里逐日夜间地表温度与发射率

NASA Suomi 国家极地轨道合作伙伴卫星计划 (Suomi NPP) 可见光红外成像辐射计套件 (VIIRS) 地表温度与发射率 (LST&E) 夜间第 1 版产品 (VNP21A1N),系由夜间 2 级格网 (L2G) 中间产品每日汇编而成。L2G 流程可将每日 VNP21 轨道分片数据映射到… climate daily land nasa night noaa -
VNP22Q2:地表物候年度 L3 全球 500 米 SIN 网格

Suomi 国家极地轨道合作伙伴卫星计划 (Suomi NPP) NASA 可见光红外成像辐射计套件 (VIIRS) 地表覆盖动态数据产品以年度间隔提供全球地表物候 (GLSP) 指标。VNP22Q2 数据产品源自双波段增强型植被指数 (EVI2) 的时间序列… land landuse-landcover nasa ndvi noaa npp -
VNP43IA1:BRDF/反照率模型参数每日 L3 全球 500 米 SIN 网格

Suomi 国家极地轨道合作伙伴卫星计划 (Suomi NPP) NASA 可见光红外成像辐射计套件 (VIIRS) 双向反射率分布函数 (BRDF) 和反照率模型参数 (VNP43IA1) 第 1 版产品以 500 米分辨率提供核权重(参数)。VNP43IA1 产品每天使用 16 天的 VIIRS 数据生成… land nasa noaa satellite-imagery surface viirs -
VNP43IA2:BRDF/反照率质量每日 L3 全球 500 米 SIN 网格

Suomi 国家极地轨道合作伙伴卫星计划 (Suomi NPP) NASA 可见光红外成像辐射计套件 (VIIRS) 双向反射率分布函数 (BRDF) 和反照率质量 (VNP43IA2) 第 1 版产品以 500 米分辨率提供 BRDF 和反照率质量。VNP43IA2 产品每天使用 16 天的 VIIRS 数据生成… land nasa noaa satellite-imagery surface viirs -
VNP43IA4:BRDF/反照率质量每日 L3 全球 500 米 SIN 网格
NASA/NOAA Suomi 国家极地轨道合作伙伴卫星计划 (Suomi NPP) 可见光红外成像辐射计套件 (VIIRS) 天底双向反射率分布函数 (BRDF) 调整反射率 (NBAR) 第 2 版产品以 500 米分辨率提供 NBAR 估计值。VNP43IA4 产品每天使用 16 天的 VIIRS 数据生成… brdf land nasa noaa satellite-imagery surface -
VNP46A1:VIIRS 每日格网昼夜波段 500 米线性纬度经度网格夜间

Suomi 国家极地轨道合作伙伴卫星计划 (SNPP) 可见光红外成像辐射计套件 (VIIRS) 支持昼夜频段 (DNB) 传感器,该传感器可提供全球每日夜间可见光和近红外 (NIR) 光测量数据,适用于地球系统科学和应用。VIIRS DNB 在低光照条件下的超高灵敏度… daily dnb nasa noaa population viirs -
VNP46A2:VIIRS 月球间隙填充 BRDF 夜间灯光每日 L3 全球 500 米
Suomi 国家极地轨道合作伙伴卫星计划 (SNPP) 可见光红外成像辐射计套件 (VIIRS) 支持昼夜频段 (DNB) 传感器,该传感器可提供全球每日夜间可见光和近红外(NIR) 光测量数据,适用于地球系统科学和应用。VIIRS DNB 在弱光条件下的超高灵敏度… brdf daily nasa nighttime noaa population -
VNP64A1:月度 L4 全球 500 米 SIN 网格火烧迹地

Suomi 国家极地轨道合作伙伴卫星计划 (Suomi NPP) NASA 可见光红外成像辐射计套件 (VIIRS) 烧毁面积 (VNP64A1) 第 1 版数据产品是一种每月更新的全球格网化 500 米产品,包含每个像素的烧毁面积和质量信息。VNP64 烧毁面积测绘方法采用 750 米 VIIRS … burn change-detection fire land nasa noaa -
WAPOR 实际蒸发蒸腾量和截留量 2.0

实际蒸散量和截留量 (ETIa)(旬,单位为 mm/天)是土壤蒸发量 (E)、冠层蒸腾量 (T) 和被叶片截留的降雨蒸发量 (I) 的总和。每个像素的值表示特定旬的平均每日 ETIa。 农业 粮农组织 wapor 水 水蒸气 -
WAPOR 实际蒸发蒸腾量和截留量 3.0

实际蒸散量和截留量 (ETIa)(旬,单位为 mm/天)是土壤蒸发量 (E)、冠层蒸腾量 (T) 和被叶片截留的降雨蒸发量 (I) 的总和。每个像素的值表示特定旬的平均每日 ETIa。 农业 粮农组织 wapor 水 水蒸气 -
WAPOR Daily Reference Evapotranspiration 2.0

参考蒸散量 (RET) 是指假设的参考作物的蒸散量,它模拟了水分充足的草地表面的行为。每个像素表示以毫米为单位的每日参考蒸散量。 农业 粮农组织 wapor 水 水蒸气 -
WAPOR Daily Reference Evapotranspiration 3.0
参考蒸散量 (RET) 是指假设的参考作物的蒸散量,它模拟了水分充足的草地表面的行为。每个像素表示以毫米为单位的每日参考蒸散量。 农业 粮农组织 wapor 水 水蒸气 -
WAPOR Dekadal Evaporation 2.0

蒸发 (E) 数据分量(以旬为单位,单位为 mm/天)是土壤表面的实际蒸发量。每个像素的值表示相应旬的平均每日实际蒸发量。 农业 粮农组织 wapor 水 水蒸气 -
WAPOR Dekadal Evaporation 3.0
蒸发 (E) 数据分量(以旬为单位,单位为 mm/天)是土壤表面的实际蒸发量。每个像素的值表示相应旬的平均每日实际蒸发量。 农业 粮农组织 wapor 水 水蒸气 -
WAPOR Dekadal Interception 2.0

截留 (I) 数据分量(旬,单位为 mm/天)表示植被冠层截留的降雨蒸发量。截留是指降雨被树叶截获的过程。其中一部分收集到的雨水会再次蒸发。每个像素的值表示平均… 农业 粮农组织 wapor 水 水蒸气 -
WAPOR Dekadal Interception 3.0
截留 (I) 数据分量(旬,单位为 mm/天)表示植被冠层截留的降雨蒸发量。截留是指降雨被树叶截获的过程。其中一部分收集到的雨水会再次蒸发。每个像素的值表示平均… 农业 粮农组织 wapor 水 水蒸气 -
WAPOR 十天净初级生产力 2.0

净初级生产力 (NPP) 是生态系统的一项基本特征,表示在光合作用驱动下二氧化碳转化为生物质的程度。像素值表示相应旬的平均每日 NPP。 农业 粮农组织 植物生产力 wapor 水 -
WAPOR 旬参考蒸散量 2.0

参考蒸散量 (RET) 是指假设的参考作物的蒸散量,它模拟了水分充足的草地表面的行为。每个像素的值表示相应旬的日参考蒸散量的平均值。 农业 粮农组织 wapor 水 水蒸气 -
WAPOR 旬参考蒸散量 3.0
参考蒸散量 (RET) 是指假设的参考作物的蒸散量,它模拟了水分充足的草地表面的行为。每个像素的值表示相应旬的日参考蒸散量的平均值。 农业 粮农组织 wapor 水 水蒸气 -
WAPOR Dekadal Transpiration 2.0

蒸腾量 (T) 数据分量(以旬为单位,单位为 mm/天)是植被冠层的实际蒸腾量。每个像素的值表示相应旬的平均每日实际蒸腾量。 农业 粮农组织 wapor 水 水蒸气 -
WAPOR Dekadal Transpiration 3.0

蒸腾量 (T) 数据分量(以旬为单位,单位为 mm/天)是植被冠层的实际蒸腾量。每个像素的值表示相应旬的平均每日实际蒸腾量。 农业 fao 全球 wapor 水 水蒸气 -
WCMC 地上和地下生物质碳密度

此数据集表示 2010 年左右的地上和地下陆地碳储存量(每公顷 (ha) 的碳 (C) 吨数 (t))。该数据集是通过合并最可靠的公开数据集,并将其与 2010 年的 ESA CCI 地表覆盖地图叠加而构建的(ESA,… 生物质 碳 森林生物质 wcmc -
WDKBA:世界关键生物多样性区域 (KBA) 数据库 - 2025 年 9 月

如果您有兴趣访问 KBA 数据集,请填写 KBA 数据请求表单,以便在获得批准后直接在 GEE 中访问该数据集。关键生物多样性区域 (KBA) 是“对全球生物多样性的持续存在做出重大贡献的地点”,包括陆地、淡水和海洋生态系统。… biodiversity boundaries ecosystems global iucn management -
WDOECM:其他基于有效面积的保护措施(点)

除保护区以外的地理定义区域,其管理方式可为生物多样性的原位保护带来积极且可持续的长期成果,并具有相关的生态系统功能和服务,以及(如适用)文化、精神、社会经济和其他本地… boundaries ecosystems iucn marine mpa protected -
WDOECM:其他有效的基于区域的保护措施(多边形)
除保护区以外的地理定义区域,其管理方式可为生物多样性的原位保护带来积极且可持续的长期成果,并具有相关的生态系统功能和服务,以及(如适用)文化、精神、社会经济和其他本地… boundaries ecosystems iucn marine mpa protected -
WDPA:世界保护区数据库(点)

世界保护区数据库 (WDPA) 是有关保护区的最新最完整的信息来源,每月都会根据政府、非政府组织、土地所有者和社区提交的数据进行更新。该数据库由联合国环境规划署世界保护监测中心 (UNEP-WCMC) 管理,其中包含… boundaries ecosystems iucn marine mpa protected -
WDPA:世界保护区数据库(多边形)

世界保护区数据库 (WDPA) 是有关保护区的最新最完整的信息来源,每月都会根据政府、非政府组织、土地所有者和社区提交的数据进行更新。该数据库由联合国环境规划署世界保护监测中心 (UNEP-WCMC) 管理,其中包含… boundaries ecosystems iucn marine mpa protected -
WHRC 泛热带国家级碳储量数据集

热带国家/地区 500 米分辨率的地上活体木质生物量密度国家级地图。此数据集由共同位置的实地测量数据、LiDAR 观测数据和中等分辨率成像光谱辐射计 (MODIS) 记录的图像组合而成。 地上 生物质 碳 森林生物质 地球物理 UMD -
WRI Aqueduct 基准年度版本 4.0

Aqueduct 4.0 是 WRI 水风险框架的最新迭代版本,旨在将复杂的水文数据转化为直观的用水相关风险指标。该数据集将 13 个与水量、水质和声誉问题相关的水风险指标纳入一个综合框架中。对于 5 个… aqueduct flood monitoring surface-ground-water table wri -
WRI Aqueduct 基准月度版本 4.0

Aqueduct 4.0 是 WRI 水风险框架的最新迭代版本,旨在将复杂的水文数据转化为直观的用水相关风险指标。该数据集将 13 个与水量、水质和声誉问题相关的水风险指标纳入一个综合框架中。对于 5 个… aqueduct flood monitoring surface-ground-water table wri -
WRI Aqueduct 洪灾风险地图版本 2

Aqueduct Floods 数据可衡量在当前基准条件和 2030 年、2050 年和 2080 年的未来预测情景下,河流和沿海地区的洪涝风险。除了提供洪水灾害地图和评估风险外,Aqueduct Floods 还可以帮助进行全面的成本效益分析,以评估堤坝的价值… flood monitoring surface-ground-water wri -
WRI Aqueduct Future 年度版本 4.0

Aqueduct 4.0 是 WRI 水风险框架的最新迭代版本,旨在将复杂的水文数据转化为直观的用水相关风险指标。该数据集将 13 个与水量、水质和声誉问题相关的水风险指标纳入一个综合框架中。对于 5 个… aqueduct flood monitoring surface-ground-water table wri -
WRI/Google DeepMind 全球森林损失驱动因素 2001-2022 年 v1.0

此数据集以 1 公里分辨率绘制了 2001 年至 2022 年全球森林覆盖损失的主要驱动因素。该数据由世界资源研究所 (WRI) 和 Google DeepMind 共同制作,是使用在全球范围内收集的一组样本训练的全球神经网络模型 (ResNet) 开发而成… 农业 森林砍伐 森林 森林生物质 Google landandcarbon -
WRI/Google DeepMind 全球森林损失驱动因素 2001-2023 年 v1.1

此数据集以 1 公里分辨率绘制了 2001 年至 2023 年全球树木覆盖损失的主要驱动因素。该数据由世界资源研究所 (WRI) 和 Google DeepMind 共同制作,是使用在全球范围内收集的一组样本训练的全球神经网络模型 (ResNet) 开发而成… 农业 森林砍伐 森林 森林生物质 Google landandcarbon -
WRI/Google DeepMind,“2001-2024 年全球森林损失驱动因素”v1.2

此数据集以 1 公里分辨率绘制了 2001 年至 2024 年全球森林覆盖损失的主要驱动因素。该数据由世界资源研究所 (WRI) 和 Google DeepMind 共同制作,是使用在全球范围内收集的一组样本训练的全球神经网络模型 (ResNet) 开发而成… 农业 森林砍伐 森林 森林生物质 Google landandcarbon -
WWF HydroATLAS 流域级别 03

BasinATLAS 是 HydroATLAS 数据库的一个组成部分,而 HydroATLAS 数据库又是 HydroSHEDS 的一个组成部分。BasinATLAS 提供了一份标准化的水文环境属性信息汇编,其中包含全球所有流域的高空间分辨率数据。此数据集包含 56 个变量的数据,分为 281 个属性和… 地球物理 hydroatlas 水文 水文学 hydrosheds srtm -
WWF HydroATLAS 流域级别 04

BasinATLAS 是 HydroATLAS 数据库的一个组成部分,而 HydroATLAS 数据库又是 HydroSHEDS 的一个组成部分。BasinATLAS 提供了一份标准化的水文环境属性信息汇编,其中包含全球所有流域的高空间分辨率数据。此数据集包含 56 个变量的数据,分为 281 个属性和… 地球物理 hydroatlas 水文 水文学 hydrosheds srtm -
WWF HydroATLAS 流域级别 05

BasinATLAS 是 HydroATLAS 数据库的一个组成部分,而 HydroATLAS 数据库又是 HydroSHEDS 的一个组成部分。BasinATLAS 提供了一份标准化的水文环境属性信息汇编,其中包含全球所有流域的高空间分辨率数据。此数据集包含 56 个变量的数据,分为 281 个属性和… 地球物理 hydroatlas 水文 水文学 hydrosheds srtm -
WWF HydroATLAS 流域级别 06
BasinATLAS 是 HydroATLAS 数据库的一个组成部分,而 HydroATLAS 数据库又是 HydroSHEDS 的一个组成部分。BasinATLAS 提供了一份标准化的水文环境属性信息汇编,其中包含全球所有流域的高空间分辨率数据。此数据集包含 56 个变量的数据,分为 281 个属性和… 地球物理 hydroatlas 水文 水文学 hydrosheds srtm -
WWF HydroATLAS 流域第 07 级
BasinATLAS 是 HydroATLAS 数据库的一个组成部分,而 HydroATLAS 数据库又是 HydroSHEDS 的一个组成部分。BasinATLAS 提供了一份标准化的水文环境属性信息汇编,其中包含全球所有流域的高空间分辨率数据。此数据集包含 56 个变量的数据,分为 281 个属性和… 地球物理 hydroatlas 水文 水文学 hydrosheds srtm -
WWF HydroATLAS 流域级别 08

BasinATLAS 是 HydroATLAS 数据库的一个组成部分,而 HydroATLAS 数据库又是 HydroSHEDS 的一个组成部分。BasinATLAS 提供了一份标准化的水文环境属性信息汇编,其中包含全球所有流域的高空间分辨率数据。此数据集包含 56 个变量的数据,分为 281 个属性和… 地球物理 hydroatlas 水文 水文学 hydrosheds srtm -
WWF HydroATLAS 流域级别 09

BasinATLAS 是 HydroATLAS 数据库的一个组成部分,而 HydroATLAS 数据库又是 HydroSHEDS 的一个组成部分。BasinATLAS 提供了一份标准化的水文环境属性信息汇编,其中包含全球所有流域的高空间分辨率数据。此数据集包含 56 个变量的数据,分为 281 个属性和… 地球物理 hydroatlas 水文 水文学 hydrosheds srtm -
WWF HydroATLAS 流域级别 10
BasinATLAS 是 HydroATLAS 数据库的一个组成部分,而 HydroATLAS 数据库又是 HydroSHEDS 的一个组成部分。BasinATLAS 提供了一份标准化的水文环境属性信息汇编,其中包含全球所有流域的高空间分辨率数据。此数据集包含 56 个变量的数据,分为 281 个属性和… 地球物理 hydroatlas 水文 水文学 hydrosheds srtm -
WWF HydroATLAS 流域级别 11

BasinATLAS 是 HydroATLAS 数据库的一个组成部分,而 HydroATLAS 数据库又是 HydroSHEDS 的一个组成部分。BasinATLAS 提供了一份标准化的水文环境属性信息汇编,其中包含全球所有流域的高空间分辨率数据。此数据集包含 56 个变量的数据,分为 281 个属性和… 地球物理 hydroatlas 水文 水文学 hydrosheds srtm -
WWF HydroATLAS 流域级别 12

BasinATLAS 是 HydroATLAS 数据库的一个组成部分,而 HydroATLAS 数据库又是 HydroSHEDS 的一个组成部分。BasinATLAS 提供了一份标准化的水文环境属性信息汇编,其中包含全球所有流域的高空间分辨率数据。此数据集包含 56 个变量的数据,分为 281 个属性和… 地球物理 hydroatlas 水文 水文学 hydrosheds srtm -
WWF HydroSHEDS 盆地级别 1
HydroSHEDS 是一种地图产品,可提供格式一致的水文地理信息,适用于区域和全球范围的应用。它提供了一套不同比例的地理参考数据集(矢量和栅格),包括河流网络、流域边界、排水方向和流量累积。HydroSHEDS 基于… 地球物理 水文地理 水文 HydroSHEDS SRTM 地表水-地下水 -
WWF HydroSHEDS 流域第 10 级
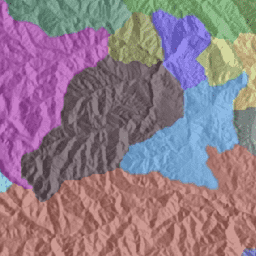
HydroSHEDS 是一种地图产品,可提供格式一致的水文地理信息,适用于区域和全球范围的应用。它提供了一套不同比例的地理参考数据集(矢量和栅格),包括河流网络、流域边界、排水方向和流量累积。HydroSHEDS 基于… 地球物理 水文地理 水文 HydroSHEDS SRTM 地表水-地下水 -
WWF HydroSHEDS 盆地级别 11

HydroSHEDS 是一种地图产品,可提供格式一致的水文地理信息,适用于区域和全球范围的应用。它提供了一套不同比例的地理参考数据集(矢量和栅格),包括河流网络、流域边界、排水方向和流量累积。HydroSHEDS 基于… 地球物理 水文地理 水文 HydroSHEDS SRTM 地表水-地下水 -
WWF HydroSHEDS 盆地级别 12

HydroSHEDS 是一种地图产品,可提供格式一致的水文地理信息,适用于区域和全球范围的应用。它提供了一套不同比例的地理参考数据集(矢量和栅格),包括河流网络、流域边界、排水方向和流量累积。HydroSHEDS 基于… 地球物理 水文地理 水文 HydroSHEDS SRTM 地表水-地下水 -
WWF HydroSHEDS 盆地级别 2

HydroSHEDS 是一种地图产品,可提供格式一致的水文地理信息,适用于区域和全球范围的应用。它提供了一套不同比例的地理参考数据集(矢量和栅格),包括河流网络、流域边界、排水方向和流量累积。HydroSHEDS 基于… 地球物理 水文地理 水文 HydroSHEDS SRTM 地表水-地下水 -
WWF HydroSHEDS 盆地级别 3

HydroSHEDS 是一种地图产品,可提供格式一致的水文地理信息,适用于区域和全球范围的应用。它提供了一套不同比例的地理参考数据集(矢量和栅格),包括河流网络、流域边界、排水方向和流量累积。HydroSHEDS 基于… 地球物理 水文地理 水文 HydroSHEDS SRTM 地表水-地下水 -
WWF HydroSHEDS 盆地级别 4

HydroSHEDS 是一种地图产品,可提供格式一致的水文地理信息,适用于区域和全球范围的应用。它提供了一套不同比例的地理参考数据集(矢量和栅格),包括河流网络、流域边界、排水方向和流量累积。HydroSHEDS 基于… 地球物理 水文地理 水文 HydroSHEDS SRTM 地表水-地下水 -
WWF HydroSHEDS 盆地级别 5

HydroSHEDS 是一种地图产品,可提供格式一致的水文地理信息,适用于区域和全球范围的应用。它提供了一套不同比例的地理参考数据集(矢量和栅格),包括河流网络、流域边界、排水方向和流量累积。HydroSHEDS 基于… 地球物理 水文地理 水文 HydroSHEDS SRTM 地表水-地下水 -
WWF HydroSHEDS 盆地第 6 级

HydroSHEDS 是一种地图产品,可提供格式一致的水文地理信息,适用于区域和全球范围的应用。它提供了一套不同比例的地理参考数据集(矢量和栅格),包括河流网络、流域边界、排水方向和流量累积。HydroSHEDS 基于… 地球物理 水文地理 水文 HydroSHEDS SRTM 地表水-地下水 -
WWF HydroSHEDS 盆地第 7 级

HydroSHEDS 是一种地图产品,可提供格式一致的水文地理信息,适用于区域和全球范围的应用。它提供了一套不同比例的地理参考数据集(矢量和栅格),包括河流网络、流域边界、排水方向和流量累积。HydroSHEDS 基于… 地球物理 水文地理 水文 HydroSHEDS SRTM 地表水-地下水 -
WWF HydroSHEDS 盆地级别 8

HydroSHEDS 是一种地图产品,可提供格式一致的水文地理信息,适用于区域和全球范围的应用。它提供了一套不同比例的地理参考数据集(矢量和栅格),包括河流网络、流域边界、排水方向和流量累积。HydroSHEDS 基于… 地球物理 水文地理 水文 HydroSHEDS SRTM 地表水-地下水 -
WWF HydroSHEDS 盆地级别 9

HydroSHEDS 是一种地图产品,可提供格式一致的水文地理信息,适用于区域和全球范围的应用。它提供了一套不同比例的地理参考数据集(矢量和栅格),包括河流网络、流域边界、排水方向和流量累积。HydroSHEDS 基于… 地球物理 水文地理 水文 HydroSHEDS SRTM 地表水-地下水 -
WWF HydroSHEDS 排水方向,15 角秒
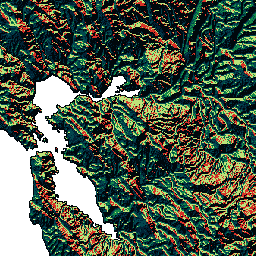
HydroSHEDS 是一种地图产品,可提供格式一致的水文地理信息,适用于区域和全球范围的应用。它提供了一套不同比例的地理参考数据集(矢量和栅格),包括河流网络、流域边界、排水方向和流量累积。HydroSHEDS 基于… 方向 排水 流向 地球物理 水文地理 水文 -
WWF HydroSHEDS 排水方向,3 角秒

HydroSHEDS 是一种地图产品,可提供格式一致的水文地理信息,适用于区域和全球范围的应用。它提供了一套不同比例的地理参考数据集(矢量和栅格),包括河流网络、流域边界、排水方向和流量累积。HydroSHEDS 基于… 方向 排水 流向 地球物理 水文地理 水文 -
WWF HydroSHEDS 排水方向,30 角秒

HydroSHEDS 是一种地图产品,可提供格式一致的水文地理信息,适用于区域和全球范围的应用。它提供了一套不同比例的地理参考数据集(矢量和栅格),包括河流网络、流域边界、排水方向和流量累积。HydroSHEDS 基于… 方向 排水 流向 地球物理 水文地理 水文 -
WWF HydroSHEDS 流向累积,15 角秒

HydroSHEDS 是一种地图产品,可提供格式一致的水文地理信息,适用于区域和全球范围的应用。它提供了一套不同比例的地理参考数据集(矢量和栅格),包括河流网络、流域边界、排水方向和流量累积。HydroSHEDS 基于… 累积 排水 流动 地球物理 水文地理 水文 -
WWF HydroSHEDS 流向累积,30 角秒

HydroSHEDS 是一种地图产品,可提供格式一致的水文地理信息,适用于区域和全球范围的应用。它提供了一套不同比例的地理参考数据集(矢量和栅格),包括河流网络、流域边界、排水方向和流量累积。HydroSHEDS 基于… 累积 排水 流动 地球物理 水文地理 水文 -
WWF HydroSHEDS Free Flowing Rivers Network v1
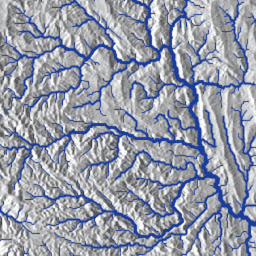
HydroSHEDS 是一种地图产品,可提供格式一致的水文地理信息,适用于区域和全球范围的应用。它提供了一套不同比例的地理参考数据集(矢量和栅格),包括河流网络、流域边界、排水方向和流量累积。HydroSHEDS 基于… 地球物理 水文地理 水文 HydroSHEDS SRTM 地表水-地下水 -
WWF HydroSHEDS 水文条件 DEM,15 角秒

HydroSHEDS 是一种地图产品,可提供格式一致的水文地理信息,适用于区域和全球范围的应用。它提供了一套不同比例的地理参考数据集(矢量和栅格),包括河流网络、流域边界、排水方向和流量累积。HydroSHEDS 基于… 有条件 dem 海拔 地球物理 水文 水文 -
WWF HydroSHEDS 水文条件 DEM,3 角秒
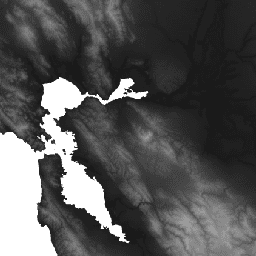
HydroSHEDS 是一种地图产品,可提供格式一致的水文地理信息,适用于区域和全球范围的应用。它提供了一套不同比例的地理参考数据集(矢量和栅格),包括河流网络、流域边界、排水方向和流量累积。HydroSHEDS 基于… 有条件 dem 海拔 地球物理 水文 水文 -
WWF HydroSHEDS 水文条件 DEM,30 角秒
HydroSHEDS 是一种地图产品,可提供格式一致的水文地理信息,适用于区域和全球范围的应用。它提供了一套不同比例的地理参考数据集(矢量和栅格),包括河流网络、流域边界、排水方向和流量累积。HydroSHEDS 基于… 有条件 dem 海拔 地球物理 水文 水文 -
WWF HydroSHEDS 空白填充 DEM,3 角秒
HydroSHEDS 是一种地图产品,可提供格式一致的水文地理信息,适用于区域和全球范围的应用。它提供了一套不同比例的地理参考数据集(矢量和栅格),包括河流网络、流域边界、排水方向和流量累积。HydroSHEDS 基于… dem elevation geophysical hydrography hydrology hydrosheds -
WeatherNext 2

WeatherNext 2 是一个实验性数据集,包含由 Google DeepMind 的功能网络生成式天气模型的业务版本生成的全球中期集合天气预报。此实验性数据集包含实时数据和历史数据。实时数据是指与… climate forecast gcp-public-data-weathernext precipitation publisher-dataset temperature -
WeatherNext Gen 预报

WeatherNext Gen 是一个实验性数据集,包含由 Google DeepMind 的基于扩散的集合天气模型的业务版本生成的全球中期集合天气预报。此实验性数据集包含实时数据和历史数据。实时数据是指与不超过 48 小时前的时间相关的所有数据… climate forecast gcp-public-data-weathernext precipitation publisher-dataset temperature -
WeatherNext 图表预报

WeatherNext Graph 是一个实验性数据集,包含由 Google DeepMind 的图形神经网络天气模型的业务版本生成的全球中期天气预报。此实验性数据集包含实时数据和历史数据。实时数据是指与不超过 48 小时前的时间相关的所有数据… climate forecast gcp-public-data-weathernext precipitation publisher-dataset temperature -
社区野火风险 v0

此数据集描绘了美国所有土地的野火风险构成要素,这些要素:1) 覆盖整个景观(即,可在景观中的每个像素处进行测量);2) 代表原位风险 - 在发生不利影响的位置的风险… 烧伤 火灾 美国农业部 野火 -
World Settlement Footprint 2015

世界聚落足迹 (WSF) 2015 是一张分辨率为 10 米的二元掩码,用于勾勒全球人类聚落的范围,该掩码是根据 2014 年至 2015 年的多时相 Landsat-8 和 Sentinel-1 影像(分别处理了约 217,000 个和约 107,000 个场景)得出的。人类住区的时空动态变化… landcover landsat-derived population sentinel1-derived settlement urban -
WorldClim BIO 变量 V1

WorldClim V1 Bioclim 提供从月度温度和降雨量得出的生物气候变量,以生成更具生物学意义的值。生物气候变量表示年度趋势(例如,年平均气温、年降水量)、季节性(例如,气温和降水量的年变化范围)和极端… 伯克利 气候 月度 降水 温度 天气 -
WorldClim 气候学 V1

WorldClim 版本 1 包含最低温度、平均温度、最高温度和降水量的月度全球平均气候数据。WorldClim 版本 1 由 Robert J. Hijmans、Susan Cameron 和 Juan Parra,加州大学伯克利分校脊椎动物学博物馆,与…合作 伯克利 气候 月度 降水 温度 天气 -
WorldPop 全球项目人口数据:每 100x100 米网格内的常住人口的受限估计年龄和性别结构

全球高分辨率的当代人口分布数据是准确衡量人口增长影响、监控变化和规划干预措施的前提条件。WorldPop 项目旨在通过提供详细且开放的人口数据来满足这些需求… 人口统计 人口 世界人口 -
WorldPop 全球项目人口数据:每 100x100 米网格内的常住人口的估计年龄和性别结构

全球高分辨率的当代人口分布数据是准确衡量人口增长影响、监控变化和规划干预措施的前提条件。WorldPop 项目旨在通过提供详细且开放的人口数据来满足这些需求… 人口统计 人口 世界人口 -
WorldPop 全球项目人口数据:每 100x100 米网格内的估计常住人口

全球高分辨率的当代人口分布数据是准确衡量人口增长影响、监控变化和规划干预措施的前提条件。WorldPop 项目旨在通过提供详细且开放的人口数据来满足这些需求… 人口统计 人口 世界人口 -
YCEO 地表城市热岛:像素级年度白天和夜间强度

此数据集包含全球 1 万多个城市群的白天和夜间年度、夏季和冬季地表城市热岛 (SUHI) 强度。该数据集是使用 MODIS 8 天 TERRA 和 AQUA 地表温度 (LST) 产品、Landscan 城市范围数据创建的。 climate uhi urban yale -
YCEO 地表城市热岛:夏季白天和夜间强度的像素级合成图

此数据集包含全球 1 万多个城市群的白天和夜间年度、夏季和冬季地表城市热岛 (SUHI) 强度。该数据集是使用 MODIS 8 天 TERRA 和 AQUA 地表温度 (LST) 产品、Landscan 城市范围数据创建的。 climate uhi urban yale -
YCEO 地表城市热岛:冬季白天和夜间强度的像素级年度合成

此数据集包含全球 1 万多个城市群的白天和夜间年度、夏季和冬季地表城市热岛 (SUHI) 强度。该数据集是使用 MODIS 8 天 TERRA 和 AQUA 地表温度 (LST) 产品、Landscan 城市范围数据创建的。 climate uhi urban yale -
YCEO Surface Urban Heat Islands: Spatially-Averaged Daytime and Nighttime Intensity for Annual, Summer, and Winter

此数据集包含全球 1 万多个城市群的白天和夜间年度、夏季和冬季地表城市热岛 (SUHI) 强度。该数据集是使用 MODIS 8 天 TERRA 和 AQUA 地表温度 (LST) 产品、Landscan 城市范围数据创建的。 climate uhi urban yale -
YCEO 地表城市热岛:白天和夜间强度的空间平均月度合成

此数据集包含全球 1 万多个城市群的白天和夜间年度、夏季和冬季地表城市热岛 (SUHI) 强度。该数据集是使用 MODIS 8 天 TERRA 和 AQUA 地表温度 (LST) 产品、Landscan 城市范围数据创建的。 climate uhi urban yale -
YCEO 地表城市热岛:年度白天和夜间强度的空间平均年度合成

此数据集包含全球 1 万多个城市群的白天和夜间年度、夏季和冬季地表城市热岛 (SUHI) 强度。该数据集是使用 MODIS 8 天 TERRA 和 AQUA 地表温度 (LST) 产品、Landscan 城市范围数据创建的。 climate uhi urban yale -
geoBoundaries:国家级 (ADM0) 政治行政边界,v6.0.0

GeoBoundaries 全球政治行政边界数据库是一个在线的开放许可资源,其中包含世界各国/地区的边界(即州、县)。目前,系统会跟踪 199 个实体,包括所有 195 个联合国成员国、格陵兰、台湾、纽埃和科索沃。Comprehensive Global … 边界 国家/地区 基础设施边界 表格 -
geoBoundaries:区级 (ADM1) 政治行政边界,v6.0.0

GeoBoundaries 全球政治行政边界数据库是一个在线的开放许可资源,其中包含世界各国/地区的边界(即州、县)。目前,系统会跟踪 199 个实体,包括所有 195 个联合国成员国、格陵兰、台湾、纽埃和科索沃。Comprehensive Global … 边界 国家/地区 基础设施边界 表格 -
geoBoundaries:市级 (ADM2) 政治行政边界,v6.0.0
GeoBoundaries 全球政治行政边界数据库是一个在线的开放许可资源,其中包含世界各国/地区的边界(即州、县)。目前,系统会跟踪 199 个实体,包括所有 195 个联合国成员国、格陵兰、台湾、纽埃和科索沃。Comprehensive Global … 边界 国家/地区 基础设施边界 表格 -
iSDAsoil 散装密度,<2mm 部分
土壤深度为 0-20 厘米和 20-50 厘米时,<2 毫米部分的容重,预测的平均值和标准差。像素值必须通过 x/100 进行反向转换。在茂密丛林地区(通常是非洲中部),模型准确度较低,因此会出现条带状伪影(条纹)… 非洲 isda 土壤 -
iSDAsoil 粘土含量

土壤深度为 0-20 厘米和 20-50 厘米时的黏土含量,预测的平均值和标准差。在茂密丛林地区(通常位于非洲中部),模型准确度较低,因此可能会看到条带状伪影。土壤属性预测由 Innovative … 非洲 黏土 isda 土壤 -
iSDAsoil Depth to Bedrock

0-200 厘米深度的基岩深度,预测的平均值和标准差。由于用于生成数据的潜在农田掩码,许多裸露的岩石区域(基岩深度为 0 厘米)已被遮盖,因此显示为… 非洲 基岩 ISDA 土壤 -
iSDAsoil 有效阳离子交换容量

0-20 厘米和 20-50 厘米土壤深度的有效阳离子交换容量预测平均值和标准差,像素值必须使用 exp(x/10)-1 进行反向转换。在茂密丛林地区(通常是非洲中部),模型准确度较低,因此会出现条带状伪影(条纹)… 非洲 铝 isda 土壤 -
iSDAsoil 可提取钙

土壤深度为 0-20 厘米和 20-50 厘米时的可提取钙,预测的平均值和标准差。像素值必须使用 exp(x/10)-1 进行反向转换。在茂密丛林地区(通常位于非洲中部),模型准确度较低,因此可能会出现条带状伪影(条纹),… 非洲 isda 土壤 -
iSDAsoil 可提取铁

土壤深度为 0-20 厘米和 20-50 厘米时可提取的铁,预测的平均值和标准差。像素值必须使用 exp(x/10)-1 进行反向转换。在茂密丛林地区(通常位于非洲中部),模型准确度较低,因此可能会出现条带状伪影(条纹),… 非洲 isda 土壤 -
iSDAsoil 可提取镁

土壤深度为 0-20 厘米和 20-50 厘米时的可提取镁,预测的平均值和标准差。像素值必须使用 exp(x/10)-1 进行反向转换。在茂密丛林地区(通常位于非洲中部),模型准确度较低,因此可能会出现条带状伪影(条纹),… 非洲 isda 土壤 -
iSDAsoil 可提取磷

土壤深度为 0-20 厘米和 20-50 厘米时的可提取磷,预测的平均值和标准差。像素值必须使用 exp(x/10)-1 进行反向转换。在茂密丛林地区(通常位于非洲中部),模型准确度较低,因此可能会出现条带状伪影(条纹),… 非洲 isda 土壤 -
iSDAsoil 可提取钾

0-20 厘米和 20-50 厘米土壤深度的可提取钾,预测的平均值和标准差。像素值必须使用 exp(x/10)-1 进行反向转换。在茂密丛林地区(通常位于非洲中部),模型准确度较低,因此可能会出现条带状伪影(条纹),… 非洲 isda 土壤 -
iSDAsoil 可提取硫

土壤深度为 0-20 厘米和 20-50 厘米时的可提取硫,预测的平均值和标准差。像素值必须使用 exp(x/10)-1 进行反向转换。在茂密丛林地区(通常位于非洲中部),模型准确度较低,因此可能会出现条带状伪影(条纹),… 非洲 isda 土壤 -
iSDAsoil 可提取锌

土壤深度为 0-20 厘米和 20-50 厘米时的可提取锌,预测的平均值和标准差。像素值必须使用 exp(x/10)-1 进行反向转换。在茂密丛林地区(通常位于非洲中部),模型准确度较低,因此可能会出现条带状伪影(条纹),… 非洲 isda 土壤 -
iSDAsoil 土壤肥力能力分类

使用坡度、化学和物理土壤属性得出的土壤肥力能力分类。如需详细了解此层,请访问此页面。“fcc”频段的类适用于必须使用 x modulo 3000 进行反向转换的像素值。在茂密的丛林地区… 非洲 isda 土壤 -
iSDAsoil 有机碳

0-20 厘米和 20-50 厘米土壤深度的有机碳,预测的平均值和标准差。像素值必须使用 exp(x/10)-1 进行反向转换。在茂密丛林地区(通常位于非洲中部),模型准确度较低,因此可能会出现条带状伪影(条纹),… 非洲 碳 ISDA 土壤 -
iSDAsoil 沙含量

土壤深度为 0-20 厘米和 20-50 厘米时的沙含量,预测的平均值和标准差。在茂密丛林地区(通常位于非洲中部),模型准确度较低,因此可能会看到条带状伪影。土壤属性预测由 Innovative … 非洲 ISDA 沙 土壤 -
iSDAsoil 粉砂含量

土壤深度为 0-20 厘米和 20-50 厘米时的粉沙含量,预测的平均值和标准差。像素值必须使用 exp(x/10)-1 进行反向转换。在茂密丛林地区(通常位于非洲中部),模型准确度较低,因此可能会出现条带状伪影(条纹),… 非洲 isda 土壤 -
iSDAsoil 石块含量

土壤深度为 0-20 厘米和 20-50 厘米时的石块含量,预测的平均值和标准差。像素值必须使用 exp(x/10)-1 进行反向转换。在茂密丛林地区(通常位于非洲中部),模型准确度较低,因此可能会出现条带状伪影(条纹),… 非洲 isda 土壤 -
iSDAsoil 总碳

0-20 厘米和 20-50 厘米土壤深度的总碳量,预测的平均值和标准差。像素值必须使用 exp(x/10)-1 进行反向转换。在茂密丛林地区(通常位于非洲中部),模型准确度较低,因此可能会出现条带状伪影(条纹),… 非洲 铝 isda 土壤 -
iSDAsoil 总氮

0-20 厘米和 20-50 厘米土壤深度的总氮,预测的平均值和标准差。像素值必须使用 exp(x/100)-1 进行反向转换。在茂密丛林地区(通常位于非洲中部),模型准确度较低,因此可能会出现条带状伪影(条纹),… 非洲 isda 土壤 -
iSDAsoil USDA 质地类别
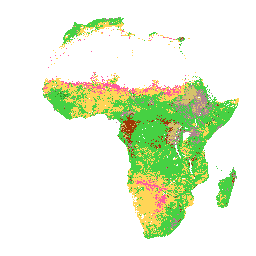
0-20 厘米和 20-50 厘米土壤深度的美国农业部质地类别。在茂密丛林地区(通常位于非洲中部),模型准确度较低,因此可能会看到条带状伪影。土壤属性预测由 Innovative Solutions for Decision … 非洲 铝 isda 土壤 -
iSDAsoil 可提取铝

土壤深度为 0-20 厘米和 20-50 厘米时的可提取铝,预测的平均值和标准差。像素值必须使用 exp(x/10)-1 进行反向转换。土壤属性预测由 Innovative Solutions for Decision Agriculture Ltd. (iSDA) 使用机器学习技术以 30 米的像素大小进行,并结合了… 非洲 铝 isda 土壤 -
iSDAsoil pH

土壤深度为 0-20 厘米和 20-50 厘米时的 pH 值、预测平均值和标准差。像素值必须通过 x/10 进行反向转换。在茂密丛林地区(通常位于非洲中部),模型准确度较低,因此可能会看到条带状伪影。… africa isda ph soil
Earth Engine Data Catalog
[null,null,[],[],["The datasets described include Earth observation data from various sources like NASA, NOAA, and USGS. They encompass diverse areas such as: land cover, elevation models, vegetation indices (NDVI, EVI), soil properties, water resources (evapotranspiration, floods), climate data (temperature, precipitation), atmospheric properties, fire detection, population density, administrative boundaries, and agricultural information. Data is derived from satellites like Landsat, MODIS, Sentinel, and GPM, among others, and includes various temporal and spatial resolutions.\n"]]