- 数据集可用性
- 2006-01-24T00:00:00Z–2011-05-13T00:00:00Z
- 数据集提供商
- Conservation Science Partners
- 标签
说明
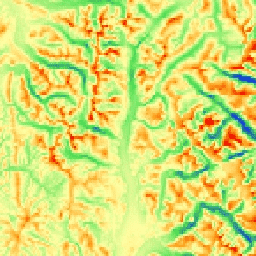
mTPI 可区分山脊地形和山谷地形。它是通过从每个位置的海拔数据中减去社区内的平均海拔高度来计算的。mTPI 使用半径(以公里为单位)为 115.8、89.9、35.5、13.1、5.6、2.8 和 1.2 的移动窗口。它基于 USGS 的 10 米 NED DEM(在 EE 中以 USGS/NED 的形式提供)。
Conservation Science Partners (CSP) Ecologically Relevant Geomorphology (ERGo) Datasets, Landforms and Physiography 包含有关地貌和地貌(也称为地形)模式的详细多尺度数据。虽然这些数据有许多潜在用途,但这些数据的最初目的是开发一种在生态学上相关且适合气候适应规划的地貌和地貌类别分类和地图。由于未来气候条件存在很大的不确定性,而生态响应的不确定性更大,因此提供有关不太可能发生变化的信息可为管理者制定稳健的气候适应计划奠定坚实的基础。景观的这些特征的量化对分辨率很敏感,因此我们会根据给定指数的范围和特征提供尽可能高的分辨率。
频段
像素大小
270 米
频段
| 名称 | 单位 | 最小值 | 最大值 | 像素尺寸 | 说明 |
|---|---|---|---|---|---|
elevation |
米 | -378 | 493 | 米 | NED 派生的 mTPI,范围从负值(山谷)到正值(山脊) |
使用条款
使用条款
引用
引用:
Theobald, D. M. Harrison-Atlas, D.,Monahan, W. B., & Albano, C. M. (2015).用于气候适应规划的具有生态学意义的地貌和地形多样性地图。PloS one, 10(12), e0143619
使用 Earth Engine 探索
代码编辑器 (JavaScript)
var dataset = ee.Image('CSP/ERGo/1_0/US/mTPI');
var usMtpi = dataset.select('elevation');
var usMtpiVis = {
  min: -200.0,
  max: 200.0,
  palette: ['0b1eff', '4be450', 'fffca4', 'ffa011', 'ff0000'],
};
Map.setCenter(-105.8636, 40.3439, 11);
Map.addLayer(usMtpi, usMtpiVis, 'US mTPI');