- 数据集可用时间
- 2024-11-12T18:00:00Z–2026-07-07T06:00:00Z
- 数据集生产者
- ECMWF
- 时间分辨率
- 12 小时
- 标签
说明
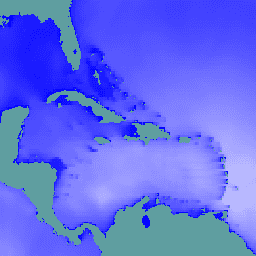
此数据集包含 ECMWF 综合预报系统 (IFS) 生成的 6 天海浪模型场预报数据,分辨率为 0.25 度。 我们将这些产品称为“近实时”(NRT) 产品,因为在 ECMWF 实时预报数据发布后,作为其子集,每天会发布两次新产品。这是一个“短截断”数据流,这意味着预报的范围比标准 IFS WAVE 预报的范围短。在注明相应出处的前提下,数据可用于商业分发和使用。
自 2024 年 11 月 12 日实施 Cycle 49r1 起,Earth Engine 中开始提供这些产品;之前的产品不包括在内。如需了解有关如何使用 ECMWF NRT 数据集的一般信息,请参阅其用户文档。源文件可在 Google Cloud Marketplace 中找到。
频段
频段
像素大小:28000 米(所有频段)
| 名称 | 单位 | 最小值 | 最大值 | 像素大小 | 说明 |
|---|---|---|---|---|---|
mean_zero_crossing_wave_period_sfc |
秒 | 0.889602* | 17.573* | 28000 米 | 海洋表面穿越平均海平面的平均时间间隔。 |
significant_height_of_combined_wind_waves_and_swell_sfc |
米 | 0.0172079* | 15.5856* | 28000 米 | 由风与涌浪产生的海洋表面最高三分之一海浪的平均高度。它表示波峰和波谷之间的垂直距离。 |
mean_wave_direction_sfc |
度 | 0 | 360 | 28000 米 | 海洋表面海浪相对于北极地理位置的平均方向(例如,0 表示“来自北方”,90 表示“来自东方”)。 |
peak_wave_period_sfc |
秒 | 1.03074* | 23.7889* | 28000 米 | 由当地风产生的能量最强的波浪周期,与涌浪相关。波浪周期是指海洋/海面上的两个连续波峰通过固定点所需的平均时间。 |
mean_wave_period_sfc |
秒 | 1.04148* | 18.3643* | 28000 米 | 海洋表面两个连续波峰经过某一固定点的平均时间。 |
图像属性
图像属性
| 名称 | 类型 | 说明 |
|---|---|---|
| creation_day | INT | 预报生成的当月日期。 |
| creation_doy | INT | 预报生成的年积日。 |
| creation_hour | INT | 预报生成的当日小时。 |
| creation_month | INT | 预报生成的当年月份。 |
| creation_time | INT | 预报生成的时间(以 Unix 纪元毫秒为单位)。 |
| creation_year | INT | 预报生成的年份。 |
| forecast_hours | INT | 预报相对于 |
| forecast_time | INT | 预报的时间(以 Unix 纪元毫秒为单位)。 |
| model | STRING | ECMWF 预报模型:
|
| stream | STRING | 从中提取变量的数据流。点击此处查看完整列表。 |
使用条款
使用条款
DOI
通过 Earth Engine 探索
代码编辑器 (JavaScript)
// Observe the ocean in the vicinity of the Caribbean islands and
// Gulf coast.
var aoi = ee.Geometry.Polygon(
    [[
      [-100.6052734375, 31.751243295508836],
      [-100.6052734375, 6.080143483787566],
      [-57.18730468750001, 6.080143483787566],
      [-57.18730468750001, 31.751243295508836]
    ]],
    null, false);

// Extract significant wave height forecasts made at noon on 2025/6/11.
var wave =
    ee.ImageCollection('ECMWF/NRT_FORECAST/IFS/WAVE')
        .filter(ee.Filter.eq('creation_doy', 162))
        .filter(ee.Filter.eq('creation_hour', 12))
        .sort('forecast_hours')
        .select('significant_height_of_combined_wind_waves_and_swell_sfc');

// Display the observations at forecast hour 0 on the map.
var hour0 = wave.first().clip(aoi);
Map.centerObject(hour0);
Map.addLayer(hour0, {min: 0, max: 5}, 'sig height fc=0');

// Animate the wave height forecasts over time.
var videoArgs = {
  dimensions: 540,
  region: aoi,
  framesPerSecond: 7,
  crs: 'EPSG:3857',
  min: 0,
  max: 5,
};
print(ui.Thumbnail(wave, videoArgs));