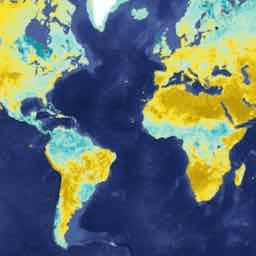
- 数据集可用时间
- 2015-03-31T12:00:00Z–2025-06-27T22:30:00Z
- 数据集生产者
- Google 和 NSIDC Google Earth Engine
- 频率
- 3 小时
- 标签
说明
SMAP 4 级 (L4) 土壤湿度产品包括地表土壤湿度(0-5 厘米垂直平均值)、根区土壤湿度(0-100 厘米垂直平均值)和其他研究产品(未经过验证),包括地表气象强迫变量、土壤温度、蒸散量和净辐射。
SMAP L4 提供不间断的土壤湿度数据。在 SMAP 仪器出现故障期间,SMAP L4 土壤湿度仅基于陆地模型模拟,而没有同时同化 SMAP 亮度温度观测数据。2019 年 6 月 19 日至 7 月 23 日期间以及 2022 年 8 月 6 日至 9 月 20 日期间,SMAP 仪器曾出现严重故障。
来自降轨和升轨半轨道卫星过境(分别约为当地太阳时上午 6:00 和下午 6:00)的 SMAP L 波段亮度温度数据被同化到陆地表面模型中,该模型使用地球固定、全球圆柱形 9 公里等面积可缩放地球网格版本 2.0 (EASE-Grid 2.0) 投影进行网格化。
SPL4SMGP 产品包含同化系统中的一系列 3 小时时间平均地球物理数据字段。在将 SPL4SMGP 数据注入 Google Earth Engine 之前,会先使用 GDAL 库将其转换为地理坐标。
如需了解更多文档和算法详情,请参阅 SMAP L4 土壤湿度用户指南及其中引用的内容。
频段
像素大小
11,000 米
波段
| 名称 | 单位 | 最小值 | 最大值 | 像元大小 | 说明 |
|---|---|---|---|---|---|
sm_surface |
体积分数 | 0 | 0.9 | 米 | 表层土壤湿度(0-5 厘米) |
sm_rootzone |
体积分数 | 0 | 0.9 | 米 | 根区土壤湿度(0-100 厘米) |
sm_profile |
体积分数 | 0 | 0.9 | 米 | 整个土壤剖面的土壤湿度(从 0 厘米到模型基岩深度)。 |
sm_surface_wetness |
0 | 1 | 米 | 表层土壤湿度(0-5 厘米;湿度单位)。土壤湿度单位(无量纲)介于 0 和 1 之间,分别表示完全干燥条件和完全饱和条件之间的相对饱和度。 |
|
sm_rootzone_wetness |
0 | 1 | 米 | 根区土壤湿度(0-100 厘米;湿度单位)。土壤湿度单位(无量纲)介于 0 和 1 之间,分别表示完全干燥条件和完全饱和条件之间的相对饱和度。 |
|
sm_profile_wetness |
0 | 1 | 米 | 整个剖面的土壤湿度(从 0 厘米到模型基岩深度;湿度单位)。 土壤湿度单位(无量纲)介于 0 和 1 之间,分别表示完全干燥条件和完全饱和条件之间的相对饱和度。 |
|
surface_temp |
K | 180 | 350 | 米 | 平均地表温度(包括积雪覆盖的陆地面积)。 不包括开阔水域和永久性冰面 |
soil_temp_layer1 |
K | 210 | 350 | 米 | 土壤热扩散模型第 1 层中的土壤温度 |
soil_temp_layer2 |
K | 210 | 330 | 米 | 土壤热扩散模型中第 2 层的土壤温度 |
soil_temp_layer3 |
K | 215 | 325 | 米 | 土壤热扩散模型第 3 层中的土壤温度 |
soil_temp_layer4 |
K | 220 | 325 | 米 | 土壤热扩散模型第 4 层中的土壤温度 |
soil_temp_layer5 |
K | 225 | 325 | 米 | 土壤热扩散模型第 5 层中的土壤温度 |
soil_temp_layer6 |
K | 230 | 320 | 米 | 土壤热扩散模型第 6 层中的土壤温度 |
snow_mass |
kg/m^2 | 0 | 10000 | 米 | 陆地上网格单元的平均积雪量(或积雪水当量) |
snow_depth |
米 | 0 | 50 | 米 | 网格单元格中积雪覆盖陆地部分的积雪深度 |
land_evapotranspiration_flux |
kg/m^2/s | -0.001 | 0.001 | 米 | 陆地蒸散 |
overland_runoff_flux |
kg/m^2/s | 0 | 0.05 | 米 | 地表径流(包括壤中流) |
baseflow_flux |
kg/m^2/s | 0 | 0.01 | 米 | Baseflow |
snow_melt_flux |
kg/m^2/s | 0 | 0.05 | 米 | 融雪 |
soil_water_infiltration_flux |
kg/m^2/s | 0 | 0.05 | 米 | 土壤水分渗透率 |
land_fraction_saturated |
0 | 1 | 米 | 饱和且无雪的土地面积百分比 |
|
land_fraction_unsaturated |
0 | 1 | 米 | 未饱和(但未枯萎)且无雪的土地面积分数 |
|
land_fraction_wilting |
0 | 1 | 米 | 枯萎且无雪的土地面积占比 |
|
land_fraction_snow_covered |
0 | 1 | 米 | 被积雪覆盖的陆地面积占比 |
|
heat_flux_sensible |
W/m^2 | -2500 | 3000 | 米 | 来自陆地的感热通量 |
heat_flux_latent |
W/m^2 | -2500 | 3000 | 米 | 来自陆地的潜热通量 |
heat_flux_ground |
W/m^2 | -1000 | 1000 | 米 | 向下地面热通量,进入土壤热扩散模型的第一层 |
net_downward_shortwave_flux |
W/m^2 | 0 | 1365 | 米 | 陆地上净向下短波通量 |
net_downward_longwave_flux |
W/m^2 | -1000 | 200 | 米 | 陆地上的净向下长波通量 |
radiation_shortwave_downward_flux |
W/m^2 | 0 | 1500 | 米 | 入射到地表的向下短波通量 |
radiation_longwave_absorbed_flux |
W/m^2 | 35 | 800 | 米 | 地表吸收的(向下)长波辐射 |
precipitation_total_surface_flux |
kg m^-2 s^-2 | 0 | 0.05 | 米 | 地表总降水(包括降雪) |
snowfall_surface_flux |
kg m^-2 s^-2 | 0 | 0.05 | 米 | 地表降雪 |
surface_pressure |
K | 40000 | 110000 | 米 | 平均地表温度(包括积雪覆盖的陆地面积) |
height_lowatmmodlay |
米 | 40 | 80 | 米 | 最低大气模型层的中心高度 |
temp_lowatmmodlay |
K | 180 | 350 | 米 | 最低大气模型层中心高度处的气温 |
specific_humidity_lowatmmodlay |
质量分数 | 0 | 0.4 | 米 | 最低大气模型层中心高度处的空气比湿 |
windspeed_lowatmmodlay |
米/秒 | -60 | 60 | 米 | 最低大气模型层中心高度处的地面风速 |
vegetation_greenness_fraction |
0 | 1 | 米 | 网格单元陆地面积* 上的平均植被“绿度”或蒸腾叶片比例。 |
|
leaf_area_index |
面积比例 | 0 | 10 | 米 | 植被叶面积指数 |
sm_rootzone_pctl |
% | 0 | 100 | 米 | 根区土壤湿度(0-100 厘米;百分位数单位) |
sm_profile_pctl |
% | 0 | 100 | 米 | 总剖面土壤水分(0 厘米至模型基岩深度;百分位单位) |
depth_to_water_table_from_surface_in_peat |
米 | -5 | 0.15 | 米 | 泥炭地中地下水位相对于平均地表海拔的高度(正值表示高于地面) |
free_surface_water_on_peat_flux |
kg/m^2/s | -0.001 | 0.001 | 米 | 泥炭地表层自由水存储量的变化 |
mwrtm_vegopacity |
0 | 2.5 | 米 | 微波辐射传输模型:植被不透明度。 |
|
sm_surface_anomaly |
米 | 实验性。以资产日期为中心,将“sm_surface”的 30 天平均值与 2015 年至今(不包括资产年份)的相同 30 天平均值进行比较所得的差值。 如需了解异常值计算,请参阅此脚本。 |
使用条款
使用条款
本数据集属于公共领域,使用和分发不受限制。如需更多信息,请参见 NASA 地球科学数据和信息政策。
引用
Reichle, R.H.、G. De Lannoy, R.D. Koster, W.T. Crow, J.S. Kimball, Q. Liu 和 M. Bechtold。2022 年。 SMAP L4 全球 3 小时 9 公里 EASE-Grid 地表和根区土壤水分分析更新,版本 7。[指明所用子集]。美国科罗拉多州博尔德。NASA 国家冰雪数据中心分布式主动归档中心。 doi:10.5067/LWJ6TF5SZRG3
Reichle, R.H.、G. De Lannoy, R.D. Koster, W.T. Crow, J.S. Kimball, Q. Liu 和 M. Bechtold。2022 年。 SMAP L4 全球 3 小时 9 公里 EASE-Grid 地表和根区土壤水分分析更新,版本 7。[指明所用子集]。美国科罗拉多州博尔德。NASA National Snow and Ice Data Center Distributed Active Archive Center. doi:10.5067/EVKPQZ4AFC4D
Reichle, R.H.、G. De Lannoy, R.D. Koster, W.T. Crow, J.S. Kimball, Q. Liu 和 M. Bechtold。2022 年。 SMAP L4 全球 3 小时 9 公里 EASE-Grid 地表和根区土壤水分分析更新,版本 7。[指明所用子集]。美国科罗拉多州博尔德。NASA National Snow and Ice Data Center Distributed Active Archive Center. doi:10.5067/EVKPQZ4AFC4D
通过 Earth Engine 探索
代码编辑器 (JavaScript)
var dataset = ee.ImageCollection('NASA/SMAP/SPL4SMGP/007')
                  .filter(ee.Filter.date('2017-04-01', '2017-04-30'));

var smSurface = dataset.select('sm_surface');
var smSurfaceVis = {
  min: 0.0,
  max: 0.9,
  palette: ['0300ff', '418504', 'efff07', 'efff07', 'ff0303'],
};
Map.setCenter(-6.746, 46.529, 2);
Map.addLayer(smSurface, smSurfaceVis, 'SM Surface');