- 数据集可用时间
- 1986-01-01T00:00:00Z–2025-01-01T00:00:00Z
- 数据集生产者
- University of Montana / Montana Climate Office
- 标签
说明
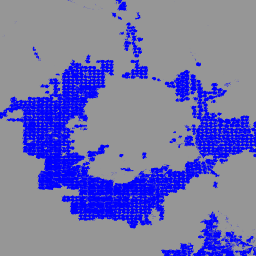
IrrMapper 是一项年度分类,用于确定美国西部 11 个州的灌溉状况,以 Landsat 比例(即 30 米)进行。30 米)使用随机森林算法,涵盖 1986 年至今。
虽然 IrrMapper 论文描述了四类分类(即灌溉地、旱地、未耕地、湿地),但数据集被转换为灌溉地和非灌溉地的二元分类。
“灌溉”是指在一年内检测到任何灌溉活动。 IrrMapper 随机森林模型使用了一个广泛的土地覆盖地理空间数据库进行训练,该数据库包含四个灌溉和非灌溉类别的土地覆盖数据,其中包括超过 5 万个经过人工验证的灌溉田、3.8 万个旱地田和超过 50 万平方公里的未耕种土地。
对于版本 1.2,原始训练数据得到了大幅扩展,为每个州构建了 RF 模型,并进行了更全面的验证和不确定性分析。请参阅我们关于灌溉对河流流量的影响的论文的补充材料。
频段
像元大小
30 米
波段
| 名称 | 像元大小 | 说明 |
|---|---|---|
classification |
米 | 灌溉像素的值为 1,其他像素被遮盖。 |
使用条款
使用条款
引用
引用:
Ketchum, D.; Jencso, K.; Maneta, M.P.; Melton, F.;Jones, M.O.; Huntington, J. IrrMapper:一种利用机器学习方法对美国西部灌溉农业进行高分辨率测绘的工具,Remote Sens. 2020, 12, 2328. doi:10.3390/rs12142328
Ketchum, D.、Hoylman, Z.H.、Huntington, J. 等人。灌溉强化对美国西部河流流量可持续性的影响。Commun Earth Environ 4, 479 (2023). doi:10.1038/s43247-023-01152-2
通过 Earth Engine 探索
代码编辑器 (JavaScript)
var dataset = ee.ImageCollection('UMT/Climate/IrrMapper_RF/v1_2');
var irr = dataset.filterDate('2023-01-01', '2023-12-31').mosaic();

var visualization = {
  min: 0.0,
  max: 1.0,
  palette: ['blue']
};
Map.addLayer(irr, visualization, 'IrrMapper 2023');
Map.setCenter(-112.516, 45.262, 10);