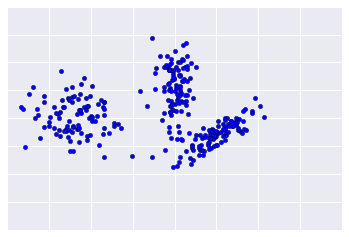
由于聚类是无监督的,因此没有标准答案来验证结果。缺少真相会使质量评估变得复杂。此外,与图 1 中所示示例一样,现实世界的数据集通常不会提供明显的示例集群。
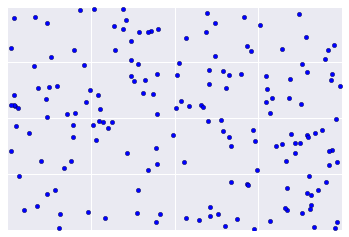
相反,现实世界的数据通常更像图 2,因此很难直观地评估聚类质量。
不过,您可以迭代应用一些启发法和最佳实践,以提高聚类质量。下图简要介绍了如何评估聚类结果。我们将详细介绍每一步。

第 1 步:评估聚类质量
首先,检查这些集群是否符合您的预期,以及您认为相似的示例是否出现在同一集群中。
然后,查看以下常用指标(此列表并非详尽无遗):
- 集群基数
- 集群的大小
- 下游性能
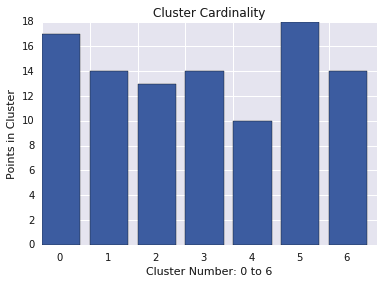
集群基数
集群基数是指每个集群中的示例数量。绘制所有集群的集群基数图,并调查主要离群值集群。在图 2 中,这将是集群 5。
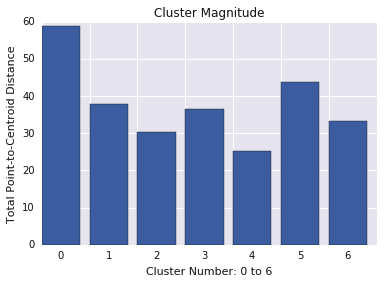
集群的大小
集群的大小是指集群中所有示例到集群中心点的距离的总和。绘制所有集群的集群大小,并调查离群值。在图 3 中,集群 0 是一个离群值。
此外,您还可以考虑按集群查看样本与中心点之间的最大距离或平均距离,以查找离群值。
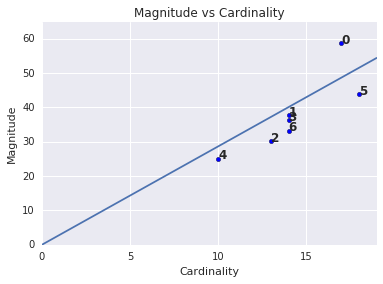
大小与基数
您可能已经注意到,聚类基数越高,聚类的大小就越大。这很容易理解,因为聚类中的点越多(基数),这些点到质心的距离的总和就越大(大小)。您还可以通过查找基数与大小之间的这种关系与其他集群大不相同的集群来识别异常集群。在图 4 中,对基数和幅度的图表进行线性拟合后,我们发现集群 0 存在异常。(簇 5 也离线条很远,但如果省略簇 0,则新的拟合线条会更接近簇 5。)
下游性能
由于聚类输出通常在下游机器学习系统中使用,因此请查看在更改聚类过程后下游模型性能是否有所提升。这可以对聚类结果的质量进行实际评估,但进行此类测试可能很复杂且成本高昂。
第 2 步:重新评估您的相似度度量
聚类算法的效果取决于相似度衡量方法。确保您的相似度衡量方法会返回合理的结果。快速检查的方法是找出已知大致相似的示例对。计算每对示例的相似度衡量值,并将结果与您的知识进行比较:相似示例对的相似度衡量值应高于不相似示例对的相似度衡量值。
您用于抽查相似度衡量标准的示例应能代表数据集,以便您能够确信相似度衡量标准适用于所有示例。无论是手动还是监督方法,相似度衡量指标的性能在整个数据集中都必须保持一致。如果某些示例的类似度衡量标准不一致,则这些示例不会与类似示例进行重合。
如果您发现示例的相似度得分不准确,则表明您的相似度衡量标准可能未充分捕获区分这些示例的特征数据。对相似度衡量指标进行实验,直到它返回更准确、更一致的结果。
第 3 步:确定最佳簇数
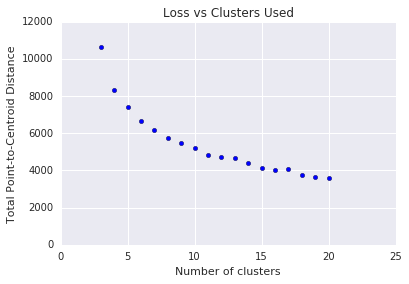
使用 K-means 时,您需要 \(k\) 事先确定聚类数量。如何确定最佳 \(k\)?尝试使用不断增大的 \(k\) 值运行算法,并记下所有簇大小的总和。随着\(k\) 的增加,簇会变小,并且点到质心的总距离会减小。我们可以将此总距离视为损失。将此距离与集群数量绘制在图表中。
如图 5 所示,在某个 \(k\)以上,随着 \(k\)的增加,损失的减少变得微不足道。考虑使用 \(k\),即斜率首次发生剧烈变化的位置,这称为肘部法。对于所示的图表,最佳 \(k\) 约为 11。如果您希望获得更精细的集群,可以参阅此图表,选择较高的 \(k\)。
问题排查问题
如果您在评估过程中发现问题,请重新评估您的数据准备步骤和所选的相似度衡量标准。问题:
- 您的数据是否进行了适当的缩放?
- 您的相似度度量是否正确?
- 您的算法是否对数据执行了具有语义意义的操作?
- 算法的假设是否与数据相符?