의료 시스템의 환자 정보가 포함된 데이터 세트를 사용하고 있다고 가정해 보겠습니다. 데이터 세트는 복잡하며 범주형 특성과 숫자형 특성이 모두 포함되어 있습니다. 데이터 세트에서 패턴과 유사성을 찾으려고 합니다.
이 작업을 어떻게 처리하시겠어요?
클러스터링은 서로의 유사성을 기반으로 라벨이 지정되지 않은 예를 그룹화하도록 설계된 비지도 머신러닝 기법입니다. 예시가 라벨이 지정된 경우 이러한 종류의 그룹을 분류라고 합니다.
새로운 치료 프로토콜을 평가하기 위해 설계된 가상의 환자 연구를 생각해 보겠습니다. 연구 기간 동안 환자는 주당 증상이 발생하는 빈도와 증상의 심각도를 보고합니다. 연구원은 클러스터 분석을 사용하여 유사한 치료 반응을 보이는 환자를 클러스터로 그룹화할 수 있습니다. 그림 1은 시뮬레이션된 데이터를 세 개의 클러스터로 그룹화하는 한 가지 방법을 보여줍니다.
그림 1: 라벨이 지정되지 않은 예시가 세 개의 클러스터로 그룹화됨(시뮬레이션된 데이터).
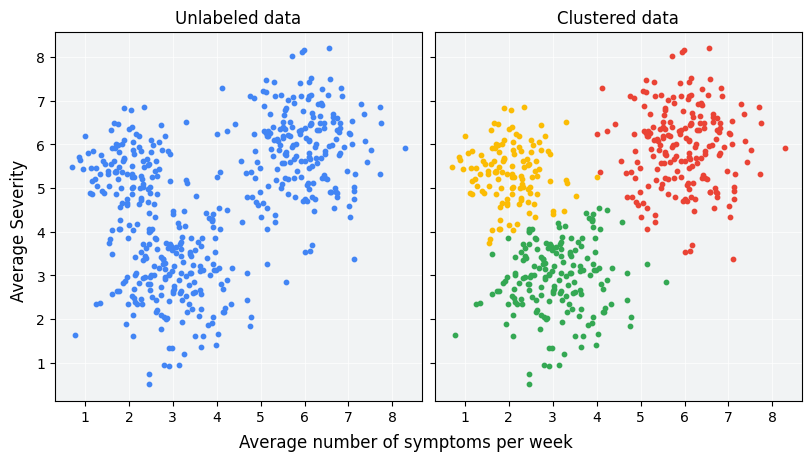
그림 1의 왼쪽에 있는 라벨이 지정되지 않은 데이터를 보면 데이터 포인트 간의 유사성에 대한 공식적인 정의가 없어도 데이터가 세 개의 클러스터를 형성한다고 추측할 수 있습니다. 그러나 실제 애플리케이션에서는 데이터 세트의 기능을 기준으로 유사성 측정값 또는 샘플을 비교하는 데 사용되는 측정항목을 명시적으로 정의해야 합니다. 예시가 몇 가지 특징만 가지고 있는 경우 유사성을 시각화하고 측정하는 것은 간단합니다. 하지만 기능 수가 늘어나면 기능을 결합하고 비교하는 것이 직관적이지 않고 더 복잡해집니다. 클러스터링 시나리오에 따라 적절한 유사성 측정값이 다를 수 있으며, 이 과정에서는 뒷부분의 수동 유사성 측정값 및 임베딩의 유사성 측정값 섹션에서 적절한 유사성 측정값을 선택하는 방법을 설명합니다.
클러스터링 후 각 그룹에는 클러스터 ID라는 고유한 라벨이 할당됩니다.
클러스터링은 많은 특성이 있는 크고 복잡한 데이터 세트를 단일 클러스터 ID로 간소화할 수 있으므로 강력합니다.
클러스터링 사용 사례
클러스터링은 다양한 업계에서 유용합니다. 클러스터링의 몇 가지 일반적인 애플리케이션은 다음과 같습니다.
이전에는 알려지지 않았던 종 간의 유전적 유사성과 차이를 보여주는 유전자 시퀀싱으로 인해 이전에 외관을 기반으로 했던 분류가 수정되었습니다.
성격의 5대 요인 모델은 성격을 설명하는 단어를 5개 그룹으로 클러스터링하여 개발되었습니다. HEXACO 모델은 5개가 아닌 6개의 클러스터를 사용합니다.
대치
클러스터의 일부 예시에서 지형지물 데이터가 누락된 경우 클러스터의 다른 예시에서 누락된 데이터를 추론할 수 있습니다. 이를 추정이라고 합니다.
예를 들어 인기가 낮은 동영상을 인기가 높은 동영상과 함께 클러스터링하여 동영상 맞춤 콘텐츠를 개선할 수 있습니다.
데이터 압축
앞서 설명한 대로 관련 클러스터 ID는 해당 클러스터의 모든 예시에서 다른 기능을 대체할 수 있습니다. 이러한 대체는 특성 수를 줄여주므로 해당 데이터에 관한 모델을 저장, 처리, 학습하는 데 필요한 리소스도 줄어듭니다. 대규모 데이터 세트의 경우 이러한 절감 효과가 상당합니다.
예를 들어 단일 YouTube 동영상에는 다음과 같은 지형지물 데이터가 포함될 수 있습니다.
시청자 위치, 시간, 인구통계
댓글 타임스탬프, 텍스트, 사용자 ID
동영상 태그
YouTube 동영상을 클러스터링하면 이 기능 집합이 단일 클러스터 ID로 대체되어 데이터가 압축됩니다.
개인 정보 보호
사용자를 클러스터링하고 사용자 ID 대신 클러스터 ID로 사용자 데이터를 연결하여 어느 정도 개인 정보를 보호할 수 있습니다. 예를 들어 YouTube 사용자의 시청 기록을 기반으로 모델을 학습시키고자 한다고 가정해 보겠습니다. 사용자 ID를 모델에 전달하는 대신 사용자를 클러스터링하고 클러스터 ID만 전달할 수 있습니다. 이렇게 하면 개별 시청 기록이 개별 사용자에게 연결되지 않습니다. 개인 정보를 보호하려면 클러스터에 충분히 많은 수의 사용자가 포함되어야 합니다.
[null,null,["최종 업데이트: 2025-02-25(UTC)"],[[["\u003cp\u003eClustering is an unsupervised machine learning technique used to group similar unlabeled data points into clusters based on defined similarity measures.\u003c/p\u003e\n"],["\u003cp\u003eCluster analysis can be applied to various domains like market segmentation, social network analysis, and medical imaging to identify patterns and simplify complex datasets.\u003c/p\u003e\n"],["\u003cp\u003eClustering enables data compression by replacing numerous features with a single cluster ID, reducing storage and processing needs.\u003c/p\u003e\n"],["\u003cp\u003eIt facilitates data imputation by inferring missing feature data from other examples within the same cluster.\u003c/p\u003e\n"],["\u003cp\u003eClustering offers a degree of privacy preservation by associating user data with cluster IDs instead of individual identifiers.\u003c/p\u003e\n"]]],[],null,["# What is clustering?\n\nSuppose you are working with a dataset that includes patient information from a\nhealthcare system. The dataset is complex and includes both categorical and\nnumeric features. You want to find patterns and similarities in the dataset.\nHow might you approach this task?\n\n[**Clustering**](/machine-learning/glossary#clustering) is an unsupervised\nmachine learning technique designed to group\n[**unlabeled examples**](https://developers.google.com/machine-learning/glossary#unlabeled_example)\nbased on their similarity to each other. (If the examples are labeled, this\nkind of grouping is called\n[**classification**](https://developers.google.com/machine-learning/glossary#classification_model).)\nConsider a hypothetical patient\nstudy designed to evaluate a new treatment protocol. During the study, patients\nreport how many times per week they experience symptoms and the severity of the\nsymptoms. Researchers can use clustering analysis to group patients with similar\ntreatment responses into clusters. Figure 1 demonstrates one possible grouping\nof simulated data into three clusters.\n**Figure 1: Unlabeled examples grouped into three clusters\n(simulated data).**\n\nLooking at the unlabeled data on the left of Figure 1, you could guess that\nthe data forms three clusters, even without a formal definition of similarity\nbetween data points. In real-world applications, however, you need to explicitly\ndefine a **similarity measure** , or the metric used to compare samples, in\nterms of the dataset's features. When examples have only a couple of features,\nvisualizing and measuring similarity is straightforward. But as the number of\nfeatures increases, combining and comparing features becomes less intuitive\nand more complex. Different similarity measures may be more or less appropriate\nfor different clustering scenarios, and this course will address choosing an\nappropriate similarity measure in later sections:\n[Manual similarity measures](/machine-learning/clustering/kmeans/similarity-measure)\nand\n[Similarity measure from embeddings](/machine-learning/clustering/autoencoder/similarity-measure).\n\nAfter clustering, each group is assigned a unique label called a **cluster ID**.\nClustering is powerful because it can simplify large, complex datasets with\nmany features to a single cluster ID.\n\nClustering use cases\n--------------------\n\nClustering is useful in a variety of industries. Some common applications\nfor clustering:\n\n- Market segmentation\n- Social network analysis\n- Search result grouping\n- Medical imaging\n- Image segmentation\n- Anomaly detection\n\nSome specific examples of clustering:\n\n- The [Hertzsprung-Russell diagram](https://wikipedia.org/wiki/Hertzsprung%E2%80%93Russell_diagram) shows clusters of stars when plotted by luminosity and temperature.\n- Gene sequencing that shows previously unknown genetic similarities and dissimilarities between species has led to the revision of taxonomies previously based on appearances.\n- The [Big 5](https://wikipedia.org/wiki/Big_Five_personality_traits) model of personality traits was developed by clustering words that describe personality into 5 groups. The [HEXACO](https://wikipedia.org/wiki/HEXACO_model_of_personality_structure) model uses 6 clusters instead of 5.\n\n### Imputation\n\nWhen some examples in a cluster have missing feature data, you can infer the\nmissing data from other examples in the cluster. This is called\n[imputation](https://developers.google.com/machine-learning/glossary/#value-imputation).\nFor example, less popular videos can be clustered with more popular videos\nto improve video recommendations.\n\n### Data compression\n\nAs discussed, the relevant cluster ID can replace other features for all\nexamples in that cluster. This substitution reduces the number of features and\ntherefore also reduces the resources needed to store, process, and train models\non that data. For very large datasets, these savings become significant.\n\nTo give an example, a single YouTube video can have feature data including:\n\n- viewer location, time, and demographics\n- comment timestamps, text, and user IDs\n- video tags\n\nClustering YouTube videos replaces this set of features with a\nsingle cluster ID, thus compressing the data.\n\n### Privacy preservation\n\nYou can preserve privacy somewhat by clustering users and associating user data\nwith cluster IDs instead of user IDs. To give one possible example, say you want\nto train a model on YouTube users' watch history. Instead of passing user IDs\nto the model, you could cluster users and pass only the cluster ID. This\nkeeps individual watch histories from being attached to individual users. Note\nthat the cluster must contain a sufficiently large number of users in order to\npreserve privacy.\n| **Key terms:**\n|\n| - [clustering](/machine-learning/glossary#clustering)\n| - [example](/machine-learning/glossary#example)\n| - [unlabeled example](/machine-learning/glossary#unlabeled_example)\n| - [classification](/machine-learning/glossary#classification_model)"]]