Page Summary
-
BigQuery enables analysis of Fleet Engine logs via SQL-like queries after routing logs to a BigQuery dataset.
-
Routing logs to BigQuery involves creating a sink in the Logs Explorer and selecting a BigQuery dataset as the destination.
-
BigQuery automatically populates tables for each Fleet Engine log type under the specified dataset.
-
Example queries demonstrate how to analyze trip creation, vehicle stops, and other data points within BigQuery.
-
BigQuery integrates with Looker Studio for creating dashboards and visualizing data, such as vehicle movement on a map.
BigQuery is a powerful tool for performing analytics. You can use it to store longer-term logs and to perform SQL-like queries against the data. To use BigQuery for analysis, you must explicitly route your logs to BigQuery, as described in the next section.
Route logs to BigQuery
- In the Logs Explorer, create a filter that
isolates the Fleet Engine logs:
Fleetengine.googleapis.com/Fleet. - In the Query Results pane, click the Actions or More Actions menu and choose Create Sink.
- Specify a sink name (for example, FleetEngineLogsSink). Click Next.
- In the Sink Destination, select BigQuery dataset.
- In Select BigQuery dataset, select Create new BigQuery dataset.
- In the Create dataset dialog, enter a Dataset ID.
- Leave everything else as is and click Create dataset.
- Check Use partitioned tables. Click Next.
- Leave Choose logs to include in sink and Choose logs to filter out of sink as they are.
- Click Create Sink.
Your logs should now begin to populate the BigQuery dataset, which can take a short while. See also Route logs to supported destinations.
Once you are routing log data to BigQuery, several tables under the FleetEngineLogs dataset are automatically populated, one for each log type:
- CreateVehicle
- GetVehicle
- ListVehicles
- SearchVehicles
- UpdateVehicle
- CreateTrip
- GetTrip
- UpdateTrip
- ListTrips
The table names use the following pattern:
project_id.data_set.log_name
For example, if the project is called test-project and the dataset name is
FleetEngineLogs, the CreateTrip table has the following name:
test-project.FleetEngineLogs.fleetengine_googleapis_com_create_trip
Example queries for BigQuery
The following example queries show how you can search for different log entries in BigQuery.
Number of CreateTrips logs grouped by hour
    SELECT TIMESTAMP_TRUNC(timestamp, HOUR) as hour,
           count(*) as num_trips_created
    FROM
    `ProjectId.FleetEngineLogs.fleetengine_googleapis_com_create_trip`
    GROUP BY hour
    ORDER by hour
Number of stops per vehicle per hour
    SELECT
      jsonpayload_v1_updatevehiclelog.request.vehicleid AS vehicle,
      TIMESTAMP_TRUNC(timestamp, HOUR) AS hour,
      COUNT(*) AS num_stops
    FROM
      `ProjectId.FleetEngineLogs.fleetengine_googleapis_com_update__vehicle`
    WHERE
    ARRAY_LENGTH(jsonpayload_v1_updatevehiclelog.request.vehicle.remainingvehiclejourneysegments) > 0
    AND jsonpayload_v1_updatevehiclelog.request.vehicle.remainingvehiclejourneysegments[
    OFFSET
    (0)].stop.state = 'VEHICLE_STOP_STATE_LOG_ARRIVED'
    GROUP BY
    1,
    2
    ORDER BY
    2
For example, this query could tell you that in the last hour:
- Vehicle A completed 10 stops in hour 12 and 8 stops in hour 13.
- Vehicle B completed 5 stops in hour 11 and 7 stops in hour 12.
- Vehicle C completed 12 stops in hour 13 and 9 stops in hour 14.
See also View logs routed to BigQuery.
Integrate BigQuery with Looker Studio
BigQuery can be integrated with business intelligence tools to create dashboards for business analytics. See Looker Studio.
The following example shows how to build a Looker Studio dashboard for visualizing trips and vehicle movements on a map.
- Launch a new Looker Studio dashboard and select BigQuery as the data connection.
- Select Custom Query and manually enter or select the Cloud Project to which it should be billed.
- Enter one of the following queries into the query box.
On-demand trips example query
    SELECT
     timestamp,
     labels.vehicle_id,
    jsonpayload_v1_updatevehiclelog.response.lastlocation.location.latitude AS lat,
    jsonpayload_v1_updatevehiclelog.response.lastlocation.location.longitude AS lng
    FROM
    `ProjectId.TableName.fleetengine_googleapis_com_update_vehicle`
Scheduled Tasks example query
    SELECT
    labels.delivery_vehicle_id,
    jsonpayload_v1_updatedeliveryvehiclelog.response.lastlocation.rawlocation.longitude as lat, jsonpayload_v1_updatedeliveryvehiclelog.response.lastlocation.rawlocation.latitude as lng
    FROM `ProjectID.TableName.fleetengine_googleapis_com_update_delivery_vehicle`
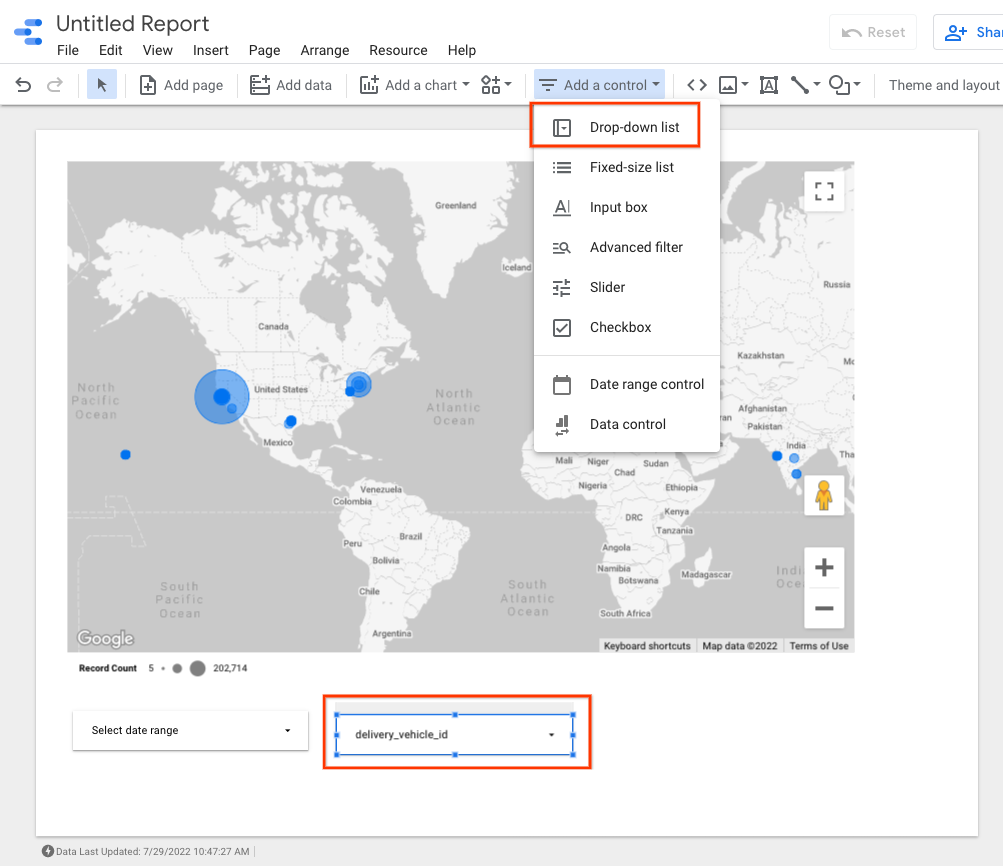
- Select Chart Type as Bubble Map, and then select the location field.
- Select Add a Field.
- Name the field and add the following formula:
CONCAT(lat, ",", lng). - Set the type to Geo->Latitude, Longitude.
- You can add controls to the dashboard to filter data. For example, select the Date-range filter.
- Edit the date range box to select a default date range.
- You can add additional drop-down list controls for
vehicle_id. With these controls, you can visualize the movement of the vehicle or the movement within a trip.
Looker Studio example output:
What's next
To comply with data retention policies, see Restrict log retention.