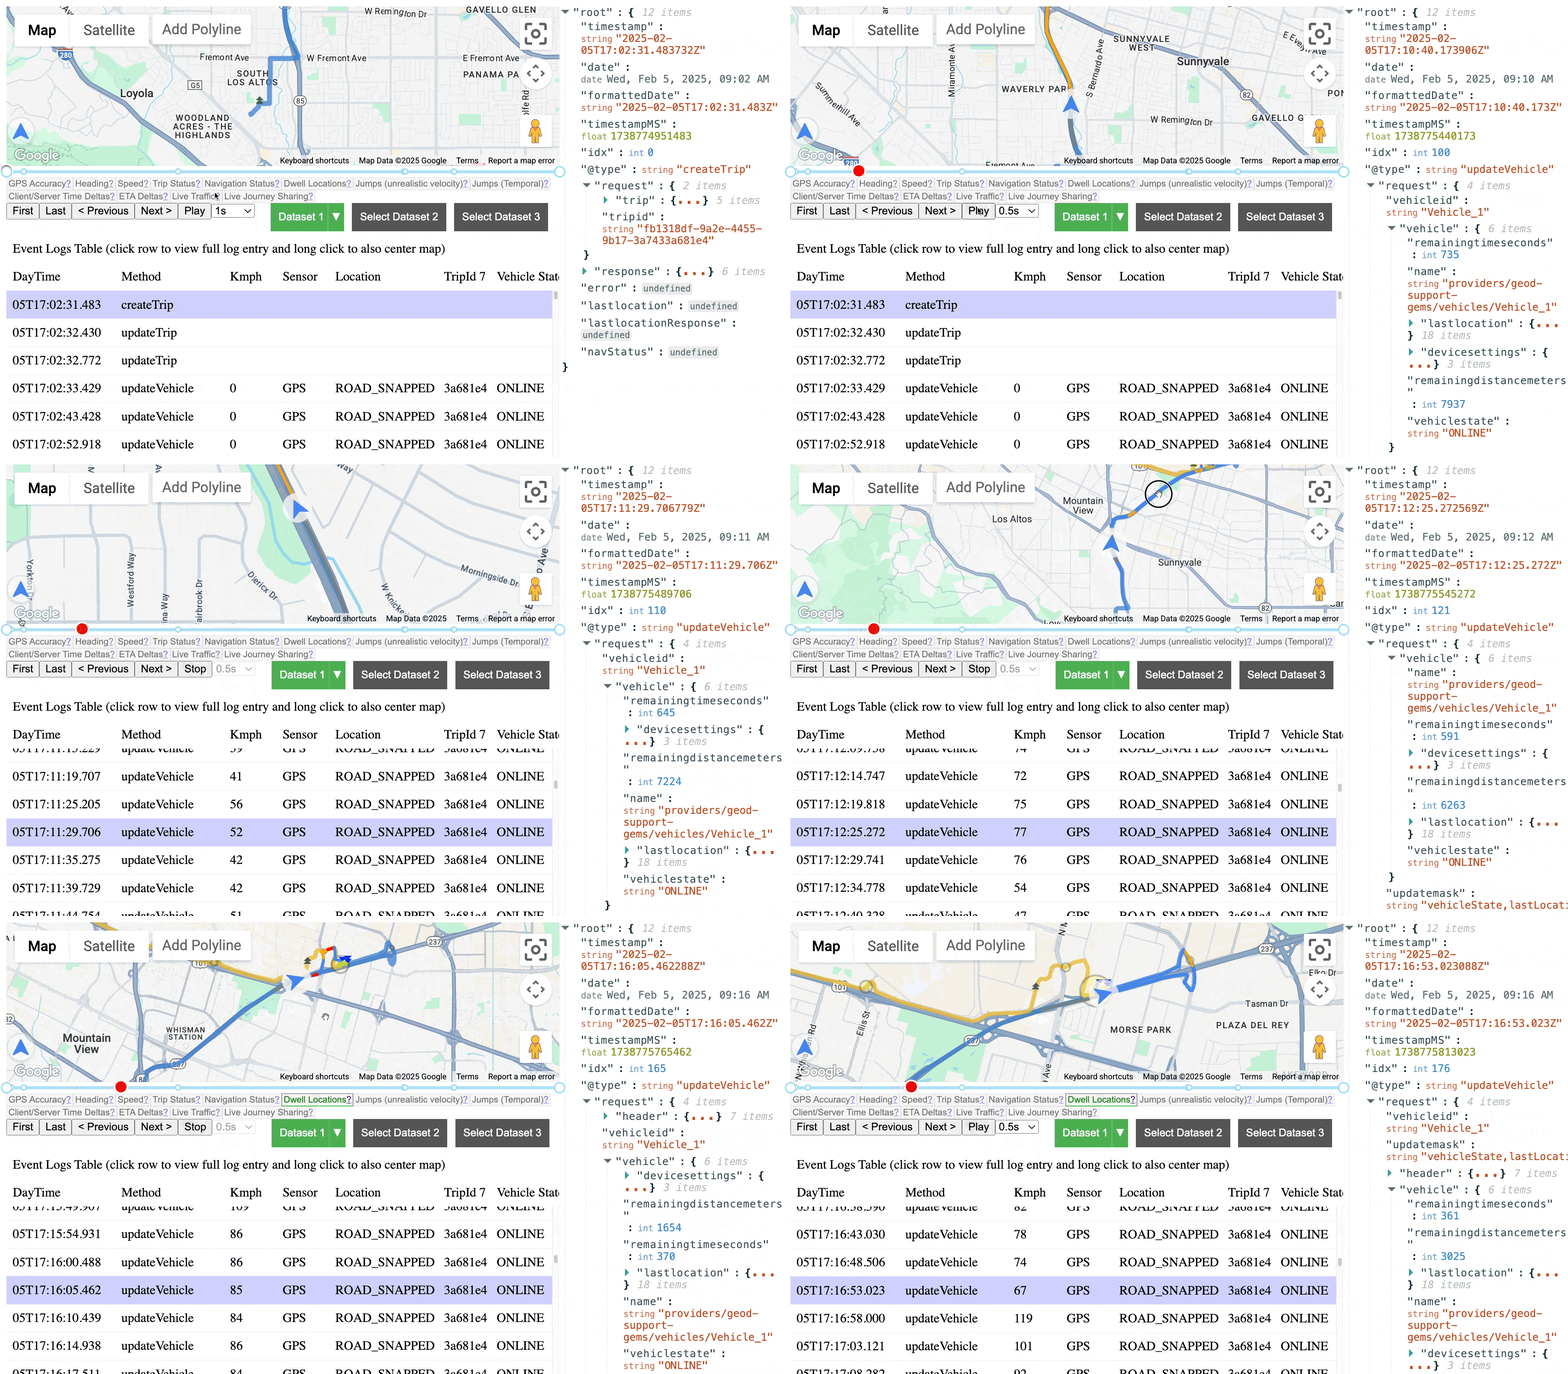
The Fleet Debugger (https://googlemaps.github.io/fleet-debugger/) is an open-source web tool that lets you visualize Fleet Engine logs from Cloud Logging. It provides an interactive map and timeline to analyze vehicle and task or trip data, running entirely in your browser.
Key features
Fleet Debugger helps you understand complex journey and vehicle behaviors by offering:
- Interactive map and timeline replay to see events in sequence.
- Synchronization between the map, a data table, and a timeline.
- Detailed log entry inspection for deep dives into API requests and responses.
- Visualization of planned routes and traffic (requires Restricted Use Logs).
- Comparison of requested versus actual stop locations (requires Restricted Use Logs).

Load data from Cloud Logging
The primary way to use Fleet Debugger is by connecting it directly to your Google Cloud project's Cloud Logging. To do this, follow the next steps:
- Open the Tool: Go to Fleet debugger.
- Select Dataset: Click a "Select Dataset" button.
- Enter Parameters: Input your Project ID, Vehicle ID(s) or Trip or Task ID(s), and the selected time range.
- Fetch Logs: Click "Sign in and Fetch Logs".
- Sign In: Authenticate with your Google Account that has the required
permissions for Cloud Logging access (e.g.,
roles/logging.viewer).
Other data loading methods
While direct connection to Cloud Logging is often easiest, you might use file-based methods for several reasons:
- To analyze logs provided by a team member.
- To load a previously exported dataset for re-analysis.
To work with logs when you don't have direct access to the GCP project.
- File Import: You can also load log data from JSON or ZIP files using the "Load JSON or ZIP file instead" button. These files can be ones you've previously exported from Cloud Logging or from the tool itself.
- Exporting from Tool: To share a dataset, use the dataset drop-down menu and select "Export". This downloads a JSON file that can be compressed. The tool supports loading compressed JSON zip files.
All data remains local to your browser.
Restricted use logs
Enabling Restricted Use Logs is not required for Fleet Debugger to function, but it is recommended for the most complete visualization. These logs provide valuable context, including:
- The driver's planned navigation route from the Navigation SDK.
- Traffic data along the routes.
- The original requested pickup and dropoff locations, in addition to the actual locations.
Without restricted logs, these specific details won't be available in the debugger.
Resources
- Fleet debugger
- GitHub Repository: In this repository you can find source code and report issues.
Support
This Fleet Debugger tool is offered under an open source license. It is not governed by the Google Maps Platform Support Technical Support Services Guidelines, the SLA, or the Deprecation Policy. The underlying Google Maps Platform services used by the tool remain subject to the Google Maps Platform Terms of Service.
- To report bugs or request features, file an issue on GitHub.
- For technical questions and discussions, use the Google Maps Platform developer community channels.
- To contribute to the project, check the contributing guides in the repository.
