science Este produto ou recurso está em fase experimental (pré-GA). Os produtos e recursos em pré-GA têm suporte limitado, e é possível que as mudanças neles não sejam compatíveis com outras versões nessa fase. As Soluções pré-GA são cobertas pelos Termos de Serviço específicos da Plataforma Google Maps. Para mais informações, consulte as descrições da fase de lançamento. Faça sua inscrição para testar o Places Insights.
Mantenha tudo organizado com as coleções
Salve e categorize o conteúdo com base nas suas preferências.
A função PLACES_COUNT_PER_H3 usa uma área geográfica para pesquisar e retorna uma tabela com a contagem de lugares por célula H3 na área de pesquisa.
Como a função PLACES_COUNT_PER_GEO retorna uma tabela, chame-a usando uma cláusula FROM.
Parâmetros de entrada:
Obrigatório: o parâmetro de filtrogeography que especifica a área de pesquisa. O parâmetro geography tem um valor definido pelo tipo de dados GEOGRAPHY do BigQuery, que aceita pontos, linestrings e polígonos.
Para exemplos de uso de diferentes tipos de regiões geográficas de pesquisa, como
janelas de visualização e linhas, consulte a
função PLACES_COUNT.
Obrigatório: o parâmetro de filtroh3_resolution que especifica a resolução H3 usada para agregar a contagem de lugares em cada célula H3. Os valores aceitos são de 0 a 8.
Opcional: outros parâmetros de filtro para refinar sua pesquisa.
Retorna:
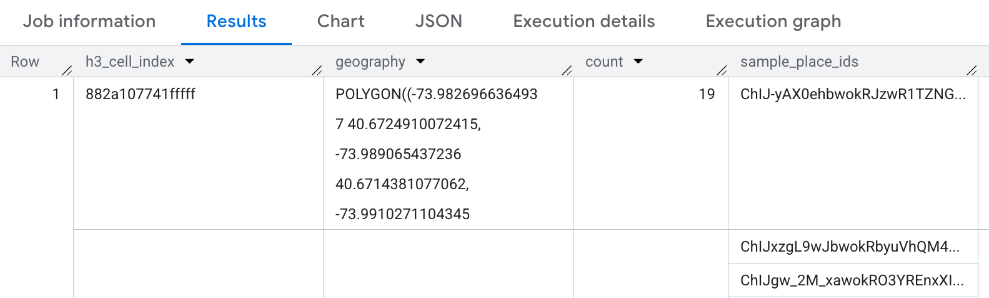
Uma tabela com uma linha por célula H3. A tabela contém as colunas h3_cell_index (STRING), geography (GEOGRAPHY), que definem o polígono que representa a célula H3, count (INT64) e sample_place_ids (ARRAY<STRING>), em que sample_place_ids contém até 250 IDs de lugar para cada célula H3.
Exemplo: contar lojas de conveniência e supermercados acessíveis para cadeirantes por célula H3
O exemplo abaixo calcula o número de lojas de conveniência e supermercados operacionais e acessíveis para cadeirantes por célula H3 na cidade de Nova York. As células H3 usam um nível de resolução de 8.
DECLAREgeoGEOGRAPHY;-- Get the geography for New York City.SETgeo=(SELECTgeometryFROM`bigquery-public-data.overture_maps.division_area`WHEREcountry='US'ANDnames.primary='City of New York'LIMIT1);SELECT*FROM`maps-platform-analytics-hub.sample_places_insights_us.PLACES_COUNT_PER_H3`(JSON_OBJECT('geography',geo,'types',["convenience_store","grocery_store"],'wheelchair_accessible_entrance',true,'business_status',['OPERATIONAL'],'h3_resolution',8));
A resposta da função:
Visualizar resultados
As imagens a seguir mostram esses dados exibidos no Looker Studio como um mapa preenchido.
Quanto mais escura a célula H3, maior a concentração de resultados:
Para importar seus dados para o Looker Studio:
Execute a função acima para gerar os resultados.
Nos resultados do BigQuery, clique em Abrir em -> Looker Studio. Seus resultados são importados automaticamente para o Looker Studio.
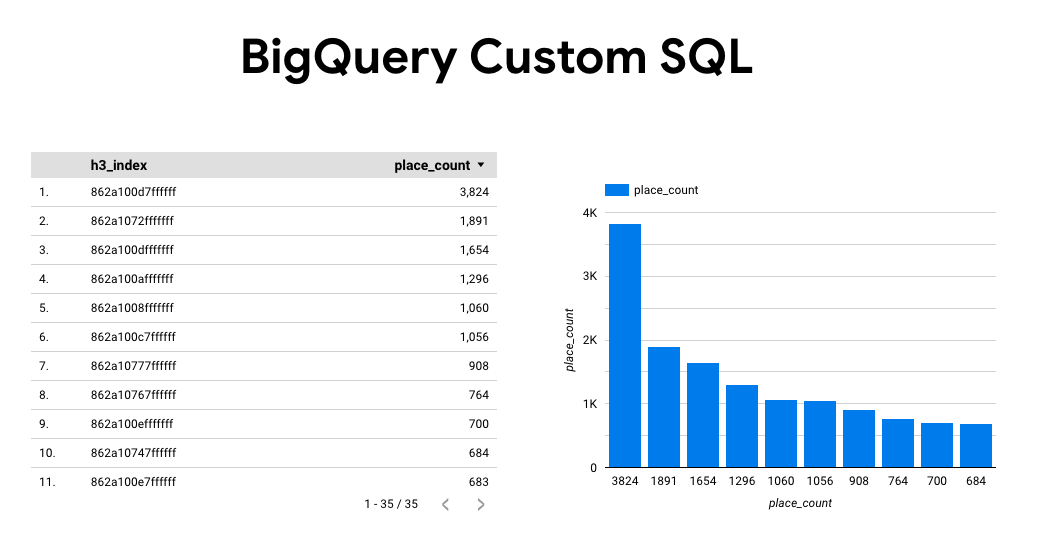
O Looker Studio cria uma página de relatório padrão e a inicializa com um título, uma tabela e um gráfico de barras dos resultados.
Selecione tudo na página e exclua.
Clique em Inserir -> Mapa preenchido para adicionar um mapa preenchido ao relatório.
Em Tipos de gráfico -> Configuração, configure os campos conforme mostrado abaixo:
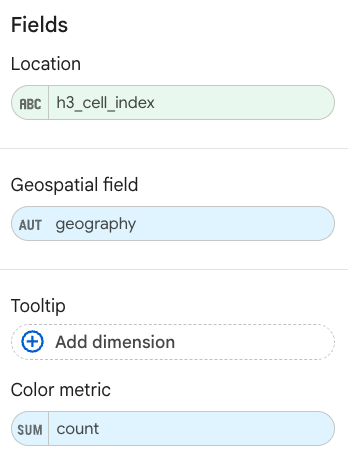
O mapa preenchido aparece como acima. Se quiser, selecione Tipos de gráficos ->
Estilos para configurar ainda mais a aparência do mapa.
[null,null,["Última atualização 2025-07-17 UTC."],[],[],null,["The `PLACES_COUNT_PER_H3` function takes a geographic area to search\nand returns a table of places counts per [H3](https://h3geo.org/docs/) cell in\nthe search area.\n\nBecause the `PLACES_COUNT_PER_GEO` function returns a table, call it using\na `FROM` clause.\n\n- Input parameters:\n\n - **Required** : The `geography` [filter parameter](/maps/documentation/placesinsights/experimental/filter-params) that\n specifies the search area. The `geography` parameter a value defined by\n the BigQuery\n [`GEOGRAPHY`](https://cloud.google.com/bigquery/docs/reference/standard-sql/data-types#geography_type)\n data type, which supports points, linestrings, and polygons.\n\n For examples of using different types of search geographies, such as\n viewports and lines, see\n [`PLACES_COUNT` function](/maps/documentation/placesinsights/experimental/places-count).\n - **Required** : The `h3_resolution` [filter parameter](/maps/documentation/placesinsights/experimental/filter-params) that\n specifies the [H3](https://h3geo.org/docs/) resolution used to aggregate\n the count of places in each H3 cell. Supported value are from 0 to 8.\n\n - **Optional** : Additional [filter](/maps/documentation/placesinsights/experimental/filter-params) parameters to refine\n your search.\n\n- Returns:\n\n - A table with one row per H3 cell. The table contains the columns `h3_cell_index` (`STRING`), `geography` (`GEOGRAPHY`) which defines the polygon representing the H3 cell, and `count` (`INT64`).\n\nExample: Count wheelchair accessible convenience and grocery stores per H3 cell\n\nThe example below computes the number of operational, wheelchair accessible\nconvenience and grocery stores per H3 cell in New York City. The H3 cells use a\n[resolution level](https://h3geo.org/docs/core-library/restable) of 8.\n\nThis example uses the [Overture Maps\nData](https://console.cloud.google.com/marketplace/product/bigquery-public-data/overture-maps)\nBigQuery [public dataset](https://cloud.google.com/bigquery/public-data) to get\nthe geography for New York City.\n| **Note:** Because the response table contains a `geography` field, you can visualize it using tools that support BigQuery `GEOGRAPHY` types. For an example of visualizing the results of a function, see [Visualize\nresults](#visualize_results). For more information and example on visualizing Places Insights results, see [Visualize query results](/maps/documentation/placesinsights/visualize-data). \n\n```googlesql\nDECLARE geo GEOGRAPHY;\n\n-- Get the geography for New York City.\nSET geo = (SELECT geometry FROM `bigquery-public-data.overture_maps.division_area`\n WHERE country = 'US' AND names.primary = 'City of New York' LIMIT 1);\n\nSELECT * FROM `maps-platform-analytics-hub.sample_places_insights_us.PLACES_COUNT_PER_H3`(\n JSON_OBJECT(\n 'geography', geo,\n 'types', [\"convenience_store\",\"grocery_store\"],\n 'wheelchair_accessible_entrance', true,\n 'business_status', ['OPERATIONAL'],\n 'h3_resolution', 8\n )\n);\n```\n\nThe response for the function:\n\nVisualize results\n\nThe following images show this data displayed in Looker Studio as a filled map.\nThe darker the H3 cell the higher the concentration of results:\n\nTo import your data into Looker Studio:\n\n1. Run the function above to generate the results.\n\n2. In the BigQuery results, click **Open in -\\\u003e Looker Studio**. Your results\n are automatically imported into Looker Studio.\n\n3. Looker Studio creates a default report page and initializes it with a title,\n table, and bar graph of the results.\n\n4. Select everything on the page and delete it.\n\n5. Click **Insert -\\\u003e Filled map** to add a filled map to your report.\n\n6. Under **Chart types -\\\u003e Setup** configure the fields as shown below::\n\n7. The filled map appears as above. You can optionally select **Chart types -\\\u003e\n Styles** to further configure the appearance of the map.\n\nFor more information and example on visualizing Places Insights results, see\n[Visualize query results](/maps/documentation/placesinsights/visualize-data)."]]