science Bu ürün veya özellik deneyseldir (GKST öncesi). GKST öncesi ürünler ve özelliklere verilen destek sınırlı olabilir. Ayrıca bu ürünler ve özelliklerde yapılan değişiklikler, GKST öncesi diğer sürümlerle uyumlu olmayabilir. GKST Öncesi Teklifler, Google Haritalar Platformu Hizmete Özgü Şartlar'a tabidir. Daha fazla bilgi için lansman aşamalarının açıklamalarını inceleyin. Places Insights'ı test etmek için kaydolun.
Koleksiyonlar ile düzeninizi koruyun
İçeriği tercihlerinize göre kaydedin ve kategorilere ayırın.
PLACES_COUNT_PER_H3 işlevi, aranacak bir coğrafi alan alır ve arama alanındaki H3 hücresi başına yer sayılarının bulunduğu bir tablo döndürür.
PLACES_COUNT_PER_GEO işlevi tablo döndürdüğünden, FROM yan tümcesiyle çağırın.
Giriş parametreleri:
Zorunlu: Arama alanını belirten geographyfiltre parametresi. geography parametresi, noktaları, LineString'leri ve poligonları destekleyen BigQuery GEOGRAPHY veri türü tarafından tanımlanan bir değerdir.
Farklı arama coğrafyası türlerini (ör. görünüm alanları ve çizgiler) kullanma örnekleri için PLACES_COUNT işlevine bakın.
Zorunlu: Her H3 hücresindeki yer sayısını toplamak için kullanılan h3_resolutionfiltre parametresi olan H3 çözünürlüğünü belirtir. Desteklenen değerler 0 ile 8 arasındadır.
İsteğe bağlı: Aramanızı daraltmak için ek filtre parametreleri.
Şunu döndürür:
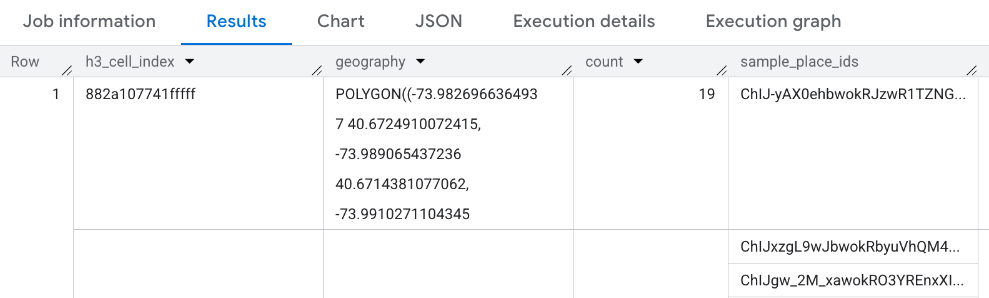
H3 hücresi başına bir satır içeren bir tablo. Tabloda, H3 hücresini temsil eden poligonu tanımlayan h3_cell_index (STRING), geography (GEOGRAPHY), count (INT64) ve sample_place_ids (ARRAY<STRING>) sütunları bulunur. sample_place_ids, her H3 hücresi için en fazla 250 yer kimliği içerir.
Örnek: H3 hücresi başına tekerlekli sandalyeye uygun market ve bakkal sayısını hesaplama
Aşağıdaki örnekte, New York City'deki H3 hücresi başına tekerlekli sandalye erişimine uygun, hizmet veren ve market olan mağazaların sayısı hesaplanmaktadır. H3 hücreleri 8 çözünürlük düzeyini kullanır.
DECLAREgeoGEOGRAPHY;-- Get the geography for New York City.SETgeo=(SELECTgeometryFROM`bigquery-public-data.overture_maps.division_area`WHEREcountry='US'ANDnames.primary='City of New York'LIMIT1);SELECT*FROM`maps-platform-analytics-hub.sample_places_insights_us.PLACES_COUNT_PER_H3`(JSON_OBJECT('geography',geo,'types',["convenience_store","grocery_store"],'wheelchair_accessible_entrance',true,'business_status',['OPERATIONAL'],'h3_resolution',8));
İşlevin yanıtı:
Sonuçları görselleştirme
Aşağıdaki resimlerde bu verilerin Looker Studio'da dolu harita olarak gösterildiği görülmektedir.
H3 hücresi ne kadar koyu olursa sonuçların yoğunluğu o kadar yüksek olur:
Verilerinizi Looker Studio'ya aktarmak için:
Sonuçları oluşturmak için yukarıdaki işlevi çalıştırın.
BigQuery sonuçlarında Open in -> Looker Studio'yu (Şurada aç: Looker Studio) tıklayın. Sonuçlarınız otomatik olarak Looker Studio'ya aktarılır.
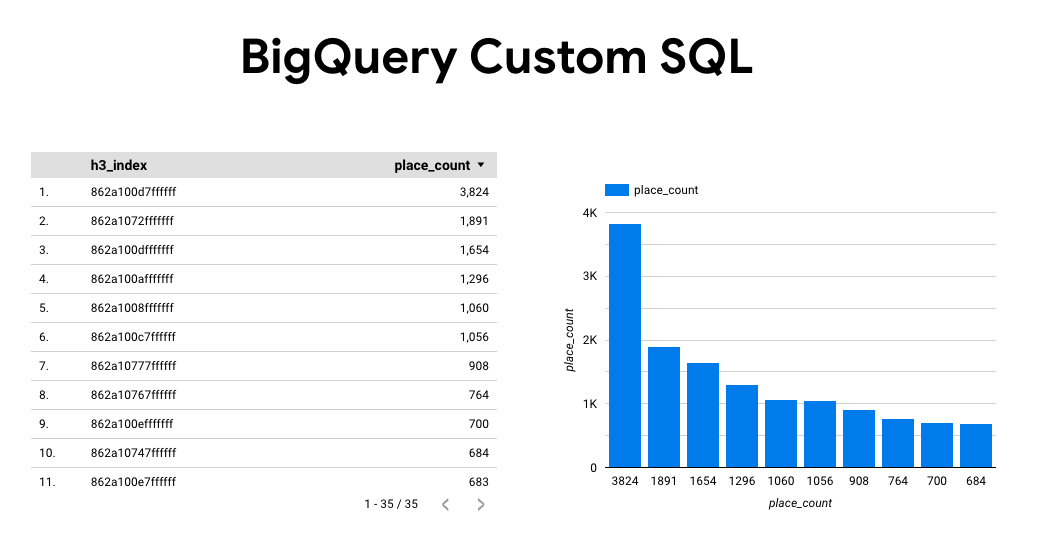
Looker Studio, varsayılan bir rapor sayfası oluşturur ve bu sayfayı sonuçların başlığı, tablosu ve çubuk grafiğiyle başlatır.
Sayfadaki her şeyi seçip silin.
Raporunuza dolu harita eklemek için Ekle -> Dolu harita'yı tıklayın.
Grafik türleri -> Kurulum bölümünde alanları aşağıda gösterildiği gibi yapılandırın:
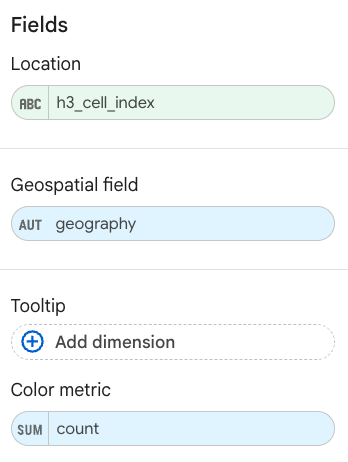
Doldurulmuş harita yukarıdaki gibi görünür. Haritanın görünümünü daha fazla yapılandırmak için isteğe bağlı olarak Grafik türleri ->
Stiller'i seçebilirsiniz.
Yer İşletmeleri Analizleri sonuçlarını görselleştirme hakkında daha fazla bilgi ve örnek için Sorgu sonuçlarını görselleştirme başlıklı makaleyi inceleyin.
[null,null,["Son güncelleme tarihi: 2025-07-17 UTC."],[],[],null,["The `PLACES_COUNT_PER_H3` function takes a geographic area to search\nand returns a table of places counts per [H3](https://h3geo.org/docs/) cell in\nthe search area.\n\nBecause the `PLACES_COUNT_PER_GEO` function returns a table, call it using\na `FROM` clause.\n\n- Input parameters:\n\n - **Required** : The `geography` [filter parameter](/maps/documentation/placesinsights/experimental/filter-params) that\n specifies the search area. The `geography` parameter a value defined by\n the BigQuery\n [`GEOGRAPHY`](https://cloud.google.com/bigquery/docs/reference/standard-sql/data-types#geography_type)\n data type, which supports points, linestrings, and polygons.\n\n For examples of using different types of search geographies, such as\n viewports and lines, see\n [`PLACES_COUNT` function](/maps/documentation/placesinsights/experimental/places-count).\n - **Required** : The `h3_resolution` [filter parameter](/maps/documentation/placesinsights/experimental/filter-params) that\n specifies the [H3](https://h3geo.org/docs/) resolution used to aggregate\n the count of places in each H3 cell. Supported value are from 0 to 8.\n\n - **Optional** : Additional [filter](/maps/documentation/placesinsights/experimental/filter-params) parameters to refine\n your search.\n\n- Returns:\n\n - A table with one row per H3 cell. The table contains the columns `h3_cell_index` (`STRING`), `geography` (`GEOGRAPHY`) which defines the polygon representing the H3 cell, and `count` (`INT64`).\n\nExample: Count wheelchair accessible convenience and grocery stores per H3 cell\n\nThe example below computes the number of operational, wheelchair accessible\nconvenience and grocery stores per H3 cell in New York City. The H3 cells use a\n[resolution level](https://h3geo.org/docs/core-library/restable) of 8.\n\nThis example uses the [Overture Maps\nData](https://console.cloud.google.com/marketplace/product/bigquery-public-data/overture-maps)\nBigQuery [public dataset](https://cloud.google.com/bigquery/public-data) to get\nthe geography for New York City.\n| **Note:** Because the response table contains a `geography` field, you can visualize it using tools that support BigQuery `GEOGRAPHY` types. For an example of visualizing the results of a function, see [Visualize\nresults](#visualize_results). For more information and example on visualizing Places Insights results, see [Visualize query results](/maps/documentation/placesinsights/visualize-data). \n\n```googlesql\nDECLARE geo GEOGRAPHY;\n\n-- Get the geography for New York City.\nSET geo = (SELECT geometry FROM `bigquery-public-data.overture_maps.division_area`\n WHERE country = 'US' AND names.primary = 'City of New York' LIMIT 1);\n\nSELECT * FROM `maps-platform-analytics-hub.sample_places_insights_us.PLACES_COUNT_PER_H3`(\n JSON_OBJECT(\n 'geography', geo,\n 'types', [\"convenience_store\",\"grocery_store\"],\n 'wheelchair_accessible_entrance', true,\n 'business_status', ['OPERATIONAL'],\n 'h3_resolution', 8\n )\n);\n```\n\nThe response for the function:\n\nVisualize results\n\nThe following images show this data displayed in Looker Studio as a filled map.\nThe darker the H3 cell the higher the concentration of results:\n\nTo import your data into Looker Studio:\n\n1. Run the function above to generate the results.\n\n2. In the BigQuery results, click **Open in -\\\u003e Looker Studio**. Your results\n are automatically imported into Looker Studio.\n\n3. Looker Studio creates a default report page and initializes it with a title,\n table, and bar graph of the results.\n\n4. Select everything on the page and delete it.\n\n5. Click **Insert -\\\u003e Filled map** to add a filled map to your report.\n\n6. Under **Chart types -\\\u003e Setup** configure the fields as shown below::\n\n7. The filled map appears as above. You can optionally select **Chart types -\\\u003e\n Styles** to further configure the appearance of the map.\n\nFor more information and example on visualizing Places Insights results, see\n[Visualize query results](/maps/documentation/placesinsights/visualize-data)."]]